IWT-TETRA : Zongekoppelde Warmtepompsystemen ZON-WARM
|
|
|
- Roel Bakker
- 5 jaren geleden
- Aantal bezoeken:
Transcriptie
 IWT-TETRA 110183: Zongekoppelde Warmtepompsystemen ZON-WARM Eindverslag November 2011 Juli 2014 Deelnemende bedrijven Deelnemende")


1 Vlaamse Agentschap voor Innovatie door Wetenschap en Technologie ( IWT-TETRA : Zongekoppelde Warmtepompsystemen ZON-WARM Eindverslag November 2011 Juli 2014 Deelnemende bedrijven Deelnemende organisaties Projectmedewerkers: Jan Lhoëst Raf De Herdt Benjamin Verfaillie Michaël Parchine Projectmedewerkers en auteurs: Leen Goovaerts Dries Van Aken Jan Verheyen John Veeken Coördinatie en redactie: Maarten Sourbron Referentie: Sourbron M., Goovaerts L., Van Aken D., Verheyen J., Veeken J., IWT-TETRA : Zongekoppelde Warmtepompsystemen ZON-WARM, Nov Juli 2014, Eindverslag, Oktober 2014, Sint-katelijne-Waver, België Vakgroep Thermotechniek Technologiecampus De Nayer Faculteit Industriële Ingenieurswetenschappen KU Leuven Jan De Nayerlaan 5, 2860 Sint-Katelijne-Waver, België Tel.: + 32 (0) Maarten.Sourbron@kuleuven.be
2 IWT-TETRA : Zongekoppelde Warmtepompsystemen Eindverslag Auteurs: Leen Goovaerts, Dries Van Aken, Jan Verheyen, John Veeken, Maarten Sourbron Dit eindrapport bevat de volgende delen: Projectsamenvatting Eindverslag o Projectoverzicht en -beheer o Werkpakket 1: Technologische noden o Werkpakket 2: Literatuurstudie o Werkpakket 3: Systeemconfiguraties o Werkpakket 4: Modellering o Werkpakket 5: Metingen in labo en in situ o Werkpakket 6: Code van Goede Praktijk o Werkpakket 7: Kennsiverspreiding Copyright KU Leuven Zonder voorafgaande schriftelijke toestemming van zowel de auteur(s) als de redacteur(s) is overnemen, kopiëren, gebruiken of realiseren van deze uitgave of gedeelten ervan verboden. Voor aanvragen tot of informatie i.v.m. het overnemen en/of gebruik en/of realisatie van gedeelten uit deze publicatie, wend u tot KU Leuven Campus De Nayer, Jan De Nayerlaan 5, B-2860 Sint-Katelijne-Waver, of via iiw.thomasmore.denayer@kuleuven.be. Voorafgaande schriftelijke toestemming van de redacteur(s) is eveneens vereist voor het aanwenden van de in dit rapport beschreven (originele) methoden, producten, schakelingen en programma s voor industrieel of commercieel nut. 1
3 Thermische zonnecollectoren en warmtepompen werken samen: samenvatting van het ZonWarm-project Leen Goovaerts, Jan Verheyen, Dries Van Aken, John Veeken, Maarten Sourbron, KU Leuven-Technologiecampus De Nayer, Faculteit Industriële Ingenieurswetenschappen, Vakgroep Thermotechniek Een woning heeft (vaak) verwarming nodig en sanitair warm water moet geproduceerd worden. Thermische zonnecollectoren vangen zonnestralen op en geven die energie af in de vorm van warmte. Warmtepompen onttrekken warmte uit een omgevingsbron op lage temperatuur (bodem, buitenlucht, grondwater) en geven die op een hogere temperatuur af in de woning. Als het aanbod van warmte, via de zonnecollectoren en warmtepomp, de vraag aan warmte voor verwarming en sanitair warm water dekt, is de klus van de installateur warmtetechnieken geklaard. Maar hoe ziet een dergelijke gecombineerde installatie eruit? Figuur 1 toont de verschillende mogelijkheden. Welke dimensioneringsregels moeten gevolgd worden voor de verschillende componenten, hoe worden ze gekoppeld met elkaar en hoe wordt de regelaar ingesteld die een goede werking in alle omstandigheden moet garanderen? In het IWT-TETRA-project ZonWarm 1 werden enkele installaties onder de loep genomen en werd aan de hand van dynamisch-thermische simulaties het effect van installatieconcepten en parametervariaties onderzocht. Figuur 1: De warmte-aanbieders thermische zonnecollectoren en warmtepomp leveren warmte op twee temperatuurniveaus aan de warmte-vragers Sanitair Warm Water en RuimteVerwarming. 1 IWT-TETRA: en projectwebsite 1
4 Verschillende warmtebronnen werken samen Om de installatie te ontwerpen moeten eerst de eigenschappen van de warmtevraag en van de warmteproductie gekend zijn. De gevraagde hoeveelheid warmte moet (1) in de juiste hoeveelheid, (2) op de juiste temperatuur en (3) op het juiste moment geleverd worden door de installatie. Voor Sanitair Warm Water (SWW) is door het gepiekte verbruik een hoog vermogen nodig en een relatief hoge temperatuur van C. Verwarming kent doorheen de dag een constantere warmtevraag op een lagere temperatuur van C. Door de betere woningisolatie daalt bovendien de jaarlijkse benodigde hoeveelheid warmte, terwijl de vraag naar SWW constant blijft (Figuur 2). Figuur 2: Netto energiebehoefte voor RV en SWW voor drie referentiewoningen uit het ZonWarm-project De thermische zonnecollectoren (TZC) of de warmtepomp (WP) produceren de benodigde warmte. Zij gebruiken als energiebron respectievelijk de zon en een warmtebron op lage temperatuur zoals typisch de bodem of de buitenlucht. In tegenstelling tot een ketel met fossiele brandstoffen (...weliswaar gekeken vanuit het standpunt van de installatie...) is (1) de bruikbare hoeveelheid energie beperkt, (2) hebben deze energiebronnen geen onbeperkt vermogen, en (3) is deze energie, in het geval van de zon, niet op elk moment beschikbaar. Dit bemoeilijkt het ontwerp en de regeling van de installatie sterk. Figuur 1 toont de mogelijk combinaties: Parallelle opstelling: de warmtepomp gebruikt de lage temperatuurbron om warmte te leveren en als de zonnecollectoren voldoende warmte kunnen leveren aan de juiste temperatuur nemen zij over Serie-opstelling: de zonnecollectoren vorm de bron van de warmtepomp of warmen de lage temperatuurbron van de warmtepomp op (regeneratie) 2
5 De prestatiefactor Bij voorkeur moet de installatie de thermische zonnecollectoren gebruiken en als hun energie onvoldoende is in hoeveelheid of temperatuur, kan de warmtepomp bijspringen. De prestatiefactor 2, die de verhouding geeft tussen de geleverde warmte en de hoeveelheid elektriciteit die nodig is om de installatie te laten draaien, bepaalt deze volgorde. De TZC hebben een prestatiefactor die kan oplopen tot 160 of meer. Dit wil zeggen dat voor 1 kwh elektrisch pompverbruik, 160 kwh warmte wordt geleverd. De metingen van een reële installatie in het project bevestigen dat dit mogelijk is, alhoewel ook prestatiefactoren van 50 of zelfs maar 7 zijn opgemeten. Een correct installatieontwerp, -uitvoering en -regeling zijn dus cruciaal om het pompverbruik te beperken. De WP anderzijds heeft prestatiefactoren (vaak wordt de Engelse term Coefficient of Performance of COP genoemd in deze context) die typisch liggen tussen 3 en 5, afhankelijk van het type warmtepomp. Ook hier hebben ontwerp, uitvoering en regeling een grote invloed op de uiteindelijke prestatie van de WP. Energie bufferen? De typische gepiekte warmtevraag aan hoog vermogen van het SWW maakt, in combinatie met TZC en een WP, een thermische buffer noodzakelijk. Wanneer de TZC de temperatuur onvoldoende kunnen opvoeren voor SWW, door een te zwakke zoninstraling, kunnen ze mogelijk nog wel warmte leveren voor de ruimteverwarming. Omdat ook hier zelden vraag en aanbod gelijktijdig zijn, zal ook een thermische buffer voor RV nodig zijn. Soms zal die al aanwezig zijn om een goede werking van de warmtepomp te garanderen of werkt de vloerverwarming als thermische buffer. De buffers voor SWW en RV kunnen eventueel gecombineerd worden in een gezamenlijk combi-buffervat (zie Figuur 3). De metingen tonen aan dat reële installaties SPF-waarden van 5 en zelfs meer dan 6 halen bij dergelijke systemen, waarbij de TZC 30% tot 40% van de energie voor SWW en RVW leveren. Maar een thermische buffer verliest ook warmte. Zeker wanneer de energievraag kleiner wordt (zie Woning 1 uit Figuur 2 of wanneer de warmtevraag in tussenseizoenen klein is), kan het aandeel van het bufferverlies groot worden. Metingen op reële installaties van het ZonWarm-project toonden energieverliezen van 7% tot meer dan 40%. Dit laatste treedt op wanneer de installatie op deellast werkt en de thermische buffer op temperatuur gehouden wordt voor slechts een kleine energievraag. Overdimensionering van de buffer moet dus absoluut vermeden worden en de installateur moet aandacht schenken aan een correcte isolatie van de aansluitingen tussen buffervat en leidingen. Ook de positie van de hydraulische aansluitingen en de temperatuurvoelers die de regelaar aansturen, hebben een grote impact op de systeemprestatie. Foute positionering zorgt voor menging van de verschillende temperatuurniveaus waardoor bijvoorbeeld de TZC hogere temperaturen zien in het buffervat en dus minder energie kunnen leveren en waardoor de warmtepomp aan hogere afgiftetemperaturen moet werken met een lagere performantie tot gevolg. 2 Een prestatiefactor gemeten over een lange termijn van bv. 1 jaar wordt de SeizoensPrestatieFactor of SPF genoemd 3
6 Een simulatieanalyse van dergelijke niet optimale aansluitingen 3 toont aan dat dit de SPF met 1,0 kan doen dalen. Wanneer het temperatuurniveau van de TZC nog te laag is voor RV of de thermische buffers opgeladen zijn, kan bij een bodem-water WP overwogen worden om de bodemlussen te regenereren. Hierdoor stijgt de temperatuur van de bodem, wat de prestatiefactor van de warmtepomp ten goede komt. Wegens de te lage meetfrequentie bij de reële installaties was het moeilijk om hierover vanuit het ZonWarmproject concrete uitspraken te doen: van één installatie werd bij een 7 uur durende regeneratieperiode een prestatiefactor van 60 gemeten. De impact van deze energieinjectie van 60kWh en bijhorende bodemtemperatuurstijging van ongeveer 1 C op de prestatie van de warmtepomp is moeilijker te becijferen. Simulatiestudies 4 wijzen uit dat regeneratie de prestatiefactor met 0,2 kan doen stijgen. Een negatieve impact is echter ook mogelijk bij een slechte inregeling van de debieten. In dat geval zal de circulatiepomp die nodig is voor de regeneratie meer verbruiken dan dat het warmtepompverbruik zal dalen door de hogere prestatiefactor. Simulatieresultaten 3 installatietypes zijn gesimuleerd (Polysun software) voor 3 verschillende woningen (16, 50 en 150 kwh/m²), waarbij verschillende parameters gevarieerd werden om het effect op het energiegebruik te onderzoeken. Enkele belangrijke conclusies zijn dat het warmteverlies van de buffervaten en het parasitair energieverbruik van extra circulatiepompen een potentieel voordelige installatieaanpassing kunnen doen omslaan en resulteren in een hoger eindenergieverbruik. Net zoals blijkt uit de literatuurstudie en de eigen metingen op de installaties is er voor regeneratie van de bodem geen duidelijke conclusie te trekken. Wel moet hierbij vermeld worden dat het gebruikte simulatiemodel voor de bodem misschien ontoereikend was om gedetailleerd het effect van regeneratie te onderzoeken. Dit viel echter buiten het bereik van dit project. Over het algemeen profiteert de energiezuinige woning het meest van een geïnstalleerde zonwarmtepomp en hebben meerinvesteringen in extra zonnecollectoren er het grootste effect. Over het algemeen bleek de gevolgde dimensionering een correcte installatie op te leveren: De warmtepomp wordt gedimensioneerd volgens de Code van Goede Praktijk voor Warmtepompen 5 De zonnecollectoren gedimensioneerd worden volgens de basisrichtlijnen van WTCB (TV 212) 6 3 John Veeken, Jan Verheyen, Leen Goovaerts, Dries Van Aken, Maarten Sourbron, The impact of storage tank control and hydraulic configuration on solar heat pump system performance, System Simulation in Buildings 2014, December 2014, Liège, Belgium 4 Erik Bertram*, Peter Pärisch and Rainer Tepe, Impact of solar heat pump system concepts on seasonal performance-simulation studies, EuroSun 2006, June 2006, Glasgow, UK 5 ANRE; 2005; Code van goede praktijk voor de toepassing van warmtepompsystemen in de woningbouw; Ministerie van de Vlaamse Gemeenschap, afdeling natuurlijke rijkdommen en energie (ANRE); 2005; 4
7 WIE EERST? Zonnecollectoren genieten voorkeur bij de productie van warmte boven de warmtepomp. De SPF van zonnecollectoren (richtwaarde 50, maar waarden van 160 zijn ook opgemeten) is immers hoger dan die van de warmtepomp (richtwaarde 3 tot 5) BASISPRINCIPE DIMENSIONERING De warmtepomp wordt gedimensioneerd zonder rekening te houden met de zonnecollectoren. Bij afwezigheid van zonwarmte moet de installatie blijven draaien. De zonnecollectoren worden gedimensioneerd zonder rekening te houden met ruimteverwarming: de redenering is dat de lage temperatuurwarmte in de winter, die niet bruikbaar is voor SWW, wel kan gebruikt worden voor RV. WARMTEPOMP De warmtepomp wordt gedimensioneerd volgens de Code van Goede Praktij k 5 : Warmteverlies volgens EN12831 Opslag SWW = 1.2 x (max. dagvolume +40l) opwarmen op een gekozen tijd (bv. 4u) Q Warmtepomp = max (Q RV, Q SWW) ZONNECOLLECTOREN De zonnecollectoren + opslagvolume wordt gedimensioneerd volgens de TV212 van WTCB 6 Dagelijks warm waterverbruik bepalen (Bijlage 2 van TV212, IEA Task44, Code van Goede Praktijk voor warmtepompen: (Code) 50l/persoon.dag@40 C; (VDI2067) hoge eisen : l/persoon.dag@40 C, gemiddelde eisen : l/persoon.dag@40 C, lage eisen : l/persoon.dag@40 C. De Code rekent nog een marge voor piekverbruik en voor het niet volledig benutten van het buffervolume. 50 liter SWW-buffervolume per m² zonnecollector AANDACHTSPUNTEN Een keuze tussen systeemconcepten wordt niet gemaakt. Wel moet er met de volgende aandachtspunten rekening gehouden worden: Opslag van warmte leidt tot extra warmteverlies (opgemeten warmteverlieswaarden van 7% tot 40% van de totale warmteproductie) Een extra circulatiepomp leidt tot direct extra elektriciteitsverbruik met negatieve impact op het eindenergieverbruik Regeneratie van de bodem kan een positief effect hebben op de prestatie van de warmtepomp, maar kan ook een negatief effect hebben door het extra circulatiepompverbruik. Voorzichtig ontwerp, installatie en inregeling is noodzakelijk De hydraulische aansluiting en regeling van het buffervat is cruciaal voor een hoge SPF. Temperatuurslagen mogen niet vermengd worden 6 WTCB; 1999; TV 212 leidraad voor de installatie van zonneboilers; Wetenschappelijk en Technisch Centrum voor het Bouwbedrijf; 2e uitgave; Brussel; juni 1999; 5
8 Besluit Het combineren van thermische zonne-energie met warmtepompen voor zowel sanitair warm water productie als voor ondersteuning van de ruimteverwarming blijkt een positieve impact op de prestatie van de totale installatie te hebben. Regeneratie van de bodem met zonnewarmte heeft echter een minder duidelijk effect. Net zoals vaak het geval is, zijn ook deze installaties erg gevoelig aan fouten bij ontwerp, plaatsing en inregeling, met een aanzienlijke impact op de systeemprestatie als gevolg. Eenvoudige en robuuste systeemconcepten zijn duidelijk te verkiezen boven ingewikkelde installaties met complexe regelingen, waarbij secundaire effecten gemakkelijk over het hoofd gezien worden. De steeds verdere daling van de energievraag (voor ruimteverwarming), maakt de aandacht voor warmteverlies van bijvoorbeeld buffervaten of ongeïsoleerde leidingdelen absoluut noodzakelijk. Figuur 3: Principeschema van een zonwarmtepomp met SWW- en RV-ondersteuning en met regeneratie van de bodemlussen door de thermische zonnecollectoren (Q: thermische energiestromen, E: elektrische energiestromen) 6
9 Over IWT-TETRA ZonWarm Het ZonWarm project ( liep in samenwerking met de volgende bedrijven en partners: ACV Belgium, Baxi, Buderus, Daikin, Eco Heating, Ecompany, Elco, Energieconcepten, IZEN Energy Systems, Lambrechts, Thermoduct, MiNi Energietechniek, Nathan, Nibe, Ra-collectoren, Sanutal, Stiebel Eltron, Thercon, Van Rompaey en Viessmann; de Sectorassociatie voor Thermische Zonne-energie en Zonneboilers (Belsolar), European Heat Pump Association (EHPA), Overlegplatform voor Energiedeskundigen (OVED), Vlaams Elektro Innovatiecentrum (Tecnolec), Vlaams Energieagentschap (VEA), Vlaamse Confederatie Bouw (VCB), Vlaamse Instelling voor Technologisch Onderzoek (VITO), Warmtepomp Platform (WPP) en het Wetenschappelijk en Technisch Centrum voor het Bouwbedrijf (WTCB) 7
10 IWT-TETRA : Zongekoppelde Warmtepompsystemen ZON-WARM Eindverslag: projectoverzicht Vakgroep Thermotechniek, Technologiecampus De Nayer Faculteit Industriële Ingenieurswetenschappen, KU Leuven Jan De Nayerlaan 5, 2860 Sint-Katelijne-Waver, België Tel.: + 32 (0) Maarten.Sourbron@kuleuven.be Auteurs: Redactie: Leen Goovaerts Dries Van Aken Jan Verheyen John Veeken Maarten Sourbron
11 IWT-TETRA : Zongekoppelde Warmtepompsystemen Eindverslag: Projectoverzicht Auteurs: Leen Goovaerts, Dries Van Aken, Jan Verheyen, John Veeken, Maarten Sourbron Copyright KU Leuven Zonder voorafgaande schriftelijke toestemming van zowel de auteur(s) als de redacteur(s) is overnemen, kopiëren, gebruiken of realiseren van deze uitgave of gedeelten ervan verboden. Voor aanvragen tot of informatie i.v.m. het overnemen en/of gebruik en/of realisatie van gedeelten uit deze publicatie, wend u tot KU Leuven Campus De Nayer, Jan De Nayerlaan 5, B-2860 Sint-Katelijne-Waver, of via iiw.thomasmore.denayer@kuleuven.be. Voorafgaande schriftelijke toestemming van de redacteur(s) is eveneens vereist voor het aanwenden van de in dit rapport beschreven (originele) methoden, producten, schakelingen en programma s voor industrieel of commercieel nut. 1
12 IWT-TETRA : Zongekoppelde Warmtepompsystemen Eindverslag: Projectoverzicht Auteurs: Leen Goovaerts, Dries Van Aken, Jan Verheyen, John Veeken, Maarten Sourbron Inhoudstafel 1 Het ZonWarm-project Bedrijven Situering, Projectdoelstellingen en Innovativiteit Probleemstelling Projectdoelstellingen Projectverloop Globaal overzicht van het project Basisgegevens uit IEA-SHC task44/hpp annex Typewoningen uit TASK Installatiecategorieën uit TASK Gekozen systeemconcepten in het ZonWarm project Installaties in labo Installaties op locatie Gesimuleerde installaties Management verslag Tijdsverloop en projectverlenging Personeelsbestand (zie ook financieel verslag) Projectbegroting Vergaderingen van de gebruikerscommissie Overzicht werkpakketten Bijlagen
13 IWT-TETRA : Zongekoppelde Warmtepompsystemen Eindverslag: Projectoverzicht Auteurs: Leen Goovaerts, Dries Van Aken, Jan Verheyen, John Veeken, Maarten Sourbron 1 Het ZonWarm-project ZonWarm Warmtepomp en thermische zonnecollectoren produceren samen warmte voor verwarming en sanitair warm water: de zonwarmtepomp ZonWarm is een IWT-TETRA project ( (september 2011 juli 2014) waarin zongekoppelde warmtepompsystemen worden onderzocht. In het project worden installaties onder de loep genomen waarbij een warmtepomp gecombineerd wordt met een zonneboiler om te voorzien in zowel ruimteverwarming als sanitair warm water. De concrete vraag die hieruit voorkomt is: wat is de meerwaarde van een zonneboiler op een installatie die reeds een warmtepomp bevat? Projectmedewerkers Leen Goovaerts, Jan Verheyen, Dries Van Aken, John Veeken, Maarten Sourbron, KULeuven-Technologiecampus De Nayer Faculteit Industriële Ingenieurswetenschappen, Vakgroep Thermotechniek Contact: Tel: Maarten.Sourbron@kuleuven.be 3
14 IWT-TETRA : Zongekoppelde Warmtepompsystemen Eindverslag: Projectoverzicht Auteurs: Leen Goovaerts, Dries Van Aken, Jan Verheyen, John Veeken, Maarten Sourbron 2 Bedrijven De vakgroep Thermotechniek van KU Leuven, technologiecampus De Nayer dankt de volgende bedrijven en organisaties voor hun steun aan het IWT-TETRA project ZonWarm: PROJECTSUBSIDIERING EN OPVOLGING Vlaamse Agentschap voor Innovatie door Wetenschap en Technologie (IWT) BEDRIJVEN (in alfabetische volgorde) ACV Belgium Baxi BOSH/ BUDERUS Camair Daikin Eco Heating Ecompany Elco Energieconcepten IZEN Energy Systems Lambrechts MiNi Energietechniek Nathan Import/Export Nibe Ra-collectoren Sanutal Stiebel Eltron Thercon M=ECO³ (thermoduct) Viessmann
15 IWT-TETRA : Zongekoppelde Warmtepompsystemen Eindverslag: Projectoverzicht Auteurs: Leen Goovaerts, Dries Van Aken, Jan Verheyen, John Veeken, Maarten Sourbron PARTNERORGANISATIES Sectorassociatie voor Thermische Zonneenergie en Zonneboilers (Belsolar) European Heat Pump Association (EHPA) Overlegplatform voor Energiedeskundigen (OVED) Vlaams Elektro Innovatiecentrum (Tecnolec) Vlaams Energieagentschap (VEA) Vlaamse Confederatie Bouw (VCB) Vlaamse Instelling voor Technologisch Onderzoek (VITO) Warmtepomp Platform (WPP) Wetenschappelijk en Technisch Centrum voor het Bouwbedrijf (WTCB)
16 IWT-TETRA : Zongekoppelde Warmtepompsystemen Eindverslag: Projectoverzicht Auteurs: Leen Goovaerts, Dries Van Aken, Jan Verheyen, John Veeken, Maarten Sourbron 3 Situering, Projectdoelstellingen en Innovativiteit Uittreksel uit de projectaanvraag. 3.1 Probleemstelling Gebouwen zijn verantwoordelijk voor 40% van het energieverbruik en 36% van de Europese CO2- emissies. De energieprestaties van gebouwen zijn dan ook de sleutel om de Europese klimaat- en energiedoelstellingen, namelijk 20% reductie broeikasgassen tegen 2020 en 20% energiebesparing tegen 2020, te bereiken. Het verbeteren van de energieprestaties van gebouwen is een kostenefficiënte manier om in te gaan tegen de klimaatverandering en om de energiebevoorradingszekerheid te waarborgen, terwijl er tegelijkertijd jobs worden gecreëerd, vooral in de bouwsector. In mei 2010 legde Europa via de EPBD-recast richtlijn o.a. duidelijke ambities vast op het vlak van energieprestaties van gebouwen, zowel voor nieuwbouw als renovatie [1]. Deze projectaanvraag beoogt een significante bijdrage aan deze EPBD-recast doelstellingen. Daarnaast dient de overheid maatregelen te nemen om hernieuwbare energietoepassingen te promoten om te voldoen aan deze doelstellingen [2]. Dit heeft o.a. geleid tot het opzetten van een campagne rond groene warmte, waarbij verschillende technieken gepromoot worden, o.a. de zonneboiler en de warmtepomp [3]. De laatste jaren zijn dan ook een stijgend aantal verschillende systemen en concepten voor ruimteverwarming en aanmaak van sanitair warm water ontwikkeld die gebruik maken van zonthermische systemen en/of warmtepompen. Actieve promotie van warmtepompen en moderne efficiënte toestellen hebben geleid tot een groeiende marktpenetratie van elektrische warmtepompen. De markt op vandaag wordt zowel gedreven vanuit ecologische overwegingen als vanuit een aanbod aan verschillende steunmaatregelen. Zowel de warmtepomp- als de zonthermische industrie hebben de voorbije jaren op grote beurzen de eerste gekoppelde systemen gepresenteerd. Sommige fabrikanten zijn een nauwe samenwerking aangegaan om een gekoppeld systeem te ontwikkelen. In dit nieuwe marktsegment echter hebben de meeste aanbieders een achtergrond in een van de twee basistechnologieën, nl. ofwel komende vanuit de warmtepompsector ofwel komende vanuit de zonthermische sector. Dit betekent niet meteen dat de combinatie leidt tot een optimaal systeem: - in sommige gevallen worden de systeemcomponenten gewoon naast elkaar geplaatst zonder enige gecoördineerde interactie. De zonne-energie wordt voornamelijk gebruikt om het elektriciteitsverbruik voor de aanmaak van sanitair warm water te verminderen en dus wordt de warmtepomp gewoon naast het zonthermische systeem geïnstalleerd zonder enige integratie - in andere gevallen wordt de warmtepomp geïnstalleerd als een manier om de zonnewinst van de collectoren te verhogen. De warmtepomp laat namelijk toe om zonnewarmte te 6
17 IWT-TETRA : Zongekoppelde Warmtepompsystemen Eindverslag: Projectoverzicht Auteurs: Leen Goovaerts, Dries Van Aken, Jan Verheyen, John Veeken, Maarten Sourbron gebruiken zelfs als de temperatuur lager is dan de benodigde temperatuur van de vraagzijde (voor verwarming of aanmaak van sanitair warm water). Dit principe bestond 30 jaar geleden al maar wint nu opnieuw aan belang in situaties waar de grond of de lucht geen ideale bronnen zijn - tenslotte zijn er ook totaalsystemen mogelijk waar de zonnewarmte wordt gebruikt als belangrijkste bron voor de warmtepomp, direct of indirect, m.a.w. beide opwekkers worden ontkoppeld d.m.v. relatief grote warmteopslag. Deze opslag kan voelbaar of latent gebeuren (vb. PCM) en op korte of lange termijn (vb. bodemgeneratie). In deze configuratie kan gesproken worden van een echte koppeling of integratie van beide systemen Hoewel sommige publicaties de koppeling tussen zonthermische systemen en warmtepompen beschrijven, is er nog geen systematische analyse van de verschillende installatieconcepten en de toepassingsmogelijkheden binnen verschillende sectoren en onder verschillende condities uitgevoerd in Vlaanderen. Binnen het IWT-VIS-TRAJECT SMART-GEOTHERM wordt bijvoorbeeld wel de mogelijkheid onderzocht om thermische zonne-energie aan te wenden voor verwarming en koeling, maar dit onderzoek is niet de hoofdbetrachting binnen het project en bovendien ligt de klemtoon op (middel)grote gebouwen [4]. Enkel systemen en concepten van hoge kwaliteit zijn een garantie voor een duurzame ontwikkeling van dit type combinaties van zonthermische systemen en warmtepompen op de Vlaamse residentiële markt. Om die hoge kwaliteit te bereiken is er behoefte aan concurrentie en vergelijking. Concurrentie is al aanwezig in beide deelsectoren (zonthermie en warmtepompen). Eerlijke en onafhankelijke vergelijking is enkel mogelijk mits een door iedereen erkende aanpak voor systeemkarakterisatie en rendementsbepaling (vanuit IEA SHC Task 44) en een gelijkaardige toepassing van de verschillende Europese normen. Zoniet zullen er vele installaties geplaatst worden die slechte resultaten en ontevreden klanten opleveren, wat nefast is voor deze nieuwe markt van gecombineerde systemen, met als gevolg ook dat de meer ontwikkelde afzonderlijke markten van zonthermische systemen en warmtepompen er nadelige gevolgen van zullen ondervinden. De primaire doelgroepen voor dit project zijn enerzijds de leveranciers en fabrikanten van materiaal voor zonne-energie- en warmtepompsystemen en anderzijds de ontwerpers van deze installaties. Dit zijn de architecten, installateurs, putboorders en studiebureaus. De actieve bedrijven uit de doelgroep hebben zich o.a. verenigd in het Warmtepomp Platform (WPP) en Associatie voor de Thermische Technieken van België Sectie 5 (Belsolar) en zijn de concrete aanstuurders van deze projectaanvraag. [1] Richtlijn 2010/31/EU van het Europees Parlement en de Raad van 19 mei 2010 betreffende de energieprestatie van gebouwen (herschikking) [2] Richtlijn 2009/28/EG van het Europees Parlement en de Raad van 23 april 2009 ter bevordering van het gebruik van energie uit hernieuwbare bronnen [3] laatst bekeken op 3 februari
18 IWT-TETRA : Zongekoppelde Warmtepompsystemen Eindverslag: Projectoverzicht Auteurs: Leen Goovaerts, Dries Van Aken, Jan Verheyen, John Veeken, Maarten Sourbron [4] IWT-VIS-TRAJECT SMART-GEOTHERM Mobiliseren van thermische energieopslag en thermische inertie in grondgekoppelde concepten voor de slimme verwarming en koeling van(middel)grote gebouwen 3.2 Projectdoelstellingen Het project beoogde de knelpunten weg te werken die een ruime toepassing van de combinatie van zon(thermische) systemen en warmtepompen in de weg staan. Hierbij wordt voornamelijk bedoeld het gebrek aan kennis omtrent het te kiezen installatieconcept enerzijds en het gebrek aan betrouwbare cijfers over haalbare rendementen anderzijds. De doelstelling van dit project is een grotere marktaanvaarding en een verhoogde kwaliteit van gekoppelde zon(thermische) systemen en warmtepompen zodat deze succesvol in de markt kunnen penetreren. Dit project laat de bedrijven toe extra toegevoegde waarde te creëren door individuele systemen te combineren tot een gecombineerd systeem met een hogere performantie dan de som van de delen. Binnen dit project werd de klemtoon gelegd op zonthermische systemen (zonnecollectoren, energiedak, ) in combinatie met warmtepompen gericht op verwarming of aanmaak van sanitair warm water in residentiële gebouwen. Er werd dan ook onderzoek gedaan op kleinschalige systemen voor verwarming of aanmaak van sanitair warm water in huizen of appartementen met een zonnecollector, een warmtepomp en eventueel een opslagsysteem als belangrijkste elementen. 8
19 IWT-TETRA : Zongekoppelde Warmtepompsystemen Eindverslag: Projectoverzicht Auteurs: Leen Goovaerts, Dries Van Aken, Jan Verheyen, John Veeken, Maarten Sourbron 4 Projectverloop 4.1 Globaal overzicht van het project In dit project zijn er 3 verschillende paden gevolgd om op de hoofdvraag een antwoord te bieden (zie Figuur 1): metingen in labo, metingen op locatie en simulaties. Zo zijn er 2 installaties geplaatst in het thermodynamisch labo van KU Leuven, campus De Nayer. Verder zijn er 4 installaties op locatie geselecteerd om metingen in realistische omstandigheden uit te voeren. Ten derde worden er simulaties gemaakt van deze installaties. Deze 3 delen worden niet onafhankelijk van elkaar uitgevoerd. De installaties in het labo hebben tot doel om nauwkeurigere metingen te kunnen uitvoeren onder meer gecontroleerde omstandigheden (de concrete resultaten zijn echter eerder beperkt zoals toegelicht wordt in het eindverslag van Werkpakket 5). Bij de installaties op locatie liggen de instellingen van de installatie vast en geven de metingen een reëel beeld van hoe een zongekoppelde warmtepomp in een woning presteert. Met de simulaties in Polysun ( verifiëren we in de eerste plaats de bestaande installaties, zowel in het labo als op locatie. In 2 de instantie worden de simulaties gebruikt om uit te zoeken welke parameters de grootste invloed hebben op de performantie van het systeem en om de installaties te optimaliseren zodat ze maximaal gebruik maken van de zonneboiler. Zonwarm Metingen (concrete ervaringsgegevens van de installaties verzamelen) Simulaties (volledig gecontroleerde omstandigheden) Op locatie (real life) Vergelijking van verschillende configuraties en parameteranalyse In labo (meer gecontroleerde omstandigheden, nauwkeuriger metingen) Figuur 1: Projectschema met de verschillende takenpakketten 9


20 IWT-TETRA : Zongekoppelde Warmtepompsystemen Eindverslag: Projectoverzicht Auteurs: Leen Goovaerts, Dries Van Aken, Jan Verheyen, John Veeken, Maarten Sourbron 4.2 Basisgegevens uit IEA-SHC task44/hpp annex 38 Het ZonWarm project heeft zich aangesloten bij het IEA-SHC task 44 / HPP annex 38-project Solar and Heat Pump systems ( kortweg TASK44 genoemd. Dit heeft het mogelijk gemaakt om een belangrijk deel van het projectwerk gezamenlijk met de andere partners in TASK44. Vooral Werkpakket 4, waarin het simulatiewerk aan bod kwam, heeft hiervan kunnen profiteren. Task 44 aims at optimizing combinations of solar thermal energy and heat pump, primarily for one family houses. The following items are in focus: Small-scale residential heating and hot water systems that use heat pumps and any type of solar thermal collectors as the main components. Systems offered as one product from a system supplier/manufacturer and that are installed by an installer. Electrically driven heat pumps, but during the development of performance assessment methods thermally driven heat pumps will not be excluded. Market available solutions and advanced solutions (produced during the course of the Task) Typewoningen uit TASK44 Voor de simulaties zijn drie typewoningen overgenomen uit het TASK44-project. Het gaat om: SFH15: passiefhuisstandaard (uiteindelijk net geen PH) SFH45: goede huidige standaard SFH100: niet-gerenoveerde woning De warmtevraag voor verwarming en warm water is getoond in Figuur 2. Het feit dat de warmtevraag voor verwarming gelijk wordt aan die voor sanitair warm water zal een grote rol spelen bij de interpretatie van de simulatieresultaten. 10
21 IWT-TETRA : Zongekoppelde Warmtepompsystemen Eindverslag: Projectoverzicht Auteurs: Leen Goovaerts, Dries Van Aken, Jan Verheyen, John Veeken, Maarten Sourbron Figuur 2: Netto energiebehoefte voor RV en SWW voor drie referentiewoningen uit het ZonWarm-project Installatiecategorieën uit TASK44 In het Europese project van IEA werden 7 categorieën van installatietypes naar voor geschoven als standaard zonwarmtepomp installaties. Uiteraard kan hierop nog gevarieerd worden, maar hiermee is de basis geschetst. Elke gemeten of gesimuleerde installatie in dit project kan in één van deze 7 categorieën worden ingedeeld. 1. One beside the other 2. Active regeneration 3. Big buffer storage 4. Maximal integration 5. Unglazed collector 6. Solar heating system 7. Ambient air heat pump 11

22 IWT-TETRA : Zongekoppelde Warmtepompsystemen Eindverslag: Projectoverzicht Auteurs: Leen Goovaerts, Dries Van Aken, Jan Verheyen, John Veeken, Maarten Sourbron Figuur 3: 7 categorieën van type-zonwarmtepompen uit TASK Gekozen systeemconcepten in het ZonWarm project Binnen het ZonWarm-project werden de volgende installatieconcepten opgemeten en/of gesimuleerd. In de volgende paragrafen en in Werkpakket 4 en 5 worden deze installaties verder toegelicht. Tabel 1: Overzicht van de opgemeten en gesimuleerde installaties 1 TASK44 TASK44 beschrijving Labometingen In-situ- Simulaties categorie metingen 1 One beside the other Beverlo SYS-REF 2 Active regeneration Betekom, Noorderwijk SYS-REG 4 Maximal integration Labo-grond SYS-COMBI 7 Ambient air heat pump Labo-lucht Lede 1 In de simulatie-code zijn andere benamingen gebruikt: SYS-REF=SYS2; SYS-REG=SYS3; SYS-COMBI=SYS1 12

23 IWT-TETRA : Zongekoppelde Warmtepompsystemen Eindverslag: Projectoverzicht Auteurs: Leen Goovaerts, Dries Van Aken, Jan Verheyen, John Veeken, Maarten Sourbron 4.4 Installaties in labo De installaties in labo zijn volgens de principeschema s uit Figuur 4 opgebouwd. Tabel 2 verklaart de nummering bij de schema s. Een verdere detaillering van de installaties uit Figuur 4 is te vinden in Werkpakket 5: Metingen in situ en in labo. Labo Lucht (TASK44 categorie 7) Labo Grond (TASK44 categorie 4) Figuur 4: Principeschema s van de installaties in labo Tabel 2: Legende van de metingen bij principeschema s van de installaties Nummer Afkorting Omschrijving 1 P wp Elektriciteit warmtepomp (compressor + eventuele circulatiepompen die via de warmtepomp gevoed worden) De onderverdeling 1.1, 1.2, staat voor het andere elektriciteitsverbruik dan de compressor, maar dat ook in het geheel van het elektriciteitsverbruik van de warmtepomp opgemeten wordt. 2 P zon Elektriciteit pomp zonneboiler 3 P rvw Elektriciteit pomp ruimteverwarming 4 Q zon,opwek,tot Thermische energie uit de zonnepanelen in totaal 5 Q zon,rvw Thermische energie uit de zonnepanelen gebruikt voor ruimteverwarming 6 Q zon,sww Thermische energie uit de zonnepanelen gebruikt voor sanitair warm water 7 Q wp,rvw Thermische energie opgewekt door de warmtepomp voor ruimteverwarming 8 Q afgifte,rvw Thermische energie afgegeven voor ruimteverwarming 9 Q wp,sww Thermische energie opgewekt door de warmtepomp voor sanitair warm water 10 Q afgifte,sww Thermische energie afgegeven voor sanitair warm water 11 Q wp Thermische energie opgewekt door warmtepomp 12 Q reg Thermische energie gebruikt voor regeneratie van de bodem 13 Q bron Thermische energie afkomstig van de bron (bodem, buitenlucht) Tabel 3 toont de parameters van deze twee labo-installaties. 13
 10,2 kw (0 C/35 C) Oppervlakte")
24 IWT-TETRA : Zongekoppelde Warmtepompsystemen Eindverslag: Projectoverzicht Auteurs: Leen Goovaerts, Dries Van Aken, Jan Verheyen, John Veeken, Maarten Sourbron Tabel 3: Gegevens per labo-installatie Installatie Daikin warmtepomp Viessmann warmtepomp Type warmtepomp Lucht/water Verticale bodem/water Vermogen warmtepomp 4,80 kw (2 C/35 C) 10,2 kw (0 C/35 C) Oppervlakte zonnecollectoren en type 3,02 m 2 Vacuümbuis 13,66 m 2 Vlakkeplaat Buffer Gescheiden Volume (300 l l) Gecombineerd volume (760 l) Op deze installaties zijn de nodige meters (Nummer 1,2,4,7,8,9,10) geplaatst om de totaal verbruikte elektriciteit, totale zonnewarmte en de totale afgegeven warmte (aan zowel sanitair als vloerverwarming) te bepalen. Aan de hand van de totale verbruikte elektriciteit en de totale afgegeven warmte, kan de SPF van de gehele installatie en van de warmtepomp berekend worden. Aan de hand van de zonnewarmte wordt de zonnefractie berekend en over de buffervaten wordt het warmteverlies opgemeten. 4.5 Installaties op locatie Er zijn 4 installaties op locatie waar metingen plaatsvinden, waarvoor Figuur 5 de schema s toont en Tabel 4 de parameters. De legende van de metingen is identiek aan die van de labometingen (zie Tabel 2). Betekom (TASK44-categorie 2) Beverlo (TASK44 categorie 1) Lede (TASK44-categorie 7) Noorderwijk (TASK44-categorie 2) Figuur 5: Principeschema s van de installaties op locatie 14
25 IWT-TETRA : Zongekoppelde Warmtepompsystemen Eindverslag: Projectoverzicht Auteurs: Leen Goovaerts, Dries Van Aken, Jan Verheyen, John Veeken, Maarten Sourbron Tabel 4: Gegevens per installatie op locatie Plaats Type warmtepomp Vermogen warmtepomp Betekom Verticale bodem/water 6,85 kw (0 C/35 C) Beverlo Verticale 10 kw bodem/water (0 C/35 C) Lede Lucht/water 18 kw (2 C/35 C) Noorderwijk Verticale 15,1 kw bodem/water (0 C/35 C) Oppervlakte zonnecollectoren en type 10 m² Vlakkeplaat 4,76 m² Vlakkeplaat 7,08 m² Vlakkeplaat 17 m² Vacuümbuis Buffer Gescheiden volume Gescheiden volume Gecombineerd volume Gescheiden volume 4.6 Gesimuleerde installaties De 4 zonwarmtepomp-installaties uit Figuur 6 zijn gesimuleerd. Op basis van de technologieverkenning, literatuurstudie (WP2) en de registratie van de technologische noden van de bedrijven (zie WP1), werden deze installatieschema s geselecteerd. Ze zijn in te delen in de categorieën van TASK44 als volgt 2 : 1. SYS-REF: TASK44-categorie 1 2. SYS-COMBI: TASK44-categorie 4 3. SYS-REG: TASK44-categorie 2 2 In de simulatie-code zijn andere benamingen gebruikt: SYS-REF=SYS2; SYS-REG=SYS3; SYS-COMBI=SYS1 15
26 IWT-TETRA : Zongekoppelde Warmtepompsystemen Eindverslag: Projectoverzicht Auteurs: Leen Goovaerts, Dries Van Aken, Jan Verheyen, John Veeken, Maarten Sourbron SYS-REF SYS-COMBI SYS-REG Figuur 6: Gesimuleerde zonarmtepompen (SYS-REG: TASK44-categorie 1; SYS-COMBI: TASK44-categorie 4; SYS-REG: TASK44-categorie 2) 16
27 IWT-TETRA : Zongekoppelde Warmtepompsystemen Eindverslag: Projectoverzicht Auteurs: Leen Goovaerts, Dries Van Aken, Jan Verheyen, John Veeken, Maarten Sourbron 5 Management verslag 5.1 Tijdsverloop en projectverlenging De oorspronkelijke projecttiming: 1/11/ /10/2013 (24 maanden). In oktober 2013 werd echter een verlengingsaanvraag (zie bijlage) gedaan omwille van de volgende redenen: 1. De heraanleg van het centrale campusplein, waardoor het bestaande labogebouw werd afgebroken. Dit verplichtte ons om de basis-laboinfrastructuur waarmee de warmtepompinstallaties uitgemeten worden, te herbouwen op de nieuwe locatie. De tijd die hieraan door de projectingenieurs is besteed, werd afgehouden van de projecttiming (zie gearceerde maanden in de tijdstabel (ppt in bijlage op p7). 2. Groot verloop op vlak van personeel: Het vroegtijdig vertrek van projectingenieur Raf De Herdt (september 2012, zie 5.2). Daarnaast heeft Benjamin Verfaillie beslist om vanaf oktober 2013 ook zijn contract stop te zetten, en zal Jan Verheyen vanaf januari voor 50% op het project werken (zie ppt in bijlage op p7), met een door de campus verplicht aandeel van 20% voor didactische taken. Omwille van deze vertraging is in september 2013 een verlenging van de projectduur aangevraagd bij IWT en toegekend door IWT op : de nieuwe projecttermijn liep dan van 1/11/2011 tot 31/7/2014, zonder wijziging aan het budget (zie bijlage). Het projectteam werd, buiten Jan Verheyen, volledig vernieuwd: Projectmedewerker VTE Periode Taakbeschrijving Leen Goovaerts (50%) 21/10/ /07/2014 Metingen in-situ Dries Van Aken (100%) 20/11/ /07/2014 Metingen in labo Jan Verheyen (80%) (50%) 1/12/ /12/2013 1/01/ /07/2014 John Veeken (50%) 10/02/ /07/2014 Simulaties Maarten Sourbron (PM) Projectcoördinatie Simulaties, kennisoverdracht naar studenten en didactiek Verder is het project vanaf 1/10/2014 onder de vleugels van KU Leuven verdergezet, omwille van de inkanteling van de opleiding industrieel ingenieur in de KU Leuven (en uit de hogeschool Thomas More). 5.2 Personeelsbestand (zie ook financieel verslag) Het groot personeelsverloop en grote vertraging door de onvoorziene beslissing van de ThomasMore hogeschool om de laboruimte, waar de testopstelling uit werkpakket 5 zou uitgebouwd worden, af te breken (zie vorige paragraaf), hebben qua timing een onherroepelijke impact op het projectverloop gehad, wat een belangrijke correctie noodzakelijk maakte. De tijdsbesteding op het project wordt opgesplitst in een gedeelte ten laste van het project (Tabel 5) en een gedeelte betaald uit de overhead-middelen van de onderzoeksgroep 17
28 IWT-TETRA : Zongekoppelde Warmtepompsystemen Eindverslag: Projectoverzicht Auteurs: Leen Goovaerts, Dries Van Aken, Jan Verheyen, John Veeken, Maarten Sourbron Tabel 6). Zoals gemeld in het voortgangsverslag van de GC-vergadering van , werd beslist om John Veeken (expert op vlak van HVAC-installaties in gebouwen en hun regeling) 6 maanden halftijds (3MM) op het project in te zetten om het simulatiewerk tot resultaat te leiden. Omdat de personeelsmiddelen van het project hiertoe ontoereikend waren, werden hiervoor middelen van de onderzoeksgroep ingezet: verdeling 1/10 op personeelsbudget 9/10 op middelen onderzoeksgroep. Tabel 5: Overzicht van de tijdsbesteding ten laste van het project Naam Totaal Jan Lhoëst Raf De Herdt Benjamin Verfaillie Jan Verheyen Leen Goovaerts Dries Van Aken John Veeken TOTAAL Michaël Parchine (PM) 9 9 (PM) Maarten Sourbron (PM) (PM) Tabel 6: Overzicht van de tijdsbesteding ten laste van de overhead van de onderzoeksgroep Naam Totaal John Veeken TOTAAL
29 IWT-TETRA : Zongekoppelde Warmtepompsystemen Eindverslag: Projectoverzicht Auteurs: Leen Goovaerts, Dries Van Aken, Jan Verheyen, John Veeken, Maarten Sourbron 6 Projectbegroting Tabel 7 toont het overzicht van de projectbegroting. Details zijn in het financieel verslag terug te vinden. Tabel 7: Personeelsbegroting en werkingsmiddelen (zie ook financieel verslag) Voorzien Uitgegeven op project op eigen middelen Personeelsbudget ,17 (6%) Werkingsbudget ,72 Ontvangen subsidies van IWT (92,5%)
30 IWT-TETRA : Zongekoppelde Warmtepompsystemen Eindverslag: Projectoverzicht Auteurs: Leen Goovaerts, Dries Van Aken, Jan Verheyen, John Veeken, Maarten Sourbron 6.1 Vergaderingen van de gebruikerscommissie Volgens de projectplanning moesten er per jaar 3 vergaderingen van de gebruikerscommissie georganiseerd worden (6 GC s op 2 jaar). De volgende 7 vergaderingen van de gebruikerscommissie zijn gehouden: 1. 16/11/2011: Startvergadering 2. 15/03/ /09/ /04/ /01/ /06/ /11/2014 en 5/12/2014: Eindvergadering De verslagen van de van gebruikerscommissievergaderingen zijn beschikbaar bij de onderzoeksgroep. 20

31 IWT-TETRA : Zongekoppelde Warmtepompsystemen Eindverslag: Projectoverzicht Auteurs: Leen Goovaerts, Dries Van Aken, Jan Verheyen, John Veeken, Maarten Sourbron 7 Overzicht werkpakketten Om de projectdoelstellingen te bereiken werden de volgende werkpakketten opgesteld. - WP0: Projectbeheer - WP1: Technologische noden van de bedrijfswereld - WP2: Literatuurstudie o WP2T1: Theoretische en toepassingsgerichte achtergrondinformatie o WP2T2: Literatuur en informatiebank - WP3: Analyse en evaluatie van bestaande systeemconfiguraties o WP3T1: Selectietabel systeemconfiguraties o WP3T2: Selectie haalbare systeemconfiguraties - WP4: Modellering geselecteerde systeemconfiguraties o WP4T1:Parameteranalyse o WP4T2:Dimensioneringsrichtlijnen - WP5: Meetcampagne systeemrendement o WP5T1: Gedetailleerde labometing o WP5T2: Opstellen uniforme meetkit o WP5T3: Metingen op reële installaties - WP6: Code van Goede Praktijk en selectie- en berekeningstool o WP6T1: Opstellen/aanvullen Code van Goede Praktijk o WP6T2: Selectie en berekeningstool o WP6T3: Verrekening in EPB - WP7: Verspreiding naar de ruimere doelgroep o WP7T1: Website o WP7T2: Publiceren van (wetenschappelijke) artikels o WP7T3: Studiedagen/workshops Figuur 7: Overzicht van de werkpakketten van het ZonWarm project 21
32 IWT-TETRA : Zongekoppelde Warmtepompsystemen Eindverslag: Projectoverzicht Auteurs: Leen Goovaerts, Dries Van Aken, Jan Verheyen, John Veeken, Maarten Sourbron 8 Bijlagen 1. Projectaanvraag 2. Projectcontract 3. Verlengingsaanvraag 4. Verlengingsaanvraag-bijlage 5. Verlengingsaanvraag-goedkeuring 22
33 IWT-TETRA : Zongekoppelde Warmtepompsystemen ZON-WARM Eindverslag Werkpakket 1: Technologische noden van de bedrijfswereld Vakgroep Thermotechniek, Technologiecampus De Nayer Faculteit Industriële Ingenieurswetenschappen, KU Leuven Jan De Nayerlaan 5, 2860 Sint-Katelijne-Waver, België Tel.: + 32 (0) Maarten.Sourbron@kuleuven.be Auteurs: Redactie: Leen Goovaerts Dries Van Aken Jan Verheyen John Veeken Maarten Sourbron
34 IWT-TETRA : Zongekoppelde Warmtepompsystemen Eindverslag Werkpakket 1: Technologische noden van de bedrijfswereld Auteurs: Leen Goovaerts, Dries Van Aken, Jan Verheyen, John Veeken, Maarten Sourbron Copyright KU Leuven Zonder voorafgaande schriftelijke toestemming van zowel de auteur(s) als de redacteur(s) is overnemen, kopiëren, gebruiken of realiseren van deze uitgave of gedeelten ervan verboden. Voor aanvragen tot of informatie i.v.m. het overnemen en/of gebruik en/of realisatie van gedeelten uit deze publicatie, wend u tot KU Leuven Campus De Nayer, Jan De Nayerlaan 5, B-2860 Sint-Katelijne-Waver, of via iiw.thomasmore.denayer@kuleuven.be. Voorafgaande schriftelijke toestemming van de redacteur(s) is eveneens vereist voor het aanwenden van de in dit rapport beschreven (originele) methoden, producten, schakelingen en programma s voor industrieel of commercieel nut. 1
35 IWT-TETRA : Zongekoppelde Warmtepompsystemen Eindverslag Werkpakket 1: Technologische noden van de bedrijfswereld Auteurs: Leen Goovaerts, Dries Van Aken, Jan Verheyen, John Veeken, Maarten Sourbron Inhoudstafel 1 Taakbeschrijving (uit projectaanvraag) Taak 1 (WP1T1): Registratie van de technologische noden van de bedrijven Rapport technologische noden van de bedrijven Algemene opmerkingen Aandachtspunten project Warmtepomp Zonnecollector Opslag
36 IWT-TETRA : Zongekoppelde Warmtepompsystemen Eindverslag Werkpakket 1: Technologische noden van de bedrijfswereld Auteurs: Leen Goovaerts, Dries Van Aken, Jan Verheyen, John Veeken, Maarten Sourbron 1 Taakbeschrijving (uit projectaanvraag) Tijdens de verkennende gesprekken met de industriële partners is gebleken dat de kennis omtrent de koppeling tussen zonneboilers enerzijds en warmtepompen anderzijds nog vrij onbekend gebied is. Het is de bedoeling om hen hier een stuk vertrouwd mee te maken. Gedurende de volledige projectduur zal er daarom interactie zijn met de betrokken bedrijven om hun vragen te registreren en het onderzoek optimaal op hun noden af te stemmen (via de gebruikersgroepvergaderingen bijvoorbeeld). Interactie met de betrokken bedrijven is noodzakelijk om het onderzoek bij te sturen en zo optimaal mogelijk te laten aansluiten bij de noden. Er wordt over gewaakt dat de resultaten relevant (bruikbaar) zijn voor de betrokken bedrijven. 1.1 Taak 1 (WP1T1): Registratie van de technologische noden van de bedrijven Type : onderzoeksactiviteit In de startfase van het project nemen de projectmedewerkers contact op met de betrokken bedrijven. Er wordt een registratie gemaakt van het productengamma, de onderzoeksactiviteiten en de technologische noden. Deze worden samengevat in een (eventueel confidentieel) rapport. Op deze wijze zijn alle medewerkers op de hoogte van de specifieke knowhow behoefte en kan in het project hiermee rekening worden gehouden. Aandachtspunten tijdens deze gesprekken zijn - toegepaste installatieconcepten - toekomstige verwachte evoluties - mogelijk beschikbaar materiaal voor labo-metingen - mogelijk beschikbaar materiaal voor case studies - mogelijke meetlocaties voor in-situ-metingen - gebruikte ontwerp- en berekeningsprocedure Resultaat: rapport technologische noden van de bedrijven 3
37 IWT-TETRA : Zongekoppelde Warmtepompsystemen Eindverslag Werkpakket 1: Technologische noden van de bedrijfswereld Auteurs: Leen Goovaerts, Dries Van Aken, Jan Verheyen, John Veeken, Maarten Sourbron 2 Rapport technologische noden van de bedrijven De bevraging van de bedrijven uit de gebruikerscommissie heeft de volgende bevindingen en conclusies opgeleverd. Deze resultaten werden gepresenteerd op de tweede vergadering van de gebruikerscommissie ( ). 2.1 Algemene opmerkingen Belangrijk aspect: kosten/baten-analyse; Ook renovatie (groot aandeel in de markt) meenemen? o Kanttekening: Renovatie doorgedreven isolatie vereist; Profiel toekomstige renovatie = profiel nieuwbouw; Manier van isoleren verschilt, energievraag/profiel niet; o Energieopwekking met zelfde systeem! o Installatie Passief huis = installatie Renovatie in de toekomst 2.2 Aandachtspunten project Uitgangspunt moet zijn: Dekkingsgraad Zonnecollectoren ; Is regeneratie en koeling combineerbaar? Opdeling maken in volgende systemen: o Regeneratie op lange termijn onbeglaasd); o Regeneratie op korte termijn (vlakke plaat +vacuüm); Systeem en regeling zo eenvoudig mogelijk houden; 2.3 Warmtepomp Algemeen: o Elektrische bijstook meenemen? Ja, zie ook EPB discussie rond opname bijstook. o Aanvoertemperatuur verdamper maximum 20 C o Ad/absorptiewarmtepompen worden niet meegenomen o Idem water/water (Kost) o Idem ventilatielucht (Missmatch debiet) Lucht/water: o Is de grootste markt; o Economisch interessantste? Kosten/baten? o Bivalente systemen meenemen? o Met zonne-energie kan getracht worden de ontdooicyclussen te vermijden Bodem/water: o Is volgens sommige leden een niche markt en zal dat blijven; o Kan/moet koeling overal? o Effect van koeling én regeneratie op de boringen? o Volgende concepten meenemen? Bron in de bodemplaat (spaart graafwerken uit)? Systemen type rotex? (HBWW met collector op verschillende dieptes) o Fijnere regeling zou mogelijk zijn; 4
38 IWT-TETRA : Zongekoppelde Warmtepompsystemen Eindverslag Werkpakket 1: Technologische noden van de bedrijfswereld Auteurs: Leen Goovaerts, Dries Van Aken, Jan Verheyen, John Veeken, Maarten Sourbron o o Probleem is regeneratie van de bodem, voornamelijk de koppeling; Bij verticaal systeem: Temperatuur blijf over gehele boring gelijk; Problemen met olie die achterblijft; extra U-lus kan geplaatst worden voor regeneratie/koeling; Zonverdamper (vb: Solaris PAC): o Meenemen in Project? o Toepasbaarheid in België? o Groot oppervlak nodig? o Ook bruikbaar met heat pipe of vlakke plaat? o Volume? o Kostprijs koelmiddel,? o Maximale druk collector verdampingsdruk? o Temperatuur collector max aanzuigdruk compressor? o Indien gewerkt wordt met glycol : missmatch van debieten (t.o.v. warmtepomp)? Directe expansie: o Groot nadeel: elk jaar lekdichtheidstest; Andere milieueisen? o Mogelijk in combinatie met zonnecollector? In buitenland al voorbeelden beschikbaar Met extra verdamper in buitenlucht Of enkel voor SWW/RV o Cruciaal is de dimensionering o Uit WP-Direct blijkt de SPF laag te zijn, reden? 2.4 Zonnecollector Algemeen: o Opletten voor uitkoken bij grote oppervlakte; o Vergelijken kosten/baten van Vlakke plaat; Vacuümbuis; Onbeglaasd; o Vraagteken is de dimensionering; o Momenteel: oppervlakte op basis van sanitair: In zomer overschotten; In winter te korten; o Lucht als warmtedragend medium goede keuze? L/W-warmtepomp? o Misschien is de combinatie van 2 types een goede keuze? Onbeglaasde: o Benodigd/beschikbaar oppervlakte zal probleem zijn; Groot voordeel van prijs; 5
39 IWT-TETRA : Zongekoppelde Warmtepompsystemen Eindverslag Werkpakket 1: Technologische noden van de bedrijfswereld Auteurs: Leen Goovaerts, Dries Van Aken, Jan Verheyen, John Veeken, Maarten Sourbron Relatief kleine ΔT; Collectordebiet = verdamperdebiet? Vlakke plaat: o Prijs tussen zwembadcollector en vacuüm; o Kritischer naar oriëntatie, helling; o Abstractie maken van leegloop/druksystemen? o Panelen met Water ipv glycol? Vacuümbuis: o Duurste oplossing o Oriëntatie/helling niet kritisch o Gevoeliger voor glasbreuk 2.5 Opslag Water: o Gelaagd of niet? (Ref: Akpan et al, Optimization of Domestic-Size Renewable Energy System Designs Suitable for could Climate Regions presenteren besparingen van 8 tot 38% t.o.v. niet gelaagde opslag) Type Combibuffer? o SWW met serpentijn:» Minder verliezen;» Mogelijk betere gelaagdheid;» Groot warmtewisselend oppervlak nodig; o Vat in vat:» Verliezen SWW zijn nuttig; o Verswaterstation:» Extra pomp nodig; Sanitair en verwarming samen of apart? Bodem: o Bodemgesteldheid: Grondsoort; Grondwatersnelheid; o Doel? Alle overschot hierin capteren? o Maximum bodemtemperatuur? o Wat met koeling? PCM: o o o o Vooral bruikbaar in combinatie met smartgrids; Kost? Eventueel in combinatie met waterbuffer; Is studie op zich; Installatieschema s (zie Werkpakket0 en Werkpakket3) Alle concepten hebben raakpunten; Kosten/baten-analyse is zeer belangrijk; 6
40 IWT-TETRA : Zongekoppelde Warmtepompsystemen Eindverslag Werkpakket 1: Technologische noden van de bedrijfswereld Auteurs: Leen Goovaerts, Dries Van Aken, Jan Verheyen, John Veeken, Maarten Sourbron Bepaling oppervlakte zonnecollector is cruciaal (kosten/baten); De zon moet altijd verwarmingsondersteunend werken; Regeling? o Is enkel ΔT regeling voldoende? o Potentieel van de collector meten en hierop regelen? o Debietregeling? o Best zo eenvoudig mogelijk houden; 7
41 IWT-TETRA : Zongekoppelde Warmtepompsystemen ZON-WARM Eindverslag Werkpakket 2: Literatuurstudie WP2T1: Theoretische en toepassingsgerichte achtergrondinformatie WP2T2: Literatuur en informatiebank Vakgroep Thermotechniek, Technologiecampus De Nayer Faculteit Industriële Ingenieurswetenschappen, KU Leuven Jan De Nayerlaan 5, 2860 Sint-Katelijne-Waver, België Tel.: + 32 (0) Maarten.Sourbron@kuleuven.be Auteurs: Redactie: Leen Goovaerts Dries Van Aken Jan Verheyen John Veeken Maarten Sourbron
42 IWT-TETRA : Zongekoppelde Warmtepompsystemen Eindverslag Werkpakket 2: Literatuurstudie Auteurs: Leen Goovaerts, Dries Van Aken, Jan Verheyen, John Veeken, Maarten Sourbron Copyright KU Leuven Zonder voorafgaande schriftelijke toestemming van zowel de auteur(s) als de redacteur(s) is overnemen, kopiëren, gebruiken of realiseren van deze uitgave of gedeelten ervan verboden. Voor aanvragen tot of informatie i.v.m. het overnemen en/of gebruik en/of realisatie van gedeelten uit deze publicatie, wend u tot KU Leuven Campus De Nayer, Jan De Nayerlaan 5, B-2860 Sint-Katelijne-Waver, of via iiw.thomasmore.denayer@kuleuven.be. Voorafgaande schriftelijke toestemming van de redacteur(s) is eveneens vereist voor het aanwenden van de in dit rapport beschreven (originele) methoden, producten, schakelingen en programma s voor industrieel of commercieel nut. 1
43 IWT-TETRA : Zongekoppelde Warmtepompsystemen Eindverslag Werkpakket 2: Literatuurstudie Auteurs: Leen Goovaerts, Dries Van Aken, Jan Verheyen, John Veeken, Maarten Sourbron Inhoudstafel 1 Taakbeschrijving (uit projectaanvraag) Taak 1 (WP2T1): Theoretische en toepassingsgerichte achtergrondinformatie Taak 2 (WP2T2): Literatuur- en informatiedatabank Literatuuroverzicht Eindrapport IEA SHC Taks 44/HPP Annex Metingen Simulaties Economische analyse Review van zonwarmtepompsystemen en meetresultaten Literatuurdatabank Eindrapport IEA SHC Task44/HPP Annex Bijlage 1: Uittreksel uit IEA SCH Task44/HPP Annex38, hoofdstuk Bijlage 2: Review solar heat pump systems
44 IWT-TETRA : Zongekoppelde Warmtepompsystemen Eindverslag Werkpakket 2: Literatuurstudie Auteurs: Leen Goovaerts, Dries Van Aken, Jan Verheyen, John Veeken, Maarten Sourbron 1 Taakbeschrijving (uit projectaanvraag) De koppeling van warmtepompen met zonthermische systemen is geen nieuw begrip in de internationale bouwwereld. Er is dan ook een grote beschikbaarheid van theoretische en praktische informatie over deze koppeling. De bedoeling van dit werkpakket is de bestaande en beschikbare literatuur te vervolledigen met documentatie betreffende de prestatie-evaluatie van deze koppeling zowel via berekeningen als metingen en resultaten van externe meetcampagnes. Als aanzet van dit werkpakket is dan ook de deelname van Lessius Mechelen Campus De Nayer in IEA-SHC Task 44 bevestigd. De literatuur-, norm- en case studies vormen het noodzakelijke uitgangspunt om de volgende projectfase aan te kunnen vatten. Ze zorgen voor de nodige algemene theoretische en toepassingsgerichte achtergrond. Het doel van dit werkpakket is tweeërlei. Enerzijds biedt het voor het verdere projectverloop de noodzakelijke theoretische en praktische achtergrond informatie. Anderzijds moet het opzoekingswerk leiden tot een databank van relevante en beschikbare literatuur die op een projectwebsite ter beschikking zal staan van de leden van de gebruikersgroep en in een later stadium van een ruimer publiek. 1.1 Taak 1 (WP2T1): Theoretische en toepassingsgerichte achtergrondinformatie Type : onderzoeksactiviteit In eerste instantie moet een goed beeld verkregen worden van de huidige stand van de techniek. Een overzicht wordt opgesteld met de focus op: - bestaande technieken voor woningen (warmtepompen, zonthermische en opslagsystemen ) - bestaande systeemconfiguraties voor woningen - berekeningsmethodieken voor de bepaling van het systeemrendement - meetmethodieken voor de bepaling van het systeemrendement - systemen die zowel ruimteverwarming als sanitair warm water verzorgen - externe meetcampagnes - regelstrategieën Eveneens moeten voor al de beschikbare technieken/concepten voor- en nadelen op gebied van comfort, ecologie, economie en duurzaamheid in het overzicht opgenomen worden. Resultaat: basisoverzicht van bestaande technieken, configuraties,. 1.2 Taak 2 (WP2T2): Literatuur- en informatiedatabank Type : onderzoeksactiviteit Op de projectwebsite wordt een databank opgebouwd met relevante naslagwerken, artikels, internetadressen,. De in WP2T1 vermelde punten zijn hiervoor de leidraad. Geïnteresseerde bedrijven kunnen op basis van deze databank gewenste achtergrondinformatie opzoeken. Resultaat: databank koppeling warmtepomp/zonthermische systemen 3

45 IWT-TETRA : Zongekoppelde Warmtepompsystemen Eindverslag Werkpakket 2: Literatuurstudie Auteurs: Leen Goovaerts, Dries Van Aken, Jan Verheyen, John Veeken, Maarten Sourbron 2 Literatuuroverzicht 2.1 Eindrapport IEA SHC Taks 44/HPP Annex Metingen In hoofdstuk 6 van dit eindrapport worden de meetresultaten die binnen het project verzameld zijn gepresenteerd en geanalyseerd. In bijlage 1 is een uittreksel uit dit rapport overgenomen, met ene globaal overzicht van de meetresultaten en enkele succes-installaties die in detail worden gepresenteerd. Globaal toont de onderstaande figuur het overzicht van alle meetdata (details in eindrapport task 44) Figuur 1: Measured or correlated SPF SHP* of the monitored systems (green markers, left ordinate) and heat consumption for domestic hot water and space heating (right ordinate). The type of system is given on the abscissa: P = parallel, S = series, R = regenerative (OVERGENOMEN UIT EINDRAPPORT Task44) Simulaties Hoofdstuk 7 van dit eindrapport bespreekt de simulatieresultaten. De volgende eindconclusies worden hier genomen: Parallelle systemen (zonnecollector en warmtepomp naast elkaar) zijn het meest gebruikt en het eenvoudigst in ontwerp Parallelle systemen veroorzaken een reductie in energiegebruik van kwh_el/m² collector oppervlakte in vergelijking met een warmtepomp zonder zonnecollectoren Parallelle systemen veroorzaken een COP stijging van /m² collector oppervlakte (voor kleine tot gemiddelde oppervlaktes) in vergelijking met een warmtepomp zonder zonnecollectoren De hydraulische schakeling van het buffervat (aansluitposities, debieten, regeling van op- en ontladen) zijn cruciaal voor een goede systeemprestatie (diezelfde conclusie werd in dit project bekomen, zie Werkpakket 4) 4
46 IWT-TETRA : Zongekoppelde Warmtepompsystemen Eindverslag Werkpakket 2: Literatuurstudie Auteurs: Leen Goovaerts, Dries Van Aken, Jan Verheyen, John Veeken, Maarten Sourbron Als PV-elektriciteit lokaal wordt verbruikt en opgeslagen, zijn PV-panelen een concurrent van thermische zonnecollectoren in combinatie met een warmtepomp Zonnecollectoren behalve in parallel ook in serie met de warmtepomp plaatsten (als warmtebron) blijkt maar een klein effect op de systeemprestatie te hebben Regeneratie van de bodem van een enkele bodemlus heeft geen aantoonbare meerwaarde in de onderzochte simulatiestudies Zonnecollectoren als enige bron voor de warmtepomp heeft voordelen van eenvoud, kost, geluid (geen ventilatoren) Systemen met niet-afgedekte collectoren en ijsopslag hebben een gelijkaardige systeemprestatie als grondgekoppelde warmtepompen zonder zonnecollectoren Economische analyse In de economische analyse van hoofdstuk 8 van het eindrapport wordt vereenvoudigd uitgegaan van een eind-energiebesparing van 40%, gebaseerd op een SPF_ref= 2.7 en een SPF_SHP=4.5, en de volgende formule: FE % = FE ref FE SHP FE ref = ( 1 SPF ref 1 ) SPF SHP 1 SPF ref Op basis van de verschillende gegevens wordt nomogram uit opgesteld, om op basis van de energievraag per verwarmde vloeroppervlakte, een Total Cost of Ownership te presenteren. Calculation example: Let s consider for instance a single family house with a total heating demand of 100 kwh/m 2. Two SHP systems have been considered for installation and in particular: 1. option 1: the system SPF SHP is 2.5, the investment cost amounts to 150 /m 2 and the average lifespan is 10 years; 2. option 2: the system SPF SHP is 5.0, the investment cost amounts to 250 /m 2 and the average lifespan is 15 years. Which is the total cost of ownership TCO that the dwellings will face in 20 years? The solution to this problem can be easily derived from the nomograph of Figuur 2Fout! Verwijzingsbron niet gevonden.. Once the total heating demand of the building (100 kwh/m 2 ) is given as input to Graph 1 (see Starting point) and the respective SHP system performances are selected (2.5 and 5.0), the yearly final energy consumption FE for the variants can be calculated (40 and 20 kwh/m 2, respectively). Assuming an average electricity price of 0.20 /kwh in Graph 2, the yearly electricity energy costs associated amount to 8 and 4 /m 2. In Graph 3, the system investment costs (coloured areas) and lifespans (parallel lines) have to be selected. As output from here the total cost of ownership TCO can be calculated, which accounts for the maintenance cost, replacements cost and energy inflated costs. In this case the TCOs amount to 31.6 and 42.3 /m 2, respectively. To conclude, the TCO will be divided by the total heating demand so that the heating energy cost the user will face in 20 years can be calculated. The energy cost associated to the first variant is 0.32 /kwh whereas the second has reached a higher cost of 0.42 /kwh. From this simple calculation, it can be concluded that option 1 is more attractive from an economic point of view than option 2. 5

![15 10 5 0 0 0 50 70 90 110 130 150 3 24 24 Total cost of ownership, TCO [ /m 2 ] 48 48 72 72 96 96 120 120 4 Figuur 2: Nomograph for economic analysis on SHP systems for residential applications.](/docs-images/92/108577123/images/47-3.jpg "Energetic quantities are specified in terms of the living heated area (OVERGENOMEN UIT EINDVERSLAG Task44) Dit kan gebruikt worden om de economische prestatie van zonwarmtepompen te evalueren.")
47 IWT-TETRA : Zongekoppelde Warmtepompsystemen Eindverslag Werkpakket 2: Literatuurstudie Auteurs: Leen Goovaerts, Dries Van Aken, Jan Verheyen, John Veeken, Maarten Sourbron Final energy consumption, FE [kwh/m 2 ] Starting point Yearly final energy cost, C Total energy demand, Q tot [kwh/m 2 fe [ /m 2 ] ] Total cost of ownership, TCO [ /m 2 ] Figuur 2: Nomograph for economic analysis on SHP systems for residential applications. Energetic quantities are specified in terms of the living heated area (OVERGENOMEN UIT EINDVERSLAG Task44) Dit kan gebruikt worden om de economische prestatie van zonwarmtepompen te evalueren. Enkele voorbeelden worden in de onderstaande figuren getoond. Verdere informatie is in het eindrapport van Task44 te vinden. 6
48 IWT-TETRA : Zongekoppelde Warmtepompsystemen Eindverslag Werkpakket 2: Literatuurstudie Auteurs: Leen Goovaerts, Dries Van Aken, Jan Verheyen, John Veeken, Maarten Sourbron Figuur 3: Minimum SPF SHP value of a SHP system for becoming as cost-effective as a gas-boiler reference system (VAR1). (Calculation parameters: electricity tariff: 0.20 /kwh; gas tariff: 0.10 /kwh; SHP system lifespan: 15 years; gasboiler lifespan: 10 years; energy increase rate: 5%/year; maintenance cost: 2% of investment cost; inflation costs: 2.5%/year). (OVERGENOMEN UIT EINDRAPPORT Task44) Figuur 4: Minimum gas tariff u gas value for achieving a SHP system (investment cost 150 /m 2 ) as cost-effective as a gasboiler reference system (VAR1). (Calculation parameters: electricity tariff: 0.20 /kwh; SHP system lifespan: 15 years; gas-boiler lifespan: 10 years; energy increase rate: 5%/year; maintenance cost: 2% of investment cost; inflation costs: 2.5%/year). (OVERGENOMEN UIT EINDRAPPORT Task44) 2.2 Review van zonwarmtepompsystemen en meetresultaten Zie bijlage 2: Sparber W., Vajen K., Herkel S., Ruschenburg J., Thür A., Fedrizzi R., D Antoni M., Overview of solar thermal and heat pump systems and review of monitoring results, ISES Solar world Congress 2011, August 28 September 2, 2011, Kassel, Germany. 7
49 IWT-TETRA : Zongekoppelde Warmtepompsystemen Eindverslag Werkpakket 2: Literatuurstudie Auteurs: Leen Goovaerts, Dries Van Aken, Jan Verheyen, John Veeken, Maarten Sourbron 3 Literatuurdatabank 3.1 Eindrapport IEA SHC Task44/HPP Annex 38 Het eindrapport is op eenvoudig verzoek verkrijgbaar bij de Vakgroep Thermotechniek van Campus De Nayer: maarten.sourbron@kuleuven.be Binnen dit project is een uitgebreide literatuurlijst aangelegd, die eveneens op eenvoudig verzoek verkrijgbaar is. 8
50 IWT-TETRA : Zongekoppelde Warmtepompsystemen Eindverslag Werkpakket 2: Literatuurstudie Auteurs: Leen Goovaerts, Dries Van Aken, Jan Verheyen, John Veeken, Maarten Sourbron 4 Bijlage 1: Uittreksel uit IEA SCH Task44/HPP Annex38, hoofdstuk 6 9
51 IWT-TETRA : Zongekoppelde Warmtepompsystemen Eindverslag Werkpakket 2: Literatuurstudie Auteurs: Leen Goovaerts, Dries Van Aken, Jan Verheyen, John Veeken, Maarten Sourbron 5 Bijlage 2: Review solar heat pump systems Copie van Sparber W., Vajen K., Herkel S., Ruschenburg J., Thür A., Fedrizzi R., D Antoni M., Overview of solar thermal and heat pump systems and review of monitoring results, ISES Solar world Congress 2011, August 28 September 2, 2011, Kassel, Germany. 10
52 IEA SHC Task 44 / HPP Annex placed, or in different depths within a borehole heat exchanger in order to observe for instance regeneration processes of the earth. Temperature sensors were in most cases Pt 100 or Pt 1000 sensors with different classes of accuracy. For the use in heat meters they were often calibrated not in absolute way but pairwise to increase the accuracy of the measurement. 4-wire and 2-wire temperature sensors have been applied. 6.3 Solar heat pump performance results from field tests The purpose of in-situ measurements of SHP Systems under real conditions is to better understand the interoperation of different components of these systems and to evaluate the performance of the theses systems. Within the framework of T44A38 members of 18 research institutions monitored 45 systems in the last years; those selected for further evaluation are listed in table 6.1. The Solar Heat pump systems analysed varied in different means as system layout, size, location, and underlying research questions leading to different measurement concepts and monitoring equipment used. Like all activities of T44A38, the monitored SHP systems and the subsequent analyses are limited to systems that are equipped with electrical-driven compression heat pumps and designed for DHW preparation and/or residential space heating. The system analysis is presented anonymously, giving each of the systems a number code. Out of 32 analysed systems, 17 could be characterised according to the systematic introduced in chapter 2 as parallel systems (P), 9 as parallel/series systems (P/S) and 5 as regeneration of the ground by uncovered or PVT collectors (R or P/S/R). 13 systems use ambient air as main source for the heat pump, 14 the ground or water and 5 systems exclusively the solar absorber. Table 6.1 Characteristics of the monitored systems. The following abbreviations are used: FPC = Flat-Plate Collector, UC = Uncovered Collector, ETC = Evacuated Tube Collector, PVT = Photovoltaic-Thermal Collector Project name or description Organisation Concept Collector Type HP source Solpumpeff project A AT AEE Intec / TU Graz P/S FPC air/solar Solpumpeff project B AT AEE Intec / TU Graz P FPC air Solpumpeff project C AT AEE Intec / TU Graz P FPC ground Solpumpeff project D AT AEE Intec / TU Graz P FPC air Solpumpeff project E AT AEE Intec / TU Graz P/S FPC air/solar Solpumpeff project F AT AEE Intec / TU Graz P FPC water Savièse Aufdereggen ice storage CH Energie Solaire SA P/S UC solar Savièse Granois ice storage CH Energie Solaire SA P/S UC solar Fribourg CH EIA Fribourg P/S FPC ground Jona CH Institut für Solartechnik SPF P FPC air COP5 CH Université de Genève P/S UC solar WP Effizienz A DE Fraunhofer ISE P ETC air Chapter 6 Monitoring Page 6 of 25
53 IEA SHC Task 44 / HPP Annex WP Effizienz B DE Fraunhofer ISE P FPC air WP Effizienz C DE Fraunhofer ISE P FPC ground WP Effizienz D DE Fraunhofer ISE P (DHW) FPC air WP Effizienz E DE Fraunhofer ISE P (DHW) FPC ground WP Effizienz F DE Fraunhofer ISE P (DHW) FPC air WP Monitor A DE Fraunhofer ISE P (DHW) FPC ground WP Monitor B DE Fraunhofer ISE P FPC ground WP Monitor C DE Fraunhofer ISE P (DHW) ETC ground Haus der Zukunft DE Fraunhofer ISE P/S FPC air/solar Dreieich DE ISFH R PVT ground Limburg DE ISFH R UC ground Solar and heat pump for houses A DE ITW P FPC air Solar and heat pump for houses B DE ITW P FPC air Solar ice store DE ITW P/S FPC/UC solar Borehole HX DE ITW P/S FPC Solar and heat pump for houses C DE ITW P FPC air energy basket & unglazed absorber DE ITW P/S/R UC ground/ solar ground/ solar Balleruphuset DK Cenergia / SBI P/S/R FPC ground/air Flamingohuset DK Cenergia / SBI P/R FPC ground Heliopac FR EDF S UC solar The nominal COP of the installed heat pumps under standard test conditions varies from 2.9 to 4.2 for air/water systems and from 3.8 to 4.7 for brine/water systems and reflects the bandwidth of actual marketed products. The different testing standards EN 255 and EN should be recognised as the latter, newer procedure leads to lower performances. The variation of the COP of air source systems is higher than in between the ground source systems figure 6.3. Chapter 6 Monitoring Page 7 of 25
54 IEA SHC Task 44 / HPP Annex Figure 6.3 Nominal COP of the installed heat pumps. On the abscissa the type of SHP system is given. The shape of the marker refers to the standard used for testing; the colour refers to the kind of heat pump. A key indicator of the performance of a system is the Seasonal Performance Factor SPF (for definitions see {chapter 4}). Due to different underlying research questions, the measurement equipment and the location of the meters vary in the analysed systems as described in {chapter 6.1}. Consequently, the chosen boundary for determining the SPF varies in the projects. In order to compare the system s SPF, the measured indicators were normalised to the boundary including storage losses and loading pumps, i.e. SPF SHP. As the performance difference between the two boundaries SPF bst and SPF SHP strongly depends on the ratio of heating demand to storage losses and therefore on the size of the storage. Based on the results of 13 field test where both figures were available a correlation was used to derive the SPF SHP based on SPF bst and marked with an asterisk for distinction: SPF SHP * = 0.75 SPF bst 0.22 Similarly, for SPF SHP+, a simplified correlation out of 15 installations is found as: SPF SHP * = SPF SHP (to be added as constant value) Figure 6.4 gives the range of measured SPF SHP * for the different field tests. In addition the heat consumption for domestic hot water and room heating related to the floor are given. The SPF SHP * varies from 1.3 to 4.8 with a mean value of When the storage losses are not taken into account the mean SPF bst is Thus the storage losses in SHP systems have a strong impact on the performance. The space heat consumption varied from 15 kwh/(m²a) to 110 kwh/(m²a) with a median value of 67 kwh/m²/a and domestic hot water consumption between 4 kwh/m²/a and 48 kwh/m²/a with a median value of 11 kwh/m²/a. The share of domestic hot water varies between 6% and 100%. So in average standard low energy houses with a relative low share of DHW were analysed. Compared to common heat pump field test the average SPF bst is comparable to average ground-source heat pump systems. Reflecting the fact that some of the tested systems were prototypes the results can be interpreted as success even so the strong influence of the storage losses on the performance shows potential for improvement. Chapter 6 Monitoring Page 8 of 25
55 IEA SHC Task 44 / HPP Annex Figure 6.4 Measured or correlated SPF SHP* of the monitored systems (green markers, left ordinate) and heat consumption for domestic hot water and space heating (right ordinate). The type of system is given on the abscissa: P = parallel, S = series, R = regenerative (cf. section 2.1.3) In order to deeper analyse the monitored systems these were grouped by their main source and the influence of key indicators on the performance were identified. It can be expected, that an increasing size of the absorber in relation to the installed heat pump capacity lead to a higher SPF, as the solar fraction will increase and a higher solar fraction implies a higher SPF. A second key parameter is the COP of the heat pump under standard conditions. A third set of parameters are mean temperatures at the evaporator and condenser of the heat pump. As for the latter one data were not available, the ratio between domestic hot water demand and the heating demand could be used instead, giving an indication for the temperatures on the condenser side (the lower the share, the lower the temperatures and the higher the performance). In figure 6.5 the measured SPF SHP * is shown as function of nominal COP and the ratio of installed absorber vs. heat pump capacity. Selected systems show the potential of air and solar only based SHP systems, they can achieve SPF SHP * significantly higher than 4. The results for solar ground-source heat pumps are as widespread as for the air-source heat pumps These systems achieved higher SPF SHP * in general; best systems achieved a SPF SHP * of 4.8 Nevertheless the rather weak performance of many systems underlines the necessity of a well-established quality assurance process for installation, especially when hydraulics and control become more complex even though many of the monitored systems had an experimental character. As expected, the system performance gets lower as the share of high-temperature DHW increases (figure 6.6). The dependency was found to be strongest for air-source heat pumps. Especially the three series systems with a high share of DHW and uncovered collectors as only source show this tendency as well. The installed collector area in relation to the installed heat pump capacity ranges from 0.5 to 1.5 m²/kw for flat-plate collectors. Larger areas were installed when uncovered collectors were used. Figure 6.7 shows the dependency of the systems in relation to the ratio of installed aperture area per heat consumption. Larger solar installations lead to higher performances as expected. Apart from appropriate sizing of the collector subsystem, there must be other influences on the SPF SHP * performance values for air-source heat pumps, for example system control and installation quality. This becomes evident as some systems with a moderate collector area outperform even ground source installations. Chapter 6 Monitoring Page 9 of 25
56 IEA SHC Task 44 / HPP Annex Figure 6.5 Measured or correlated SPF SHP * depending on the nominal COP (A2/W35 or B0/W35) and the ratio of installed absorber area and nominal heat pump capacity. Figure 6.6 Measured or correlated SPF SHP * depending on the share of domestic hot water measured for solar heat pumps with solar as only source. Chapter 6 Monitoring Page 10 of 25
57 IEA SHC Task 44 / HPP Annex Figure 6.7 Measured or correlated SPF SHP * depending on the ratio of installed collector area and heat demand for solar heat pumps with uncovered absorbers Looking at well performing systems of different configurations shows their potential. Parallel, series and regenerative approaches are found among these convincing examples, and no significant difference could be seen on the main source for the heat pump system (figure 6.8). Chapter 6 Monitoring Page 11 of 25
58 IEA SHC Task 44 / HPP Annex Figure 6.8 Measured or correlated SPF SHP * of selected well performing monitored systems with different concepts, grouped by the main sources air, ground and solar only 6.4 Best practice examples Besides gathering performance indicators, each of the monitored systems is a good source for knowledge creation. In the following five systems were selected representing the variety of successful system solutions seen in the field: Blumberg, DE: Parallel system with ground source heat pump and flat plate solar collector (published in [3]) Jona, CH: Parallel system with air source heat pump and flat plate solar collector (published in [4]) Dreieich, DE: System with ground source heat pump and recovery of the ground by PVT collectors (published in [5]) Savièse, CH: Parallel/series system with ice-storage and unglazed collectors as source (published in [6]) Satigny, CH: Parallel/series system for multifamily building with uncovered collector as source (published in [7]) The variety of the systems with good performances indicates that adapted, well installed solutions for Solar Heat Pumps are available Blumberg The system in the Blumberg single family house is a typical example for a larger parallel system. A ground-source heat pump plus solar thermal system have been installed in The system provides domestic hot water for 4 people and space heating energy distributed by a floor heating system. A 9.9 kw th ground-source heat pump and 14.4 m² flat-plate collectors deliver heat to a 1000 L combi-storage covering space heating and domestic hot water. The heat pump unit contains also an electric heating element. The system has been monitored from July 2009 till June Electric and thermal energy flows were monitored for evaluating SPF bst. Chapter 6 Monitoring Page 12 of 25

59 IEA SHC Task 44 / HPP Annex Location Blumberg, DE Altitude 700 m Building Heat pump Solar collector Thermal storage Low energy, floor heating Ground source, scroll compressor, R410A 276 m², 56 kwh/m²a 9.9 kw th COP = EN 255 Flat-plate collector 14.4 m², 20 East, inclination 40 Combi-storage 1000 L For the period of 12 months, the solar collectors yielded 5005 kwh or 348 kwh/m²a. The heat pump delivered kwh to the storage, the heating element 0.6 kwh. The total electricity demand of the system was 3437 kwh/a. The seasonal performance factor amounted to SPF bst = 5.8, shown in greater detail by figure 6.9. The performance factor for the heat pump alone was SPF HP = 4.7. In the main summer month the heat was delivered by solar collectors only. Their rather high performance shows the potential of the easy-to-control parallel system with a large collector subsystem. Figure SPF bst on monthly and annual basis for the monitoring period of July 2009 till June 2010 The electrical energy consumption of the system (3437 kwh/a, seen with SPF bst boundaries) can be divided into the consumption of compressor (3126 kwh/a), auxiliary electric heating (0.6 kwh/a), brine pump (199 kwh/a), control (54 kwh/a) and solar circuit pump (58 kwh/a). The relative distribution also on monthly basis is shown in figure The electrical heating element remained unused due to the reliable ground source. Chapter 6 Monitoring Page 13 of 25
 absolute values are given as well.")
60 IEA SHC Task 44 / HPP Annex Figure 6.10 Relative distribution of electricity consumption for SPF bst boundaries on monthly basis. For annual results (rightmost column) absolute values are given as well. Under the given circumstances like the relative cold but sunny climate, a low temperature distribution and a well dimensioned solar system a good performance could be achieved even with a more simplistic integration of the solar system Jona The system in the single family house located in Rapperswil-Jona, Switzerland, is a typical example for a larger parallel system. An air-source heat pump plus solar thermal system have been installed in 2009 and monitored. The system provides domestic hot water (1400 kwh/a) for two people and space heating (18700 kwh/a) for 200 m² of heated floor area of a house built in The 20 kw th air-source heat pump and the 15 m 2 covered solar thermal collector field deliver heat to a tank-in-tank solar combi-storage of 1.8 m 3 water volume from where the needs for space heat and domestic hot water are served. From the solar combistorage domestic hot water and space heat are provided. The heat pump charges either the upper part or the middle part of the storage directly (switching with two three-way valves) and the solar thermal collector field charges the storage with internal heat exchangers placed in the top and in the bottom third, of which the top heat exchanger can be circumvent. Chapter 6 Monitoring Page 14 of 25
![energy [MWh] IEA SHC Task 44 / HPP Annex 38 - http://www.iea-shc.](/docs-images/92/108577123/images/61-2.jpg "org/task44 Location Jona, CH Altitude 408 m Building Heat pump Solar collector Thermal storage Low energy, floor heating Air source, scroll compressor, R404A 200 m², 100 kwh/m²a 19.7 kw th COP = 3.")
61 energy [MWh] IEA SHC Task 44 / HPP Annex Location Jona, CH Altitude 408 m Building Heat pump Solar collector Thermal storage Low energy, floor heating Air source, scroll compressor, R404A 200 m², 100 kwh/m²a 19.7 kw th COP = EN 255 Flat-plate collector 15 m², 20 West, inclination 38 Combi-storage 1800 L All heat inputs and outputs of the store where monitored from February 2010 to December 2011 as well as the electricity consumption of the heat pump and the solar collector operation. Electricity for all controllers and pumps with the exception of the space heat distribution pump was included in the balance. Measured points included the flow and return temperatures and volume counts of the solar circuit, the heat pump circuit and the space heat circuit as well as cold water and hot water temperatures and tapped volumes. For the year 2011, the resulting seasonal performance factor of the system calculated based on all electricity use and the useful heat leaving the store was SPF SHP = 4.4. Compared to a typical air-source heat pump this is a strong improvement of the performance which is mainly resulting from the high share of solar heat in the heat balance (figure 6.11). The low temperatures in the heating circuit together with the low share of DHW lead to low temperatures at the condenser, so even in winter monthly COP for the air source heat pump of >3.4 were achieved (figures 6.12 and 6.13) store inputs from hp for dhw from hp for sh from solar to space heat to dhw store outputs Figure energy balance of the combi-storage Chapter 6 Monitoring Page 15 of 25
62 performance factors performance factors IEA SHC Task 44 / HPP Annex Figure performance factors of the heat pump SPF HP Jan Feb Mar Apr May Jun Jul Aug Sep Oct Nov Dec Year Dreieich Figure performance factors of the system including the storage SPF bst A heat pump system with uncovered PVT collectors and ground heat exchanger has been measured over a period of two years starting in March It consists of 39 m² PVT collector field, a 12 kw heat pump and a total length of 225 m coaxial borehole HE. The system provides space heat and domestic hot water for a large single family house. The measured heat demand in the system is 36 MWh/a in the first and 40 MWh/a in the second year of operation, which corresponds to a 25 % and 45 % increased heat demand compared to planning. The additional PV yield due to PV cooling is determined by comparison with non- Chapter 6 Monitoring Page 16 of 25

63 IEA SHC Task 44 / HPP Annex cooled PV reference modules. In both measured periods the additional PV yield due to cooling is 4 %. The thermal yield of the PVT collector is 450 kwh/m² per year. The PVT collector connection to the heat source side aims at two effects compared to a conventional heat pump system. One effect is the lift of the cold temperature level by the thermal yield of the unglazed collector. Simultaneously, the PV is cooled and therefore its efficiency and electrical yield are improved. The collector is connected to the heat source by a simple switching valve. This valve allows connecting the PVT collector in series to the borehole heat exchanger. Accordingly, the supplied heat from the collector is restricted to the heat source side of the heat pump. In the monitored system the heat pump provides heat for the space heating system and the domestic hot water (DHW) storage. The DHW storage is charged by the integrated condenser of the heat pump which can be operated as desuperheater. Location Dreieich, DE Altitude 150 m Building Low energy, floor heating Heat pump Solar collector Thermal storage Ground source, scroll compressor, R407C 380 m², 66+6 kwh/m²a 11.6 kw th COP = EN 255 PVT collector 39.6 m², 24 East, inclination 15, 2.8 kw p DHW 150 L The results of the measurements are given in figure It shows the seasonal distribution of the heat fed into the boreholes and the extraction of this heat by the heat pump in winter. The small share of DHW gives optimal low temperatures for the heat pump operation. Chapter 6 Monitoring Page 17 of 25
64 IEA SHC Task 44 / HPP Annex Monthly energy balance [kwh] 2 nd year of operation TOTAL Electricity Input Ground to HP - outlet Solar Collectors to Ground or HP Space heating DHW Total el. consumption: 9955 kwh/a 90% 3% 7% 0% Electricity to Pump Heat Distrib. Electricity to Pump Solar and Ground HX Electricity to Controller Solar Electricity to HP Figure 6.14 Heat demand and energy balance in the course of the year (left) and overall electricity consumption (right) in the 2 nd year of operation. The monthly heat flow rates of the ground heat exchanger are monthly positive net heat flows. The solar collector yield, that exceeds the evaporator demand, is injected to the ground heat exchanger. Figure 6.15 shows that performance and temperature level of the ground heat exchanger is comparatively unchanged, because of the active ground regeneration by the solar thermal PVT collector. The comparatively good stability of heat source temperatures highlights the robustness of the combined heat source unglazed solar collector and borehole heat exchanger. Figure 6.15 Monthly maximum, minimum and average temperatures of the ground heat exchanger inlet the minimum temperatures in winter 2010/ 2011 are caused by non-stop operation of the heat pump over a period of two weeks. The PVT collectors have been installed with and without rear side insulation. The measurement was conducted separately for both fields without significant differences for electrical and thermal yields Savièse The system installed in an old retrofitted house in Savièse-Granois in Switzerland is made for DHW production and space heating up to 8 kw. The selective coated unglazed collectors are used both as solar collector and as heat exchanger on ambient air. They charge a storage tank with phase changing material (PCM: ice/water) connected in series with the collector field on the brine/water heat pump evaporator. When running at higher temperatures they charge a combi-storage tank which is connected to the heating distribution and produces DHW. Chapter 6 Monitoring Page 18 of 25

65 IEA SHC Task 44 / HPP Annex Location Savièse, CH Altitude 1500 m Building Heat pump Solar collector Thermal storage Retrofitted low-energy building Brine/water with solar only source, R407C Type «AS» from Energie Solaire SA (uncovered) PCM (ice/water) storage Combi-storage 230 m², 43+6 kwh/m² 6.9 kw th COP = EN m², 10 East, inclination L 1000 L The results and the monthly energy balance are shown in figure With an annual SPF SHP of 4.3 (3.3 when counting the additional heat from a wood stove as electricity), the installation can be compared to standard heat pump with boreholes. The concept of the ice storage in in combination with the uncovered collectors is promising especially when ground sources are not available. In addition the noise impact of an external air unit can be avoided. Chapter 6 Monitoring Page 19 of 25
66 IEA SHC Task 44 / HPP Annex Satigny Figure heat balance on monthly and annual basis The system described in this section is implemented in a new housing complex (9552 m 2 ) in Satigny near Geneva, Switzerland. This housing complex is composed of 10 similar blocks of 8 flats each. Each block (app. 950 m²) has its own heating system, designed to produce space heating (floor heating with flow temperatures around 30 C) and domestic hot water. A detailed energy monitoring was implemented in one of the blocks, and enabled to describe the behaviour of the system, e.g. consumption, control strategy, temperature levels and to evaluate its performance over an entire year. Each heating system consists of a heat pump directly coupled to 123 m² uncovered solar collectors as its heat source. As seen in the figure below, heat can be delivered to the flats: first directly from the solar collectors, second from the 6000 L storage (if temperature from the solar collectors is too low), third from the heat pump (if temperature in the storage is too low) and fourth by back-up electric heating, placed in the storage, in case of a regular heat pump shutdown (outdoor temperature below 20 C) or failure. In summer nights, when cooling is appreciated, heat from the flats can be dissipated via the solar collectors. Another particularity of this system is the hydraulic distribution circuit. The same circuit alternatively delivers space heating and DHW to the flats. Since space heating and DHW cannot be delivered simultaneously, each flat is equipped with a 300 L DHW buffer storage. Chapter 6 Monitoring Page 20 of 25


 Water buffer DHW 35 kw th COP = 4.")


 as well as")
67 IEA SHC Task 44 / HPP Annex Location Satigny, Geneva Altitude 500 m Building (one block) Minergie label Floor heating 32 habitants 927 m² Heat pump Solar collector Thermal storage Scroll Compressor with enhanced vapour injection R407C Type «AS» from Energie Solaire SA (uncovered) Water buffer DHW 35 kw th COP = EN x 2.05 m² 37 E, 20 slope 6000 L per block 300 L per flat Operation of the system on a typical mid-season day is represented in figure Figure Mid-season day (10 th March 2013, 5 minute time step). Top: demand, solar and heat pump power (primary axis) as well as global solar irradiance (secondary axis). Bottom: outdoor, solar output, HP output and distribution temperatures. Chapter 6 Monitoring Page 21 of 25
68 IEA SHC Task 44 / HPP Annex During this specific day the average outdoor temperature is 7 C and the maximum solar irradiance 600 W/m 2. The demand is characterized by: a) four DHW cycles of about one hour for charging of the individual DHW storages (starting at 0:00, 9:30, 18:00 and 21:30 h), during which heat is distributed at about 60 C; b) two space-heating cycles (2:00 9:30 h and 11:30 16:00 h), during which heat is distributed between 25 and 30 C. The four DHW cycles are covered by the heat pump, with an absorber output/evaporator input temperature between -10 and 20 C. The excess production, in particular at the end of each cycle, is stored in the central buffer tank. As a result of such storage, space heating starts with storage discharge (2:00 6:30 h), followed by heat pump production. In the afternoon, solar irradiance is high enough for space heating to be covered directly by the collectors (heat pump off), with a solar output temperature above 30 C. The detailed monitoring enabled to fully characterise the energy flows of the studied block over the entire year of 2012 (figure 6.18), with an input-output balance error of less than 3 %. Figure 6.18: - Sankey diagram of the studied block for the year 2012, values in kwh/m²/a Thanks to the high-performance thermal envelope and to controlled internal temperatures (average of 20 C) the space heating demand (19 kwh/m²/a) is low as compared to standard values in Switzerland. On the opposite, DHW consumption (48 kwh/m²/a) is higher than usual, which is due to a high occupancy rate (as a matter of fact, the specific user consumption of 1184 kwh/inhabitant/a is only slightly above the average of 1075 kwh/inhabitant/a). All in all, this results in an unusual space heating and DHW ratio of 30 % / 70 %, which is expected to become common in high-efficient multifamily dwellings. The thermal storage plays an important role in the system, since 37 % of the energy supplied to the flats goes through the storage before use (44 % in summer). The storage heat losses amount to 14 % of the storage input energy. The renewable heat fraction is 68 % of the total energy input, and the performance factor of the heat pump SPF HP is 2.7. Note that the monthly SPF HP only varies slightly during the year (2.5 to 3), even in summer. Indeed, during this period, the heat pump works only to produce DHW at 60 C (when direct solar is not enough), i.e. at high condenser temperature. As a result, the overall SPF SHP only amounts to 2.9 (2.5 in winter and 4.4 in summer). As it relates to a low heat demand (57 kwh/m 2 /a.), the total electricity consumption however remains within an acceptable value of 24 kwh/m². 6.5 Literature references [1] Miara, M., Günther, D., Langner, R. and Helmling, S. (2014) The outcomes and lessons learned from the wide-scope monitoring campaign of heat pumps in family dwellings in Chapter 6 Monitoring Page 22 of 25
69 OVERVIEW ON SOLAR THERMAL PLUS HEAT PUMP SYSTEMS AND REVIEW OF MONITORING RESULTS Wolfram Sparber 1, Klaus Vajen², Sebastian Herkel 3, Jörn Ruschenburg 3, Alexander Thür 4, Roberto Fedrizzi 1, Matteo D Antoni 1 1 EURAC Research, Viale Druso, 1, Bolzano (Italy), Phone (+39) 0471 / , Fax (+39) 0471 / , wolfram.sparber@eurac.edu 2 Kassel University, Institute for Thermal Engineering, Kassel (Germany) 3 Fraunhofer Institute for Solar Energy Systems ISE, Freiburg (Germany) 4 AEE Institut for Sustainable Technologies, 8200 Gleisdorf (Austria) 1. Introduction In recent years several companies started offering Solar thermal And Heat Pump Systems (SAHPS) on the European Market; already in 2009 an overview was given for example by Zörner W. et al (2009). For single family houses the systems are offered as pre defined package (kit) solutions. The systems deliver thermal energy for heating, domestic hot water and eventually as well cooling to the building usually without any further back up burner. The hydraulic schemes of the single systems, especially the degree of integration of the solar thermal and electrical driven heat pump unit vary significantly. The same is true for the used low temperature heat source for the heat pump where ground heat exchangers (horizontal and vertical), ambient air, specific solar collectors, phase change material storages (e.g. ice/water) and exhaust air are implemented. The objective of combining solar thermal and heat pump units is to enhance the overall share of renewable heat applied, by allowing a high Solar Fraction (SF) and an enhanced Seasonal Performance Factor (SPF) of the heat pump system. This second figure is claimed to be up to SPF ~ 5 in some commercial presentations. The practical experiences with such systems are still limited and the published monitoring results are only in part in line with the mentioned expectations. Within the Task 44/Annex 38 of the International Energy Agency (IEA) Solar Heating and Cooling Program / Heat Pump Program, such systems are analyzed in detail, including simulations, evaluation of monitoring results and development of test procedures. The target of the present paper is to give an overview on commercially available Solar thermal And Heat Pump Systems (SAHPS) and a review on published monitoring results from realized installations. 2. Overview on commercial Solar thermal and Heat Pump Systems Since the beginning of the IEA project Task 44/Annex 38 the partners collected information s of commercially available solar thermal and heat pump systems in order to get a possible complete overview of the actual market situation. By June 2011 a list of over 95 different commercially presented systems could be collected. These systems are of very different type including different heat sources. Therefore in order to structure the number of single systems a methodology was needed. Frank E. et al (2010) proposed in their publication a visualization and a notation scheme in order to analyze and classify the different solar thermal and heat pump systems. The visualization scheme allows in a graphical simplified way to represent such systems. Within the scheme are shown the main components which are applied (e.g. solar collectors or heat pumps) which are represented by squares being placed in the centre of the scheme; the renewable energy sources included (e.g. solar energy or geothermal) which are represented by squares on the top row of the scheme; the additional energy needed (e.g. electricity) which is represented by squares in the left row of the scheme and finally the heat sinks served (e.g. heating and domestic hot water) which are represented by squares in the right row of Page 1 of 12
70 the scheme. The energy flows are represented by different kind of arrows connecting the single squares. As the scheme is based on squares it was denominated square view of a SAHPS. The square view allows the reader in a short time to get a clear overview on the system components and energy flows. It does not give detailed information s on hydraulic connections, neither are there included any information s of sizing of the single components. The structure of the square view is shown in the following Figure 1: Sun Ground Air Water Waste Heat Flat-plate Collector Storage (source) Space Heating Electricity Heat Pump DHW Energy Carrier Backup Cold Storage (sink) System name Company Driving Energy Water Brine Refrigerant Figure 1: Structure of the square view diagram, showing the main components, heat sources, heat sinks and additional energy carriers implemented in a solar thermal and heat pump system. In order to record as well information s on the main hydraulic connections, within the list of systems next to a commercial diagram of the system and the square view, as well a unified hydraulic drawing scheme has been elaborated and was collected for each system. In the following Figure 2 the unified hydraulic scheme and the square view of a solar thermal and heat pump system is shown as example. With the aim of structuring the list some primary properties have been collected allowing a classification of the systems. As explained by the notation scheme presented in Frank E. et al (2010) a subdivision based on the heat source used by the heat pump has been used as one characteristic aspect. In the following examples of systems applying a geothermal heat source, an aerothermal heat source and the solar thermal collector as only heat source will be shown. Examples could be recorded as well of systems using exhaust air of the air ventilation system and water (from e.g. ground, lakes, rivers) as heat source. Next to a classification based on the heat source applied as well the degree of integration of the solar thermal and the heat pump system have been considered. Following Freeman T.L. et al (1978), Trinkl et al (2004) or Frank E. et al (2010) the subdivision in parallel and serial will be considered onwards: Parallel systems are characterized by the fact that the solar thermal collector field and the heat pump are delivering heat in parallel to the heat sinks, sometimes via a central heat storage. Serial systems are characterized by the fact that the heat delivered by the solar thermal collector is used as low temperature heat source directly or indirectly by the heat pump It has to be noticed that these two groups are not exclusive, so one system can be of both types. Next to this two groups, in the mentioned publications a third type regeneration has been defined, including those systems where the solar thermal heat is used for the regeneration of the source, usually ground. Within the collected list as well the type integrated has been applied for the description of systems where solar thermal heat is integrated in several ways in the overall heating system. For simplification reasons in the present paper al this systems are collected under the type of serial systems. In the following figures examples of the single system types are shown. In Figure 2 and Figure 3 solar Page 2 of 12
71 thermal and heat pump systems using geothermal heat exchangers are shown. In the first case the interconnection is of parallel type only while in the second case of serial and parallel type. Sun Ground Air Water Waste Heat Flat-plate Collector Storage (source) Space Heating Electricity Heat Pump DHW Energy Carrier Backup Cold DHW Tank System 5 Drexel und Weiss GmbH Figure 2: Unified hydraulic scheme (left) and the visualization scheme square view (right) of a solar thermal and heat pump system. The system shown applies a geothermal heat exchanger as additional heat source and the solar thermal system and heat pump system are connected in a parallel way only. Sun Ground Air Water Waste Heat Flat-plate Collector Storage (source) Space Heating Electricity Heat Pump DHW Energy Carrier Backup Cold Water Tank Terra Solarwärmepumpe IDM Energiesysteme GmbH Figure 3: Unified hydraulic scheme (left) and square view (right) of a solar thermal and heat pump system. The system shown applies a geothermal heat exchanger as additional heat source and the two systems are connected in a serial and parallel way. In Figure 4 and Figure 5 solar thermal and heat pump systems using aerothermal heat pumps are shown. In the first case the interconnection is of parallel type only while in the second case of serial and parallel type. Page 3 of 12
72 Sun Ground Air Water Waste Heat Flat-plate Collector Storage (source) Space Heating Electricity Heat Pump DHW Energy Carrier Backup Cold Water Tank Hybrid Wärmepumpenspeicher Solar Power Austria Figure 4: Unified hydraulic scheme (left) and square view (right) of a solar thermal and heat pump system. The system shown applies external air as additional heat source and the two systems are connected in a parallel way only. Sun Ground Air Water Waste Heat Flat-plate Collector Storage (source) Space Heating Electricity Heat Pump DHW Energy Carrier Backup Cold Combi Tank HeatSOL SOLution GmbH Figure 5: Unified hydraulic scheme (left) and square view (right) of a solar thermal and heat pump system. The system shown applies external air as additional heat source and the two systems are connected in a serial and parallel way. The third typology of systems mentioned are those where the solar thermal collector represents the only heat source for the system. In these systems specific collectors have to be used which are able as well to work as efficient heat exchangers with the external air under conditions with no or reduced solar radiation. In the following Figure 6 an example is shown of a solar thermal and heat pump system applying hybrid solar collectors which are connected to a combi storage for DHW and to a storage including phase change material (in the shown example water / ice) serving as low temperature heat storage. In Figure 7 an example is shown of a system applying unglazed solar collectors. In this case the solar collectors are directly connected to a heat pump. Page 4 of 12
73 Sun Ground Air Water Waste Heat Hybrid Collector IceTank Space Heating Electricity Heat Pump DHW Energy Carrier Backup Cold Combi Tank Solaera Consolar GmbH Figure 6: Unified hydraulic scheme (left) and square view (right) of a solar thermal and heat pump system. The system shown applies only the solar thermal collector as heat source. A hybrid collector is used feeding the DHW tank and an ice / water storage. Sun Ground Air Water Waste Heat Unglazed Absorber Storage (source) Water Tank Space Heating Electricity Heat Pump DHW Energy Carrier Backup Cold DHW Tank Atmova SwissmetalDesign Solutions Ltd. Figure 7: Unified hydraulic scheme (left) and square view (right) of a solar thermal and heat pump system. In the present system an unglazed collector is used serving directly as heat source for the heat pump. Collecting the different solar thermal and heat pump systems, and classifying them the most typical typologies could be identified. Out of 80 collected systems, 46 apply only a parallel scheme of interconnection between the solar thermal and the heat pump system. With regard to the heat source applied it could be seen that the systems applying geothermal heat exchangers are the most common typology. In fact out of 80 systems 33 apply a geothermal heat source, 27 an aerothermal heat source and 12 systems use only the solar thermal collector as heat source. Within the rest of the systems water or exhaust air is used as low temperature heat source. Page 5 of 12
74 3. System performance evaluation methodology Nomenclature: Units and Symbols: E electrical energy electrical power Q thermal energy thermal power Subscripts: EH CP cond comp DHW HP HPS SAHPS Sol tot Vent Electric Heater Circulation Pump condenser compressor Domestic Hot Water Heat Pump Heat Pump System Solar thermal And Heat Pump System Solar total Ventilator The performance evaluation of a Solar thermal And Heat Pump System (SAHPS) can be done on the base of several figures. Possible key figures are Primary Energy Consumption, Final Energy Consumption, Electrical Energy Consumption, CO 2 emissions, Coefficient of Performance (COP) and Seasonal Performance Factors (SPF). All these figures do depend not only from the SAHPS but are strongly dependent from the boundary conditions. These boundary conditions are in part directly related to the installed system and building, such as climatic zone, thermal energy efficiency of the building, thermal gains within the building or the heat distribution system. In part they are as well connected to the region, nation or macro area where the building is located. This is especially the case if the way of electricity production is considered in order to calculate figures such as the Primary Energy Consumption or CO 2 emissions. In order to do a direct comparison of Energy Consumption Figures or CO2 emissions it would therefore be necessary to test the different SAHPS under unified boundary conditions. In order to do so unified test procedures would be necessary, which have not been developed yet. As already mentioned by Zörner W. et al (2009) or Bachmann S. et al (2008) the definition of such test procedures could enable a more transparent system description. The central performance figure used in the present paper is the Coefficient of Performance (COP) and Seasonal Performance Factor (SPF) of the heat pump, the heat pump system and the solar thermal and heat pump system. This approach has been used as well by Miara M. et al (2010), Stojanovic B. et al (2010) or Ozgener O. et al (2007). The Coefficient Of Performance is used to describe the performance power ratio of a single heat pump and considers only the heat power delivered by the condenser and the electrical power of the compressor. It is defined as follows: = (eq. 1) The Seasonal Performance Factor describes the energy performance ratio of a unit in a defined period of time (e.g. one heating season). If the unit is the heat pump there is included the energy consumption of the compressor, but as well the stand by energy consumption or the energy consumption of an eventually installed electric back up heater. While the thermal energy produced by the condenser and as well the electric heater are considered. The SPF heat pump is defined as follows: = ( ) ( ) (eq. 2) If the unit is enlarged not only the heat pump but as well the heat pump system is considered. In this case the electricity consumption of the pumps (for the geothermal heat exchanger or to the outdoor unit) and of the ventilators (in case of aerothermal systems) are included. The SPF heat pump system is defined as: Page 6 of 12
75 = ( ) ( ) (eq. 3) If the unit is further enlarged the whole solar thermal and heat pump system is considered. In this case the electricity consumption of the circulation pumps as well to the solar thermal collector field or between buffer storages is included; on the thermal side as well the thermal gains of the solar collector field are considered. The SPF solar thermal and heat pump system is defined as: = ( ) ( ) (eq. 4) The cited definitions are of general kind and intend to explain the concept of the performance figures shown in the following chapter. As the single SAHPS show very different hydraulic schemes as well the performance figures vary slightly in their definition in the single publications. In the explanations of the single systems the authors mention eventual variations. 4. Review of published monitoring results of installed systems In the following chapter an overview will be given on published monitoring results of solar thermal and heat pump systems. Heat pumps as energy units satisfying the heating demand, the domestic hot water demand and / or the cooling demand of buildings are becoming increasingly popular in Europe. Forsén M. and Nowak T. (2010) report within the Annual Outlook 2010 of the European Heat Pump Association an increase of sold units in 9 European countries from units in 2005 to over units in 2009, with a sales peak of over units in The combination of heat pumps with solar thermal systems lead to an increase of cost, size and complexity of the system assuring comfortable indoor conditions and the provision of domestic hot water. On the other hand such systems should lead to enhanced Seasonal Performance Factors of the overall system and to a reduction of the electrical energy consumption. In the following as starting point for this review and as reference for the Solar thermal And Heat Pump Systems (SAHPS) some results of a large scale monitoring campaign carried out by Fraunhofer ISE in Germany are presented. Miara M. et al (2010) evaluated about 112 heat pump systems installed in Germany and monitored them within the time frame from July 2007 to June The measurement campaign includes results of 18 aerothermal heat pump systems and 56 geothermal heat pump systems. Within this second category 41 systems apply vertical boreholes while within 15 systems horizontal geothermal collectors are applied. The measured ground source heat pump systems showed an average Seasonal Performance Factor of the heat pump system (SPF HPS ) of 3.9 (including results in the range from 3.1 to 5.1) while the aerothermal heat pumps showed an average SPF HPS of 2.9 (including results in the range from 2.3 to 3.4). The systems provided in this time frame thermal energy in order to satisfy the heating demand (responsible in average for 82% of the provided energy) and domestic hot water demand (responsible in average for 18% of the provided energy). Included in this report are as well measurement results of heat pump systems assisted by solar thermal. The monitoring results of 2 solar thermal and geothermal heat pump systems and 4 solar thermal and aerothermal heat pump systems are shown. The measured seasonal performance factor of the whole system including the electrical energy consumption and thermal energy gain of the solar thermal system (SPF SAHPS ) is between 4.9 and 6 for the geothermal heat pump systems and between 2.8 and 3.4 for the aerothermal heat pump systems. Detailed comments and explanations to these results can be found in the report. V. Trillat-Berdal et al (2006) (2007) describe in their studies an installation coupling a solar thermal system and a heat pump connected with two vertical boreholes in order to cover heating and DHW demand of a new single family building in the Savoy region in Southern France. The installation was carried out within the project GEOSOL and monitoring results of the first year of operation are described. The building has a surface of 180 m² and the envelope shows a heat transfer coefficient of U= 0,63 W/(m²K), 154 m² of radiant floors were implemented in order to keep a set temperature of 19 C during the heating Page 7 of 12
76 season, the heat pump has a thermal output power of 15.8 kw and is connected to two bore holes of 90m depth each, the solar thermal collector field has a size of 12 m² and consists of flat plate collectors, the collector field is connected to a DHW tank with 500 l volume which is equipped with an electric heater. There is no connection between the geothermal heat pump and the DHW tank. With regard to the classification shown in the first chapter, the present system can be described as geothermal system of serial and parallel type. The system is implemented in such a way that the solar collector field heats up as first priority the domestic hot water tank. If DHW temperature setting is reached but further thermal energy is available from the collector field, this energy is injected in the boreholes contributing to the thermal balance of the ground. Within the study the monitoring results of the winter season 2004 / 2005 are presented. Within this time frame the system satisfies the thermal need of the building leading to an SPF HP of 3.75 and an SPF HPS of 3.2. In the present case the SPF HPS does not include the provision of domestic hot water, therefore as well the electrical energy consumption of the electric heater is not included. The solar gains through the solar thermal collector field are considered in an indirect way. In fact the solar thermal energy not requested for domestic hot water is injected in the boreholes. This energy flux amounted within the measured time frame for 2121 kwh (34% of the heat extracted from the boreholes), allowing to balance the ground load after the summer season. B. Stojanovic and J. Akander (2010) give in their study an overview of the monitoring results of an experimental SAHPS set up in a test building in Sandviken (Sweden) within the European Project EndoHousing. Within this project research installations where set up in Italy, Cyprus, Germany and Sweden. The test building in Sweden is a single family house from 1920 with limited thermal insulation and a high temperature heating distribution system (radiators). The roof is oriented east / west. The building has been equipped within the project with a commercial heat pump (thermal output 8.4 kw), a ground heat exchanger (~52 m² ground heat exchanger area, placed horizontally at a depth of 1.5 m in the ground) used as well as seasonal heat storage and 42.5 m² prototype solar collector placed on the east slope of the building. The roof integrated unglazed solar thermal collector (named Endopanel) consists of extruded aluminum profiles with welded in / outlet pipes underneath. With regard to the classification shown in the first chapter, the present system can be described as geothermal system of serial type. As the building was not used during testing phase the consumption (heating and domestic hot water) where emulated. DHW was drained twice a day to resemble a daily energy consumption of ~14 kwh, while the system had to provide the necessary thermal energy to keep an indoor temperature of above +20 C. Within the study monitoring results of a period from February 2006 till February 2008 are reported; the evaluation focuses on the second year. The monitored performance figures for this period are SPF HP =2.8 and SPF SAHPS =2.1, where the difference between the two figures are mainly explained through the electric energy consumption of the circulation pumps (CPs). A further feature of this installation is the utilization of the ground as seasonal energy storage. It is reported that the applied Ground Heat Exchanger (GHE) design was not capable of extensive seasonal heat storage. Considering the unfavorable framework conditions the authors assess this first results positive and propose several measures in order to enhance the SPF SAHPS. M. Heppelmann et al (2006) report about the set up and run in of the German EndoHousing test site. The test site has been installed in the city of Soest in Germany. An office building constructed in the year 1999 has been used, where for the project the heating of the office and workers room has been applied. On the roof facing west a 15 m² unglazed collector has been installed of similar type as applied in the EndoHousing project in Sweden (see above). A heat pump with a thermal output of 6 kw is applied in order to supply heating and DHW and a electric heater is installed as back up. Two thermal storages were implemented, a cold storage with a volume of 160 l filled with glycol and a hot storage filled with water respectively before and after the heat pump. The space heating has been realized by warm air convectors except of one room where a radiant floor heating system is used. In this system no ground heat exchanger has been implemented. With regard to the classification shown in the first chapter, the present system applies solar thermal collectors as only heat source connected to two storages. In the study only monitoring data of a few month are reported. Within the period of March 2006 the measured COP HP varied between 3.2 and 6.7. The authors report of major problems of the system in cold day s. In fact in February 2006 when outside temperature dropped below -5 C the, the temperature in the cold water tank dropped below -8 C leading to a safety switch off of the heat pump for a period of time of 3000 s. In order to avoid this switching the authors propose an improved control strategy loading the two storages during day time in order to avoid such situations. Page 8 of 12
77 Wang X. et al (2010) present in their study the monitoring results of a one year measurement campaign of an installed solar thermal and heat pump system including vertical boreholes in Harbin (China). Harbin is located in a cold climatic area, in the measured winter 2008 / 2009 the average outdoor temperature was -7.6 C. The experimental set up was installed in a new detached house with three stories. The total heating area is of 500 m², the external walls and roof were externally insulated with 150 mm polystyrene insulation boards while 30 mm boards of the same material were laid on the ground. The building is equipped with a radiant floor for heating and cooling purpose. The SAHPS is composed by a 50 m² solar thermal collector field applying independently developed high efficiency flat plat collectors. The collectors are south oriented and mounted with a tilted angle of 60. The ground heat exchanger consists of 12 boreholes, which are 50 m deep each and arranged in three rows with a minimum distance of 3.4 m between the single bore holes. The applied heat pump had a rated electrical input power of 3.7 kw. The hydraulic scheme is of such type that the solar thermal energy can be used for direct heating, for regeneration of the boreholes and can be connected to the evaporator of the heat pump. With regard to the classification shown in the first chapter, the present system can be described as geothermal system of serial and parallel type. The experimental set up has been used for heating and cooling but not for the provision of DHW. In fact during the measurement period of April 2008 to April 2009 the building was not used, the indoor temperature was set to be at least 18 C, no internal loads were emulated. The set temperature was mostly reached, only in the coldest day s with average outdoor temperature of C the average indoor temperature was with 16.5 C, slightly below the set value. For the heating season a SPF HP = 4.29 has been measured, while the SPF SAHPS was in the same timeframe 6.55; This is due the fact that 49.7% of the total heating output was supplied directly by the solar thermal collector field. In the measured year the soil temperature at 50 m rose from 4.2 C to 7.2 C in the period from April to October, it decreased again to 4 C in January of the following year and from then it rose to around 6 C in April. These temperature where measured in an observation well, placed with 2.5 m distance from one row of the boreholes. Ochs F. et (2011) report in their study monitoring and simulation results of a SAHPS applied in order to satisfy the heating and domestic hot water demand of a thermally very energy efficient (passive house) two family building in Austria. The building has a calculated heating demand of 15 kwh/m²y and includes a mechanical ventilation. The heat is distributed via radiant floors, on the roof are placed 10,2 m² of glazed flat plate collectors. A heat pump with a rated electrical input power of 4.8 kw and an electric direct back up heater (for DHW only) is installed. Key component of the system is the ground heat exchanger placed horizontal below the building. In order to save cost and enhance the construction is has actually been included in the base construction, which is mainly set up of the ground heat exchanger, isolation layer and concrete layer. The hydraulic scheme is of such type that the solar thermal energy can be used for direct heating of the central storage and for regeneration of the borehole. With regard to the classification shown in the first chapter, the present system can be described as geothermal system of parallel and serial type. The measurement results show an actual heating demand of 23 kwh/m²y within the year 2009 / 2010 and an energy demand for the DHW of a similar order of magnitude. The overall electricity demand for the ventilation, heating and DHW system is given with 16.7 kwh/m²y. The specific solar yield of the solar thermal collector field was 485 kwh/m²y, while the SPF HP is reported with 3.1. This limited SPF HP is commented with not optimally suited single components and the low ground temperatures, in fact the ground below the building even after the summer month did not reach temperatures above 22 C, similar temperatures have been measured as well in the undisturbed ground next to the building in the same time period. The seasonal storage effect is therefore regarded by the authors as very limited and actually the system is described as geothermal system with solar ground regeneration. The primary energy consumption of the system is given with 44 kwh/m²y and through the carried out simulations and optimization potential down to 32 kwh/m²y is estimated. This value is regarded as interesting low value but the system as quite complex with a significant risk of failures / not optimized control situations. It is highlighted that such low values are only possible if a very energy efficient building envelope is applied. Thissen B. (2011) reports about a test installation in Switzerland where the monitoring started in March Within this test installation unglazed solar thermal collectors have been coupled to a commercial solar thermal and heat pump system which uses only solar thermal collectors as heat source and includes a latent (ice / water) storage. This system is commercially offered with glazed hybrid collectors. The test installation has been done in an energetically renovated single family house with a ground gross surface of 230 m². The overall measured heating demand is given with 11 MWh/year and the DHW demand with 1.5 MWh/year. A radiant wall heating system is applied for the heat distribution and 30 m² of the mentioned unglazed Page 9 of 12
78 collectors where installed on a roof facing east + 10, with a tilted angle of 22. With regard to the classification shown in the first chapter, the present system applies solar thermal collectors as only heat source connected to two storages. Within the period of 18 th March 2010 and 23 rd February 2011 the installed system showed an SPF SAHP of 4.3. In the timeframe from May to October the heating and DHW demand could be covered completely by the solar thermal system and the heat pump did not switch on. In single days during the winter time, it can clearly be seen that the collector works as well as heat exchangers with collector fluid temperatures being significantly below outside air temperature. For example in the night of the 13 th March 2010 the outside air temperature was -4 C while the collector fluid temperature was below -12 C. Bertram E. et al (2011) report on a pilot installation realized on a single family house near Frankfurt (Germany). The system consists of 39 m² unglazed solar thermal photovoltaic collectors, 3 vertical ground heat exchangers with a debt of 75 m and a heat pump with a rated input power of 12 kw. The application of solar thermal photovoltaic collectors (PVT) is expected to have a benefit for thermal energy production by enhancing the source temperature of the heat pump and for the electrical energy production by reducing the temperature of the PV modules. In order to measure this second effect at the pilot installation not thermally connected reference PV modules have been installed. The hydraulic scheme seems of such type that the solar thermal energy can be used for regeneration of the boreholes. With regard to the classification shown in the first chapter, the present system can be described as geothermal system of serial type. Within the measured period from March 2009 till April 2010 an enhanced electrical energy production of the PVT collector by 4% in comparison to the reference PV module has been measured. The SPF HPS is given with 4.3 while the SPF SAHPS is given with 4.0, the average brine temperature from the ground heat exchanger is given with 5.7 C. A TRNSYS model has been realized by the authors in order to research the effect of the PVT collector on the average brine temperature, using the measured data of the installed system. According to the given explanations the average brine temperature is expected to be 2.3 C, if no PVT collector would have been coupled to the geothermal heat pump systems; this difference results according to the authors in an electrical energy saving of 10%. Further details as well to the simulated long term behavior are given in the publication. 5. Conclusions The target of the present paper was to give an overview on commercially available Solar thermal And Heat Pump Systems (SAHPS) and a review on published monitoring results from realized installations. Regarding the market overview within the IEA SHC Task44 / HPP Annex 38 a list of 95 commercially presented SAHPS could be collected. These systems were collected including the elaboration of the square view diagram and of a unified hydraulic scheme of each system. Within these systems different additional thermal energy sources are used (geothermal, aerothermal, ) and they vary strongly regarding the degree of integration of the solar thermal and the heat pump system. Not to all systems detailed information s were available to the authors. Out of 80 collected systems, 46 SAHPS apply a parallel scheme of interconnection between the solar thermal and heat pump system. Again out of 80 systems 33 apply a geothermal heat source, 27 an aerothermal heat source and 12 systems use only the solar thermal collector as heat source. Within the rest of the systems water or exhaust air is used as low temperature heat source. Regarding the practical experiences a field test monitoring of installed heat pump systems in Germany served as reference. Within this field test geothermal heat pump systems showed an average SPF HPS of 3.9, while aerothermal heat pump systems showed an average SPF HPS of 2.9. In the presented review monitoring results of 6 commercially and 7 experimentally installed solar thermal and heat pump systems could be cited. For solar thermal and geothermal heat pump systems the installations showed SPF SAHPS in the range from 2.1 to For solar thermal and aerothermal heat pump systems (including those systems where the solar collector is applied as well as heat exchanger with external air and represents the only heat source) the SPF SAHPS were in the range from 2.8 to 4.3. In most cases the installations of which detailed monitoring results have been published are individual installation s realized within scientific projects. Therefore a direct comparison between the commercially on the market presented systems and the available monitoring results are not possible. Nevertheless the cited Page 10 of 12
79 results show that an enhancement of the SPF factor of the SAHPS is not always given in comparison to heat pump systems without a solar thermal system. In fact complex hydraulic schemes, not optimized hardware components and limited control strategies can strongly limit the overall systems performance. On the other hand, specific systems do show promising performance figures. Further simulations, monitoring results of installed systems and specific test procedures for solar thermal and heat pump systems can support the clarification of which systems can show high performance figures under specific framework conditions. 6. Acknowledgments The authors would like to thank to all IEA SHC Task 44 / HPP Annex 38 partners for their collaboration and contributions to the task. The authors from EURAC research would like to kindly thank the STIFTUNG SÜDTIROLER SPARKASSE for the financial support. 7. References Bachmann S., Drück H., Müller-Steinhagen H., Solarthermie und Wärmepumpe Vorstellung verschiedener Konzepte für Solar Kombianlagen, Proceedings of the Symposium Thermische Solarenergie, Bad Staffelstein / Germany. Bertram E., Stegamnn M., Kundmüller K., Rosinski Ch., Wärmepumpensysteme mit unabgedeckten photovoltaisch-thermischen Kollektoren, Proceedings of the Symposium Thermische Solarenergie, Bad Staffelstein / Germany. Forsen M., Nowak T., European Heat Pump Statistics, [Online, cited: July 17 th, 2011] Frank E., Haller M., Herkel S., Ruschenburg J.,2010. Systematic classification of combined Solar Thermal and Heat Pump systems, EUROSUN International Conference on Solar Heating, Cooling and Buildings, Graz /Austria. Freeman T.L., Mitchel J.W., Audit T.E., Performance of combined Solar Heat Pump Systems, Solar Energy 22, Heppelmann M., Bitzer B., Morton D., Virk G. S., Run In and Usage of a Solar Assisted Heat Pump System, International Conference on Energy & Environmental Systems IASME / WSEAS, Greece. Miara M., Danny G., Kramer T., Oltersdorf T., Wapler J., Wärmepumpen Effizienz Messtechnische Untersuchung von Wärmepumpenanlagen zur Analyse und Bewertung der Effizienz im realen Betrieb, [Online, cited: July 16th, 2011] wp_effizienz_endbericht _langfassung.pdf. Ochs F., Peper S., Schnieders J., Pfluger R., Feist W., Neues Solar-Wärmepumpenkonzept-Konzept für die Wärmeversorgung von Passivhäusern Beurteilung der Effizienz durch Monitoring und Simulation, Proceedings of the Symposium Thermische Solarenergie, Bad Staffelstein / Germany. Ozgener o., Hepbasli A., A review on energy and exergy analysis of solar assisted heat pump systems, Renewable and Sustainable Energy Reviews 30, Stojanovic B., Akander J., Build up and long term performance test of a full-scale solar assisted heat pump system for residential heating in Nordic climate conditions. Applied Thermal Engineering 11, Thissen B., (2010). Kopplung von unverglasten selektiven Solarkollektoren mit einer Wärmepumpe und einem Latentwärmespeicher, Proceedings of the Symposium Thermische Solarenergie, Bad Staffelstein / Germany. Trillat-Berdal V., Souyri B., Fraisse G., Experimental study of a ground coupled heat pump combined with thermal solar collectors, Energy and Buildings 38, Trillat-Berdal V., Souyri B., Achard G., Coupling of geothermal heat pumps with thermal solar collectors, Applied Thermal Engineering 27, Trinkl C. Zörner W., Hanby V., A Review on Solar Assisted Heat Pump Systems for Domestic Heating. Proceedings of EuroSun Conference, Freiburg / Germany. Wang X., Zheng M., Wenyong Z., Zhang S., Yang T., Experimental study of a solar-assisted ground- Page 11 of 12
80 coupled heat pump system with solar seasonal thermal storage in severe cold areas. Energy and Buildings 42, Zörner W., Holger M., Trinkl C., Domestic solar / heat pump heating systems: Market overview, systems and components technologies, Proceedings of ESTEC Conference, Munich / Germany. Page 12 of 12
81 IWT-TETRA : Zongekoppelde Warmtepompsystemen ZON-WARM Eindverslag Werkpakket 3: Analyse en evaluatie van bestaande systeemconfiguraties WP3T1: Selectietabel systeemconfiguraties WP3T2: Selectie haalbare systeemconfiguraties Vakgroep Thermotechniek, Technologiecampus De Nayer Faculteit Industriële Ingenieurswetenschappen, KU Leuven Jan De Nayerlaan 5, 2860 Sint-Katelijne-Waver, België Tel.: + 32 (0) Maarten.Sourbron@kuleuven.be Auteurs: Redactie: Leen Goovaerts Dries Van Aken Jan Verheyen John Veeken Maarten Sourbron
82 IWT-TETRA : Zongekoppelde Warmtepompsystemen Eindverslag Werkpakket 3: Analyse en evaluatie van bestaande systeemconfiguraties Auteurs: Leen Goovaerts, Dries Van Aken, Jan Verheyen, John Veeken, Maarten Sourbron Copyright KU Leuven Zonder voorafgaande schriftelijke toestemming van zowel de auteur(s) als de redacteur(s) is overnemen, kopiëren, gebruiken of realiseren van deze uitgave of gedeelten ervan verboden. Voor aanvragen tot of informatie i.v.m. het overnemen en/of gebruik en/of realisatie van gedeelten uit deze publicatie, wend u tot KU Leuven Campus De Nayer, Jan De Nayerlaan 5, B-2860 Sint-Katelijne-Waver, of via iiw.thomasmore.denayer@kuleuven.be. Voorafgaande schriftelijke toestemming van de redacteur(s) is eveneens vereist voor het aanwenden van de in dit rapport beschreven (originele) methoden, producten, schakelingen en programma s voor industrieel of commercieel nut. 1
83 IWT-TETRA : Zongekoppelde Warmtepompsystemen Eindverslag Werkpakket 3: Analyse en evaluatie van bestaande systeemconfiguraties Auteurs: Leen Goovaerts, Dries Van Aken, Jan Verheyen, John Veeken, Maarten Sourbron Inhoudstafel 1 Taakbeschrijving (uit projectaanvraag) Taak 1 (WP3T1): Selectietabel systeemconfiguraties Taak 2 (WP3T2): Selectie haalbare systeemconfiguraties Overzichtstabel met systeemconfiguraties Inleiding Verschillende warmtebronnen werken samen Warmtevragers Warmteaanbieders De prestatiefactor Energie bufferen? Noodzaak van warmteopslag Warmteverlies door warmteopslag Aandacht voor hydraulische aansluitingen Regeneratie van de bodem Verschillende werkingsmodi Basisconfiguraties gecombineerde warmtepomp-zonnecollector-installaties Overzicht commerciëel aangeboden zonwarmtepompinstallaties Systeemconcepten uit IEA-SHC task44/hpp annex One beside the other Active regeneration Big buffer storage Maximal integration Unglazed collector Solar heating system Ambient air heat pump Bijlage
84 IWT-TETRA : Zongekoppelde Warmtepompsystemen Eindverslag Werkpakket 3: Analyse en evaluatie van bestaande systeemconfiguraties Auteurs: Leen Goovaerts, Dries Van Aken, Jan Verheyen, John Veeken, Maarten Sourbron 1 Taakbeschrijving (uit projectaanvraag) Architecten, installateurs, gebruikers, moeten op een snelle en eenvoudige manier een overzicht kunnen krijgen van de mogelijke systeemconfiguratie(s) die toepasbaar zijn in hun situatie (geografisch, economisch, ). Dit werkpakket heeft als doel een tool te ontwikkelen waarmee deze selectie op eenvoudige manier kan gebeuren. Eveneens is er tijdens de loop van het project een basisconfiguratie vereist, welke gebruikt wordt tijdens simulatie en labometingen. Deze basisconfiguratie wordt bekomen uit de selectietool. 1.1 Taak 1 (WP3T1): Selectietabel systeemconfiguraties Type : onderzoeksactiviteit Deze taak bouwt voort op WP2T1 waarin het basisoverzicht van bestaande technieken/configuraties/ gegeven wordt. Een overzichtstabel wordt opgemaakt met waarderingen voor de parameters omtrent comfort, ecologie, economie en duurzaamheid zodat op basis van deze overzichtstabel in de volgende taak een keuze kan gemaakt worden over welke techniek men in welke situatie het best kan toepassen. Het project focust zich niet op de gebouwen, maar vertrekt vanuit een tabel met systeemconcepten. Deze systeemconcepten worden verder onderzocht naar toepasbaarheid, CO2-emissiereductie, energiebesparing, prestatie-evaluatie, Resultaat: uitgebreide overzichtstabel met systeemconcepten 1.2 Taak 2 (WP3T2): Selectie haalbare systeemconfiguraties Type : onderzoeksactiviteit Aan de parameters omtrent comfort, economie, ecologie en duurzaamheid worden gewichtsfactoren toegekend. Al dan niet aanpasbaar voor bepaalde situaties: geografisch (afhankelijk van de regio in Vlaanderen), eisen in verband met kosten en duurzaamheid waaraan voldaan moet zijn, zodat op basis van de overzichtstabel een snelle en gefundeerde selectie kan gemaakt worden over de geschikte configuratie. Deze overzichtstabel leidt tot een selectie-tool waarbij gebruikers op een eenvoudige manier een overzicht krijgt van welke configuratie(s) best geschikt is (zijn). Op basis van deze tool wordt eveneens een systeemconfiguratie bepaald, welke algemeen toepasbaar is in Vlaanderen. Deze systeemconfiguratie zal verder gebruikt worden voor de labometingen, parameteranalyse. Resultaat: - selectietool systeemconfiguraties - basisconfiguratie koppeling warmtepomp/zonthermie NOTA: de selectietool wordt gepresenteerd in Werkpakket 6, Taak 2 3
85 IWT-TETRA : Zongekoppelde Warmtepompsystemen Eindverslag Werkpakket 3: Analyse en evaluatie van bestaande systeemconfiguraties Auteurs: Leen Goovaerts, Dries Van Aken, Jan Verheyen, John Veeken, Maarten Sourbron 2 Overzichtstabel met systeemconfiguraties 2.1 Inleiding Globaal kan een zonwarmtepomp voorgesteld worden als een installatie met twee warmtebronnen en twee warmtevragers. Figuur 1: Basisschema van een zonwarmtepomp-installatie. De warmte-aanbieders thermische zonnecollectoren en warmtepomp leveren warmte op twee temperatuurniveaus aan de warmte-vragers Sanitair Warm Water en RuimteVerwarming. 4
86 IWT-TETRA : Zongekoppelde Warmtepompsystemen Eindverslag Werkpakket 3: Analyse en evaluatie van bestaande systeemconfiguraties Auteurs: Leen Goovaerts, Dries Van Aken, Jan Verheyen, John Veeken, Maarten Sourbron 2.2 Verschillende warmtebronnen werken samen Om de installatie te ontwerpen moeten eerst de eigenschappen van de warmtevraag en van de warmteproductie gekend zijn Warmtevragers De gevraagde hoeveelheid warmte moet 1. in de juiste hoeveelheid, 2. op de juiste temperatuur en 3. op het juiste moment geleverd worden door de installatie. Voor Sanitair Warm Water (SWW) is door het gepiekte verbruik een hoog vermogen nodig en een relatief hoge temperatuur van C. Verwarming kent doorheen de dag een constantere warmtevraag op een lagere temperatuur van C. Door de betere woningisolatie daalt bovendien de jaarlijkse benodigde hoeveelheid warmte, terwijl de vraag naar SWW constant blijft (Figuur 2). Figuur 2: Netto energiebehoefte voor RV en SWW voor drie referentiewoningen uit het ZonWarm-project Warmteaanbieders De thermische zonnecollectoren (TZC) of de warmtepomp (WP) produceren de benodigde warmte. Zij gebruiken als energiebron respectievelijk de zon en een warmtebron op lage temperatuur zoals typisch de bodem of de buitenlucht. In tegenstelling tot een ketel met fossiele brandstoffen (...weliswaar gekeken vanuit het standpunt van de installatie...) is 1. de bruikbare hoeveelheid energie beperkt, 2. hebben deze energiebronnen geen onbeperkt vermogen, en 3. is deze energie, in het geval van de zon, niet op elk moment beschikbaar. Dit bemoeilijkt het ontwerp en de regeling van de installatie sterk. 5
87 IWT-TETRA : Zongekoppelde Warmtepompsystemen Eindverslag Werkpakket 3: Analyse en evaluatie van bestaande systeemconfiguraties Auteurs: Leen Goovaerts, Dries Van Aken, Jan Verheyen, John Veeken, Maarten Sourbron 2.3 De prestatiefactor Bij voorkeur moet de installatie de thermische zonnecollectoren gebruiken en als hun energie onvoldoende is in hoeveelheid of temperatuur, kan de warmtepomp bijspringen. De prestatiefactor 1, die de verhouding geeft tussen de geleverde warmte en de hoeveelheid elektriciteit die nodig is om de installatie te laten draaien, bepaalt deze volgorde. De TZC hebben een prestatiefactor die kan oplopen tot 160 of meer. Dit wil zeggen dat voor 1 kwh elektrisch pompverbruik, 160 kwh warmte wordt geleverd. De metingen van een reële installatie in het project bevestigen dat dit mogelijk is, alhoewel ook prestatiefactoren van 50 of zelfs maar 7 zijn opgemeten. Een correct installatieontwerp, -uitvoering en -regeling zijn dus cruciaal om het pompverbruik te beperken. De WP anderzijds heeft prestatiefactoren (vaak wordt de engelse term Coefficient of Performance of COP genoemd in deze context) die typisch liggen tussen 2.5 en 5, afhankelijk van het type warmtepomp. Ook hier hebben ontwerp, uitvoering en regeling een grote invloed op de uiteindelijke prestatie van de WP. SPF warmtepomp: SPF thermische zonnecollector: typische waarde 50-80; gemeten waarden tot 160, maar ook slechts Energie bufferen? Noodzaak van warmteopslag De typische gepiekte warmtevraag aan hoog vermogen van het SWW maakt, in combinatie met TZC en een WP, een thermische buffer noodzakelijk. Wanneer de TZC de temperatuur onvoldoende kunnen opvoeren voor SWW, door een te zwakke zoninstraling, kunnen ze mogelijk nog wel warmte leveren voor de ruimteverwarming. Omdat ook hier zelden vraag en aanbod gelijktijdig zijn, zal ook een thermische buffer voor RV nodig zijn. Soms zal die al aanwezig zijn om een goede werking van de warmtepomp te garanderen. De buffers voor SWW en RV kunnen eventueel gecombineerd worden in een gezamelijk combi-buffervat (zie paragraaf 3Fout! Verwijzingsbron niet gevonden.). De metingen tonen aan dat reële installaties SPF-waarden van 5 en zelfs meer dan 6 halen bij dergelijke systemen, waarbij de TZC 30% tot 40% van de energie voor SWW en RVW leveren Warmteverlies door warmteopslag Maar een thermische buffer verliest ook warmte. Zeker wanneer de energievraag kleiner wordt (zie Woning 1 uit Figuur 2 of wanneer de warmtevraag in tussenseizoenen klein is), kan het aandeel van het bufferverlies groot worden. Metingen op reële installaties van het ZonWarmproject hebben energieverliezen van 7% tot meer dan 40% opgeleverd. Dit laatste treedt op wanneer de installatie op deellast werkt en de thermische buffer op temperatuur gehouden wordt voor slechts een kleine energievraag. Overdimensionering van de buffer moet dus absoluut vermeden worden en de installateur moet aandacht schenken aan een correcte isolatie van de aansluitingen tussen buffervat en leidingen. 1 Een prestatiefactor gemeten over een lange termijn van bv. 1 jaar wordt de SeizoensPrestatieFactor of SPF genoemd 6
88 IWT-TETRA : Zongekoppelde Warmtepompsystemen Eindverslag Werkpakket 3: Analyse en evaluatie van bestaande systeemconfiguraties Auteurs: Leen Goovaerts, Dries Van Aken, Jan Verheyen, John Veeken, Maarten Sourbron Aandacht voor hydraulische aansluitingen Ook de positie van de hydraulische aansluitingen en de temperatuurvoelers die de regelaar aansturen, hebben een grote impact op de systeemprestatie. Foute positionering zorgt voor menging van de verschillende temperatuurniveaus waardoor bijvoorbeeld de TZC hogere temperaturen zien in het buffervat en dus minder energie kunnen leveren en waardoor de warmtepomp aan hogere afgiftetemperaturen moet werken met een lagere performantie tot gevolg. Een simulatieanalyse van dergelijke niet optimale aansluitingen 2 toont aan dat dit de SPF met 1,0 kan doen dalen. 2.5 Regeneratie van de bodem Wanneer het temperatuurniveau van de TZC nog te laag is voor RV of de thermische buffers opgeladen zijn, kan bij een bodem-water WP overwogen worden om de bodemlussen te regenereren. Hierdoor stijgt de temperatuur van de bodem, wat de prestatiefactor van de warmtepomp ten goede komt. Wegens de te lage meetfrequentie bij de reële installaties was het moeilijk om hierover vanuit het ZonWarmproject concrete uitspraken te doen: van één installatie werd bij een 7 uur durende regeneratieperiode een prestatiefactor van 60 gemeten. De impact van deze energieinjectie van 60kWh en bijhorende bodemtemperatuurstijging van ongeveer 1 C op de prestatie van de warmtepomp is moeilijker te becijferen. Simulatiestudies 3 wijzen uit dat regeneratie de prestatiefactor met 0,2 kan doen stijgen. Een negatieve impact is echter ook mogelijk bij een slechte inregeling van de debieten. In dat geval zal de circulatiepomp die nodig is voor de regeneratie meer verbruiken dan dat het warmtepompverbruik zal dalen door de hogere prestatiefactor. 2.6 Verschillende werkingsmodi Uit deze analyse kunnen we drie werkingsmodi voor de thermische zonnecollectoren afleiden: 1. In serie met de warmtepomp: de zonnecollectoren zijn zelf de bron voor de warmtepomp 2. In parallel met de warmtepomp: zonnecollectoren en warmtepomp werken naast elkaar 3. Als regeneratie van de warmtebron van de warmtepomp Dit leidt tot de schema s uit Figuur 3. 2 John Veeken, Jan Verheyen, Leen Goovaerts, Dries Van Aken, Maarten Sourbron, The impact of storage tank control and hydraulic configuration on solar heat pump system performance, submitted for System Simulation in Buildings 2014, December 2014, Liège, Belgium 3 Erik Bertram*, Peter Pärisch and Rainer Tepe, Impact of solar heat pump system concepts on seasonal performance-simulation studies, EuroSun 2006, June 2006, Glasgow, UK 7
89 IWT-TETRA : Zongekoppelde Warmtepompsystemen Eindverslag Werkpakket 3: Analyse en evaluatie van bestaande systeemconfiguraties Auteurs: Leen Goovaerts, Dries Van Aken, Jan Verheyen, John Veeken, Maarten Sourbron Figuur 3: (1) Zonnecollectoren als bron voor de warmtepomp (in serie), (2) zonnecollectoren werken parallel aan de warmtepomp, (3) zonnecollectoren regenereren de warmtebron van de warmtepomp. 8

90 IWT-TETRA : Zongekoppelde Warmtepompsystemen Eindverslag Werkpakket 3: Analyse en evaluatie van bestaande systeemconfiguraties Auteurs: Leen Goovaerts, Dries Van Aken, Jan Verheyen, John Veeken, Maarten Sourbron 3 Basisconfiguraties gecombineerde warmtepomp-zonnecollectorinstallaties 3.1 Overzicht commerciëel aangeboden zonwarmtepompinstallaties Vanuit het IEA-Task44 project werden de verschillende concrete installatieschema s voor zonwarmtepomp in een lijst gezet. Twee rapporten 45 uit dit project, met courant voorkomende installatieschema s, worden hier kort toegelicht. Voor verdere literatuur rond zonwarmtepompen, wordt verwezen naar de website van IEA-Task 44 ( Rüschenburg en Herkel presenteren een samenvatting van een uitgebreide enquete naar bestaande zonwarmtepompsystemen in verschillende Europese landen (Figuur 4). Figuur 4: Overzicht van de geenqueteerde bedrijven per land en de verschillende systeemfuncties Daarnaast toont Figuur 4 dat het merendeel van de zonwarmtepompen voor SWW en RV worden ingezet, waarbij een aanzienlijk deel van de installaties (58%) ook voor koeling (actief of passief) zorgt. Figuur 5 toont duidelijk aan dat in het grootste deel van de installaties de zonnecollectoren parallel aan de warmtepomp staan, eventueel in combinatie met serie of regeneratie (93%). Enkel serie komt zelden voor (6%) terwijl enkel regeneratie quasi niet voorkomt (1%). Figuur 6 toont dat lucht en bodem als enige warmtebron het vaakst voorkomen (resp. 27% en 23%). Zon als enige warmtebron komt slechts in 7% van de gevallen voor. Wel toont Figuur 6 ook dat de zonnecollectoren in 23% van de gevallen als tweede warmtebron naast lucht, bodem of water worden gebruikt. Verder worden vlakke plaat collectoren (FPC) in bijna de halft van de gevallen toegepast (47%). Enkel vacuümbuizen worden bijna niet gebruikt, niet-afgedekte komen daarentegen in 7% van de aangeboden installaties voor. 4 Henning, 2008, Systems using solar thermal energy in combination with heat pumps, 64th ExCo meeting, November 19-21, Winterthur, Switzerland 5 Jörn Ruschenburg and Sebastian Herkel, A Review of Market-Available Solar Thermal Heat Pump Systems, A technical report of subtask A,
, parallel (P) of regeneratie (R) (of een combinatie) Figuur 6: Indeling van de systeemconcepten volgens")
91 IWT-TETRA : Zongekoppelde Warmtepompsystemen Eindverslag Werkpakket 3: Analyse en evaluatie van bestaande systeemconfiguraties Auteurs: Leen Goovaerts, Dries Van Aken, Jan Verheyen, John Veeken, Maarten Sourbron Figuur 5: Indeling van de systeemconcepten volgens serie (S), parallel (P) of regeneratie (R) (of een combinatie) Figuur 6: Indeling van de systeemconcepten volgens warmtebron en volgens het type zonnecollector (FPC: flat plate collector; ETC: evacuated tube collector; UGC: unglazed collectors; PVT: photovoltaic-thermal collector) Zoals te verwachten, worden vlakke plaat en vacuüm-collectoren het vaakst gebruikt in parallelle installaties (Figuur 7) omdat ze ontwerpen zijn om warmte op hoge temperatuur te produceren en dus rechtstreeks aan de warmtevragers kunnen leveren. Onafgedekte collectoren zullen eerder in serie-concepten terug te vinden zijn. 10
92 IWT-TETRA : Zongekoppelde Warmtepompsystemen Eindverslag Werkpakket 3: Analyse en evaluatie van bestaande systeemconfiguraties Auteurs: Leen Goovaerts, Dries Van Aken, Jan Verheyen, John Veeken, Maarten Sourbron Figuur 7: Overzicht van de zonwarmtepomp installaties gecorreleerd aan het collectortype en aan het systeemconcept (parallel, serie of regeneratie) 3.2 Systeemconcepten uit IEA-SHC task44/hpp annex 38 In het Europese project van IEA werden 7 typesystemen naar voor geschoven als standaard zonwarmtepomp installaties. Uiteraard kan hierop nog gevarieerd worden, maar hiermee is de basis geschetst One beside the other 11


93 IWT-TETRA : Zongekoppelde Warmtepompsystemen Eindverslag Werkpakket 3: Analyse en evaluatie van bestaande systeemconfiguraties Auteurs: Leen Goovaerts, Dries Van Aken, Jan Verheyen, John Veeken, Maarten Sourbron Active regeneration Big buffer storage Maximal integration 12

94 IWT-TETRA : Zongekoppelde Warmtepompsystemen Eindverslag Werkpakket 3: Analyse en evaluatie van bestaande systeemconfiguraties Auteurs: Leen Goovaerts, Dries Van Aken, Jan Verheyen, John Veeken, Maarten Sourbron Unglazed collector Solar heating system Ambient air heat pump 13
95 IWT-TETRA : Zongekoppelde Warmtepompsystemen Eindverslag Werkpakket 3: Analyse en evaluatie van bestaande systeemconfiguraties Auteurs: Leen Goovaerts, Dries Van Aken, Jan Verheyen, John Veeken, Maarten Sourbron 4 Bijlage Henning, 2008, Systems using solar thermal energy in combination with heat pumps, 64th ExCo meeting, November 19-21, Winterthur, Switzerland Jörn Ruschenburg and Sebastian Herkel, A Review of Market-Available Solar Thermal Heat Pump Systems, A technical report of subtask A,

96 Systems using solar thermal energy in combination with heat pumps 1 st concept paper to be presented at the 64 th ExCo meeting November 19-21, Winterthur, Switzerland Prepared by Hans-Martin Henning and Marek Miara Fraunhofer Institute for Solar Energy Systems ISE Heidenhofstr. 2, Freiburg, Germany Phone +49/761/ Fax +49/761/ hans-martin.henning@ise.fraunhofer.de Contents 1 Introduction and background System examples and trends Why a systematic treatment is needed Why an IEA activity? First ideas of a Task structure and possible outputs Next steps Issues for the Executive Committee...8
97 Systems using solar thermal energy in combination with heat pumps 1 st concept paper, November 2008 Report history Date Version Author/s Major changes Hans-Martin Henning Hans-Martin Henning, Marek Miara First version Version sent to ExCo page 2
98 Systems using solar thermal energy in combination with heat pumps 1 st concept paper, November Introduction and background In the last years an increasing number of systems for house heating and/or domestic hot water production has been developed which use a combination of solar thermally energy systems and vapour compression heat pumps. Prototypes have been presented at major trade fairs and first commercial systems were put on the market from various manufacturers. Manufacturers originate either from the solar energy field or from heat pumps, i.e. most manufacturers exhibit a background in one of the two main involved technologies. This is also the reason for different general approaches: - Main system components are just placed one beside the other and do not interact. Solar energy is mainly used to reduce the electricity demand for hot water preparation. These systems are mainly offered by heat pump manufacturers. - The main purpose of the heat pump is understood as a method to increase the energy gain of the solar collector system. The heat pump allows to use solar energy even if the temperature of the gained heat has a temperature level below the required temperature of the demand side (heating system, hot water). - Overall system concepts are developed in which solar energy and heat pump either work in parallel or interact in a sense that solar heat is used as heat source of the heat pump either directly or indirectly, i.e., decoupled by heat storage. The used heat storage may be sensible or latent (PCM, ice) and short term or longterm (e.g. ground). No systematic analysis of the different systems and their application potentials in different sectors and under different boundary conditions has been made. Also these systems are not yet covered in norms or standards. 2 System examples and trends Examples of systems using a combination of heat pumps and solar collectors will be presented below. The skims are limited to main system components. To simplify the illustrations, the connection with the space heating system is for all systems the same. System type 1 One beside the other (typically offered by producers of heat pumps and/or solar collectors like Viessmann, Vaillant, Nibe, Bosch Thermotechnik, ) System description: - System components are placed one beside the other and do not directly interact page 3
99 Systems using solar thermal energy in combination with heat pumps 1 st concept paper, November Simple design; control systems for a heat pump and for a solar collector usually work separately - Use of solar energy solely for the domestic hot water production - The main advantage of the system (beside producing hot water partly with solar thermal and thereby decrease the heat to be delivered by the heat pump) is the decrease of the required average inlet temperature of the heat produced by the heat pump. This contributes to the increase of the SPF (Seasonal Performance Factor) of a heat pump and to the reduce of the electricity consumption of the system - In case of ground used as heat source there is no active regeneration of the ground heat source by the solar energy but only a reduced heat extraction mainly during summer due to the solar hot water production System type 2 Active regeneration (examples IDM Energie Systeme, Immosolar, Schüco, Roth Werke) System description: - Components and benefits of the system are similar to the system 1, and additionally: - Active use of the solar energy for the support of the ground heat source regeneration, - The active regeneration causes the dehydration / drying-off of the ground around the borehole. This fact constitutes a (perhaps small) disadvantage in view of a subsequent natural regeneration. Another problem by the active regeneration is an outflow of the accumulated energy with the ground water. This process can significantly reduce the advantage of the active regeneration of the borehole and depends on local conditions. - System allows increasing of the solar gains and the prevention from the solar collector stagnation by a high irradiation and a small heat demand in summer. page 4

100 Systems using solar thermal energy in combination with heat pumps 1 st concept paper, November 2008 System type 3 Big buffer storage (examples Chemowerk CEMO, Soltex, Thermosolar) System description: - The buffer storage has a big volume (e.g. 800 l) and serves as a heat source for the heat pump, in case of a lack of energy inside the buffer the heat pump uses the borehole heat exchanger - As a result of many hydraulic components (among others two storages) the system requires more place, higher cost and a sophisticated control system - No active support for the regeneration of a ground heat source foreseen - System allows higher inlet temperature for the evaporator of the heat pump and the increase of the solar gains System type 4 Maximal integration (example SolvisMax - SOLVIS) System description: - The heart of the system is the (patented) multi-level storage tank - The condenser of the heat pump is placed directly in the storage tank - Solar collectors (often bigger field then usually) take the leading role in the system; heat pump plays an additional role - There is no active support for the regeneration of the ground heat source and no solar boosting of the heat source. The combination of the solar energy and a heat pump is similar to the system 1 one beside the other but integrated in a main buffer storage (solar combi-system approach) - Very compact and space-saving system with one control device for the whole system page 5
101 Systems using solar thermal energy in combination with heat pumps 1 st concept paper, November Preparation of domestic hot water arranged with an external heat exchanger System type 5 Unglazed collector (several examples in different configurations) System description: - The system uses the unglazed solar collector solely to increase the inlet temperature for the evaporator of the heat pump and for active regeneration of a ground heat source but not for active domestic hot water heating - Use of the unglazed solar collectors reduces the costs of the system and allows good integration of collectors with the shape of a house - Similar to other systems with active regeneration of the ground heat source, there is a potential for shortening of the borehole System type 6 Solar heating system (SOLAERA Comsolar), other similar systems using ice-water storage (Aquasol, terra sunenergy) System description: - The main components of the system are special made hybrid solar collectors with air-exchanger, heat pump, water storage tank and ice-water storage tank page 6
102 Systems using solar thermal energy in combination with heat pumps 1 st concept paper, November The ice-water storage accumulates very efficiently the energy conducted by the hybrid collector. The heat pump uses the energy accumulated in the ice storage and produces heat for the heating system and for domestic hot water - The low temperature of the ice storage allows almost losses-free accumulation of the energy - No ground heat exchanger (e.g. borehole) is required for this system - The hybrid collector uses the solar irradiation or the heat of ambient air System type 7 Ambient air heat pump (SOLution, ratiotherm) System description: - The main components of the system are solar collectors, air-to-water heat pump and water multi-storage tank - The heat pump uses the energy from the solar collectors or ambient air (but not with the solar collector used as air heat exchanger like in system type 6) and produces heat for the heating system and for domestic hot water - No ground heat exchanger (e.g. borehole) is required for this system 3 Why a systematic treatment is needed The increasing number of offered systems using a combination of solar thermal energy and heat pumps and the high expectations about their contribution to energy efficient heating, hot water (and possibly cooling) of buildings give reason for a systematic treatment. A systemic comparison of existing systems is needed from the economical and environmental point of view. In addition, it is highly advisable to adjust various systems to distinct boundary conditions, for instance diverse buildings standards or climate zones. Merely a systematic approach, including the modeling, simulations and field-testing of the joint use of solar thermal energy and heat pumps, allows optimization and further development of the relevant systems. After all only a high quality of offered systems will ensure a sustainable development of markets for this type of combinations of solar thermal systems and heat pumps. This high quality needs a common, agreed approach for system characterization, bench-marking and standardization. Otherwise danger is given that examples of installations with bad results and unsatisfied users do not only affect the market for combined systems (solar thermal + heat pumps) but also the markets for heat pumps and solar thermal energy use. page 7
103 Systems using solar thermal energy in combination with heat pumps 1 st concept paper, November Why an IEA activity? The IEA Solar Heating and Cooling Programme provides an excellent platform for the development of common understanding of the different systems offered in different countries and using different schematics as shown in section 2. This includes the development of performance figures, economic figures, identification of potential applications (building standards, building types, climates) and pre-normative work aiming at the development of methods which could become standards later. In addition a joint international activity which involves industries (manufacturers, system suppliers) will help in the development of the technology and possibly bring up new or optimized solutions. Finally many of the companies involved in this technology field are internationally active and thus an international collaboration seems helpful and efficient. 5 First ideas of a Task structure and possible outputs The Task should be a joint Task with the IEA Heat Pump Programme (HPP). A possible structure might involve 4 subtaks: A Overview about solutions and generic systems B Performance figures and performance assessment C Modeling and simulation D Dissemination and pre-normative work Main outputs might be - Technical report on system schematics - Proposals for implementation into standards (for heat pumps and/or solar thermal systems) - System models including models for new components which may be not available so far (e.g. solar collector / air heat exchanger; storage with integrated condenser of the heat pump) - R&D roadmap - 6 Next steps We suggest that a Task Definition Workshop is organized. Participants should be composed of experts from R&D institutes and from companies involved this technology field. Experts should also be invited through the IEA Heat Pump Programme. Main questions to be addressed: - Need for an IEA Task/Annex? - Main wishes/needs from industry side? - Possible Task structure and contributions 7 Issues for the Executive Committee - Discuss concept paper - Check national interest - Decide on next steps (Task Definition Workshop) page 8


104 A Review of Market-Available Solar Thermal Heat Pump Systems A technical report of subtask A Date: By Jörn Ruschenburg and Sebastian Herkel 1 with contributions from W. Becke, M. D Antoni, S. Eicher, K. Ellehauge, H. Focke, M. Haller, M. Huber, I. Katić, A. Loose, I. Malenković, A. Thür and M. Vukits 1 Institution Fraunhofer ISE Address Heidenhofstr. 2, Freiburg, Germany Phone Fax sebastian.herkel@ise.fraunhofer.de
 is an autonomous body within the framework of the Organization for Economic Co-operation and Development (OECD) based")
105 IEA SHC Task 44 / HPP Annex IEA Solar Heating and Cooling Programme The International Energy Agency (IEA) is an autonomous body within the framework of the Organization for Economic Co-operation and Development (OECD) based in Paris. Established in 1974 after the first oil shock, the IEA is committed to carrying out a comprehensive program of energy cooperation among its members and the Commission of the European Communities. The IEA provides a legal framework, through IEA Implementing Agreements such as the Solar Heating and Cooling Agreement, for international collaboration in energy technology research and development (R&D) and deployment. This IEA experience has proved that such collaboration contributes significantly to faster technological progress, while reducing costs; to eliminating technological risks and duplication of efforts; and to creating numerous other benefits, such as swifter expansion of the knowledge base and easier harmonization of standards. The Solar Heating and Cooling Programme was one of the first IEA Implementing Agreements to be established. Since 1977, its members have been collaborating to advance active solar and passive solar and their application in buildings and other areas, such as agriculture and industry. Current members are: Australia Finland Singapore Austria France South Africa Belgium Italy Spain Canada Mexico Sweden Denmark Netherlands Switzerland European Commission Norway United States Germany Portugal A total of 49 Tasks have been initiated, 35 of which have been completed. Each Task is managed by an Operating Agent from one of the participating countries. Overall control of the program rests with an Executive Committee comprised of one representative from each contracting party to the Implementing Agreement. In addition to the Task work, a number of special activities Memorandum of Understanding with solar thermal trade organizations, statistics collection and analysis, conferences and workshops have been undertaken. Visit the Solar Heating and Cooling Programme website to find more publications and to learn about the SHC Programme. Subtask A Report 1
106 IEA SHC Task 44 / HPP Annex Current Tasks & Working Group: Task 36 Solar Resource Knowledge Management Task 39 Polymeric Materials for Solar Thermal Applications Task 40 Towards Net Zero Energy Solar Buildings Task 41 Solar Energy and Architecture Task 42 Compact Thermal Energy Storage Task 43 Solar Rating and Certification Procedures Task 44 Solar and Heat Pump Systems Task 45 Large Systems: Solar Heating/Cooling Systems, Seasonal Storages, Heat Pumps Task 46 Solar Resource Assessment and Forecasting Task 47 Renovation of Non-Residential Buildings Towards Sustainable Standards Task 48 Quality Assurance and Support Measures for Solar Cooling Task 49 Solar Process Heat for Production and Advanced Applications Completed Tasks: Task 1 Investigation of the Performance of Solar Heating and Cooling Systems Task 2 Coordination of Solar Heating and Cooling R&D Task 3 Performance Testing of Solar Collectors Task 4 Development of an Insolation Handbook and Instrument Package Task 5 Use of Existing Meteorological Information for Solar Energy Application Task 6 Performance of Solar Systems Using Evacuated Collectors Task 7 Central Solar Heating Plants with Seasonal Storage Task 8 Passive and Hybrid Solar Low Energy Buildings Task 9 Solar Radiation and Pyranometry Studies Task 10 Solar Materials R&D Task 11 Passive and Hybrid Solar Commercial Buildings Task 12 Building Energy Analysis and Design Tools for Solar Applications Task 13 Advanced Solar Low Energy Buildings Task 14 Advanced Active Solar Energy Systems Task 16 Photovoltaics in Buildings Task 17 Measuring and Modeling Spectral Radiation Task 18 Advanced Glazing and Associated Materials for Solar and Building Applications Task 19 Solar Air Systems Task 20 Solar Energy in Building Renovation Task 21 Daylight in Buildings Task 22 Building Energy Analysis Tools Task 23 Optimization of Solar Energy Use in Large Buildings Task 24 Solar Procurement Task 25 Solar Assisted Air Conditioning of Buildings Task 26 Solar Combisystems Task 27 Performance of Solar Facade Components Task 28 Solar Sustainable Housing Task 29 Solar Crop Drying Task 31 Daylighting Buildings in the 21st Century Task 32 Advanced Storage Concepts for Solar and Low Energy Buildings Task 33 Solar Heat for Industrial Processes Task 34 Testing and Validation of Building Energy Simulation Tools Task 35 PV/Thermal Solar Systems Task 37 Advanced Housing Renovation with Solar & Conservation Task 38 Solar Thermal Cooling and Air Conditioning Completed Working Groups: CSHPSS; ISOLDE; Materials in Solar Thermal Collectors; Evaluation of Task 13 Houses; Daylight Research Subtask A Report 1

107 IEA SHC Task 44 / HPP Annex IEA Heat Pump Programme This project was carried out within the Solar Heating and Cooling Programme and also within the Heat Pump Programme, HPP which is an Implementing agreement within the International Energy Agency, IEA. This project is called Task 44 in the Solar Heating and Cooling Programme and Annex 38 in the Heat pump Programme. The Implementing Agreement for a Programme of Research, Development, Demonstration and Promotion of Heat Pumping Technologies (IA) forms the legal basis for the IEA Heat Pump Programme. Signatories of the IA are either governments or organizations designated by their respective governments to conduct programmes in the field of energy conservation. Under the IA collaborative tasks or Annexes in the field of heat pumps are undertaken. These tasks are conducted on a cost-sharing and/or task-sharing basis by the participating countries. An Annex is in general coordinated by one country which acts as the Operating Agent (manager). Annexes have specific topics and work plans and operate for a specified period, usually several years. The objectives vary from information exchange to the development and implementation of technology. This report presents the results of one Annex. The Programme is governed by an Executive Committee, which monitors existing projects and identifies new areas where collaborative effort may be beneficial. The IEA Heat Pump Centre A central role within the IEA Heat Pump Programme is played by the IEA Heat Pump Centre (HPC). Consistent with the overall objective of the IA the HPC seeks to advance and disseminate knowledge about heat pumps, and promote their use wherever appropriate. Activities of the HPC include the production of a quarterly newsletter and the webpage, the organization of workshops, an inquiry service and a promotion programme. The HPC also publishes selected results from other Annexes, and this publication is one result of this activity. For further information about the IEA Heat Pump Programme and for inquiries on heat pump issues in general contact the IEA Heat Pump Centre at the following address: IEA Heat Pump Centre Box 857 SE BORÅS Sweden Phone: Fax: Visit the Heat Pump Programme website to find more publications and to learn about the HPP Programme. Legal Notice Neither the IEA Heat Pump Centre nor the SHC Programme nor any person acting on their behalf: (a) makes any warranty or representation, express or implied, with respect to the information contained in this report; or (b) assumes liabilities with respect to the use of, or damages, resulting from the use of this information. Reference herein to any specific commercial product, process, or service by trade name, trademark, manufacturer, or otherwise, does not necessarily constitute or imply its endorsement recommendation or favouring. The views and opinions of authors expressed herein do not necessarily state or reflect those of the IEA Programmes, or any of its employees. The information herein is presented in the authors own words. Subtask A Report 1
108 IEA SHC Task 44 / HPP Annex Contents 1 Executive Summary Introduction System Analysis and Classification Approach and Principles Systematic Graphical Representation of Solar Heat Pumps Denotation Scheme Simplified Notation and Classification Comparative Analysis of Market-Available Systems Methods Surveyed Companies System Functions System Concepts Heat Pump Characteristics Energy Sources Collector Types Cross Analysis between Collector Type and System Concept Relevance and market penetration illustrated with the example of Germany Conclusions and Outlook Bibliography...14 Annex A Evaluated Companies...15 Subtask A Report 1
109 IEA SHC Task 44 / HPP Annex Executive Summary Solar heat pump systems seen as a combination of a solar thermal collector and a compression heat pump already entered the market with more than 130 systems offered. The aim of this report is to collect, to describe and to analyse these currently available systems. There are five main criteria to describe a solar heat pump system: (i) The use of the generated heat; (ii) the low temperature source(s) for the heat pump; (iii) the energy carrier used to drive the system; (iv) the function and placement of storages in the system and (v) the interactions between these components. For the latter, abstract descriptions like parallel, serial or regenerative are used as well as its combinations. In addition the systems will be described by the type of used components like flat-plate, unglazed or evacuated tube collectors. Furthermore, the efficiency of such a system depends on the ratio of sizing of the components and the control. Thus, a simple qualitative classification of these systems with the aim of an easy communication to the public leads not to a satisfying solution. Nevertheless the systems can be categorized by such criteria, depending on the leading question to be answered. A unified graphical representation is presented which reflects qualitative criteria mentioned above, called square view. The systematic description of the systems is completed by a non-ambiguous denotation scheme and a categorisation scheme. The undertaken survey shows that most of the systems are used for a combined production of domestic hot water and heat for the space heating circuit. In addition, many systems are able to deliver cold as well. Approximately a quarter uses ambient air as only source for the heat pump, a quarter the ground and nearly half of the systems are multisource or other systems. Seven combinations of serial, parallel and regenerative layouts can be found on the today s market. As additional result of the market survey, the need for flexible performance figures and testing methods becomes visible. It was, for example, shown that serial or more complex configurations are widely distributed, which is ignored by today s standards. In these cases, solar energy is extensively used as energy source for the heat pump, though not directly as useful energy. Consequently, assessment methods are required taking into account the energy both consumed from and fed-in to the grid, similar to cogeneration systems. 2 Introduction Numerous combinations of heat pumps and solar thermal collectors, henceforward referred to as solar heat pump (SHP) systems, became market-ready during the last years. It is evident, as shown in Section 4.2, that some systems entered the market even in the early 1980s, obviously motivated by the second oil crisis. An explicit and enduring trend developed just in the current century, though. This storyline shows much similarity to that of the nonsolar heat pump market in Europe (cf. Nowak and Murphy 2011). The idea of combing solar energy with heat pumps has already been reflected decades ago and is revived in younger publications by means of theoretical analysis, simulation studies, laboratory tests or field tests. However, there is a lack of methods or even standards for the assessment of such systems. With regard to the specific system concepts and boundary conditions, it has to be investigated whether a significant enhancement of the solar gain as Subtask A Report 1 Page 1 of 16
110 IEA SHC Task 44 / HPP Annex well as a reduced primary energy demand of the heat supply system can be achieved compared to a conventional solution. 3 System Analysis and Classification 3.1 Approach and Principles The fact that, in literature, various specifications are analysed to describe or compare SHP systems is clearly demonstrated by Frank et al Depending on the respective interests, independent authors focus on parameters that seldom coincide. The aspects chosen for the scope of this report are listed in Table 1. Additionally, it can be seen to which extent these parameters were surveyed and/or analysed by other authors. Table 1: Examined parameters and their prevalence Parameters provenance and distribution Tepe and Rönnelid (2002) Müller et al. (2008) Henning and Miara (2009) Trojek and Augsten (2009) Berner (2011) Frank et al system functions x x x x system concept x x x x heat pump characteristics x x x x collector characteristics x x x The possibilities to set up categories for a system classification are equally various. For example, the systems can be described by the type of applied components like flat-plate, unglazed or evacuated tube collectors, or alternatively by the refrigerant used in the heat pump cycle. Furthermore, the efficiency of such a system is dependent on the location, on the sizing of the components and on the control. So, a simple classification of these systems with the aim of an easy communication to the public leads not to a satisfying solution. In this chapter, a graphical representation is introduced to systematically analyse and to compare solar heat pump systems. Afterwards, these examinations result in the derivation and presentation of a denotation scheme and a classification approach. 3.2 Systematic Graphical Representation of Solar Heat Pumps Basically, the visualisation presented in this report is similar to energy flow charts that are frequently used in building energy engineering. Instead of a whole building, it is the heating system that is illustrated centrally against white background, including energy-storing (blue Subtask A Report 1 Page 2 of 16
111 IEA SHC Task 44 / HPP Annex objects) and energy-transforming components (orange objects). The analysis of many combined solar and heat pumps systems resulted in the finding of five recurring components. They comprise collector, heat pump and backup heater, complemented by storages, namely one on the source side and one on the sink side of the heat pump. For these components, fixed positions are defined. Still, specifications like the collector type may be chosen. As defined boundaries (grey background), environmental energy (green objects) enters the system from above, final or to be purchased energy in case of electricity generating systems even bidirectional traded energy from the left (dark grey objects). Useful energy like DHW flows to the right (red objects). In any case, the information provided by the colouring is an additional feature, i.e. it is not essential for understanding the presented concept. In theory, any losses would be shown leaving the system downwards. However, because of the purely qualitative nature of the analytical approach, component sizes, efficiencies, etc. are not shown, and thus no losses. A label for the manufacturer s and the concept s name is added in the lower left part. The final step is the depiction of energy flows connecting certain components. In doing so, the figure is enhanced to become a qualitative energy flow chart. Each line style refers to the carrier medium, except the driving energies that are mostly without mass, e.g. solar irradiation. A simple example for a complete visualisation is given by Figure 1. Figure 1: Introductory example for the visualisation scheme It has to be pointed out that all possible operational modes of one system (excluding defrosting) are shown simultaneously in one visualisation. All components appearing in a particular system are depicted as filled, other components remain as shaded frame as placeholders for orientation and comparability purposes. Subtask A Report 1 Page 3 of 16

112 IEA SHC Task 44 / HPP Annex Figure 2: Simplified hydraulic scheme (left) and visualisation (right) of a solar heat pump system Nuos Solare by Ariston Thermo SpA. The system is exclusively designed for the heating of DHW. It features a flat-plate collector and a direct-evaporating air source heat pump with its condenser immersed in a DHW storage. Figure 3: Simplified hydraulic scheme (left) and visualisation (right) of a solar heat pump system Solar Pump by Giordano Industries, S.A.. The system is exclusively designed for the heating of DHW. It features an unglazed collector and a heat pump with its condenser immersed in a DHW storage. Figure 4: Simplified hydraulic scheme (left) and visualisation (right) of a solar heat pump system Jordvarme DC by Dansk Varmepumpe Industri A/S. The system is designed for DHW preparation as well as space heating (symbol of two concentric circles). It features an unspecified collector and a heat pump with its condenser immersed in a combined storage tank. In the figures above, the presented visualisation scheme is applied to typical system concepts. Here, a hydraulic scheme is used as well, considerably simplifying any hydraulics and ignoring the application of backup heating elements. The comparison between the figures gives an impression of the visualisation method s capability. As an additional finding, Subtask A Report 1 Page 4 of 16
113 IEA SHC Task 44 / HPP Annex it can be seen that the arrangement defined above results in energy flows mostly in left-toright and up-down directions, though of course, the variety of combinations results in exceptions. 3.3 Denotation Scheme With the exception of backup heating, the information comprised in the visualisation schemes in Section 3.2 can also be denoted in letters with the abbreviation code shown in Table 2 and the convention that the sources and sinks of the solar collector (S) and the heat pump (HP) are indicated with superscripts (sources) and subscripts (sinks) around the abbreviation SHP which stands for solar heat pump: SHP Table 2: Abbreviations used for transferring the system information into a letter code S solar collector Air air srs source-side storage HP heat pump G ground sks sink-side storage Sol solar irradiation W ground water SH space heating (directly) With this way of notation, the systems shown in Section 3.2 would be denoted as follows: Nuos Solare by Ariston Thermo SpA Figure 2 SHP Solar Pump by Giordano Industries, S.A. Figure 3 SHP Jordvarme DC by Dansk Varmepumpe Industri A/S Figure 4 SHP Such a formalised notification scheme allows a further use as base for simplified performance calculations for solar heat pump systems. 3.4 Simplified Notation and Classification For the scope of this report, the system concepts are defined by the way the heat pump and the solar subsystem interact. Typically (cf. Freeman et al. 1979, Citherlet et al. 2008), the following distinction is made: Collector and heat pump independently supply useful energy (space heating and/or DHW), usually via one or more storages. This configuration is denoted as parallel. The collector acts as a source of the heat pump, either as exclusive or as additional source, and either directly or via a buffer storage. This configuration is denoted as serial. A third concept shall be used here, namely the use of solar energy to regenerate the actual source of the heat pump, usually ground, which is comprehensively described and examined Subtask A Report 1 Page 5 of 16
114 IEA SHC Task 44 / HPP Annex by Kjellson (2009). The regenerative approach could possibly be regarded as a subset of the serial concept. There are conceptual and operational differences, though: Regenerative operation is usually applied to improve or at least to maintain the quality of the ground source for long time scales or merely to prevent solar collector stagnation (cf. Hartmann and Schwarzburger 2009). Consequently, regenerative operation usually occurs in summer, when highest solar availability and lowest heating demand concur, i.e., when the heat pump is off. Many systems were found on the market indeed featuring a regenerative mode explicitly, partially without an intended serial mode. The objection that the regenerative concept is presented neither by Freeman et al. nor by Citherlet et al. can obviously be explained by the fact that only non-regenerable air-source heat pump systems were examined then. Nevertheless, it was realised within these publications that concepts can be combined within one system, or in other words, that parallel and serial arrangements do not exclude each other. The counting of all possible combinations of the three proposed options while ignoring permutations, redundancies and the trivial case of none results therefore in 7 concepts. Cooling functions of SHP systems are not represented by this approach, though they might provide regenerative effects as well. If we use P (parallel), S (serial or source) and R (regeneration) as abbreviations for the options, and if we put the abbreviation SHP for Solar Heat Pump in front to indicate the subject of classification and to add recognition value, we get categories like: SHP/P (cf. Figure 2) SHP/P,S (cf. Figure 3) SHP/P,R (cf. Figure 4) etc. 4 Comparative Analysis of Market-Available Systems The basis of the presented analyses is formed by 135 combined solar thermal heat pump systems, provided by 88 companies from 11 countries. 4.1 Methods The presented and analysed systems were surveyed between October 2011 and September 2012 by members of 10 research institutions participating in Task 44 / Annex 38 (see title page). This means that companies were preferably searched and contacted by native speakers being at the same time proven experts in the field of modern heating technology. Like all activities of Task 44 / Annex 38, the market survey and the subsequent analyses are limited to SHP systems that are equipped with electrical-driven heat pumps and designed for DHW preparation and/or residential space heating. Cooling functions are documented as supplementary information only. In principle, any heat pump can be combined with any solar thermal collector. Therefore, only those companies were taken account of which genuinely provide at least one of the main components, i.e. solar collector, heat pump, storage(s) and/or controller. Research projects are also ignored; gigantic numbers of individual SHP systems would accumulate otherwise. To ensure comparability, the characteristics of each SHP system were documented in a harmonised way on two-sided fact sheets, including data on the overall concept, hydraulics, Subtask A Report 1 Page 6 of 16
115 IEA SHC Task 44 / HPP Annex dimensioning and system control, as well as technical specifications mainly of the collector, heat pump and storage(s). Most data are derived from online or print sources, though personal contact to representatives of the companies could be established in most of the cases, enabling interviews. Anyhow, it is clear that the correctness of the retrieved information cannot be checked systematically and independently. Moreover, completeness cannot be claimed. The fact that the majority of identified companies originates from countries 1 officially participating in Task 44 / Annex 38 might possibly be explained by the barrier of language, resulting in certain countries erroneously being underrepresented or even unrepresented. It has to be noted that in the following analyses, all systems are treated equally, i.e., without respecting the number of installations. Respecting the number of installations for each system would certainly lead to quite different results. The data base is incomplete here, but when it comes to market penetration, most conventional approaches as can be expected outnumber the less classical configurations. Finally, it is pointed out that, due to imperfect data collection, the sample size is not necessarily constant throughout this paper. From the 88 researched companies, for example, all appear in Figure 5 but only 60 in Figure 6. But as all figures are labelled with absolute numbers, the sample size can easily be calculated if desired. The aspects to be analysed were already presented in Table 1. Certain surveyed aspects will not be examined here. The reason is that their application turned out to be most flexible, and thus hardly comparable, comprising: additional heat generators, i.e. back-up components like electric heating elements, gasfuelled boilers or wood stoves; sometimes offered optionally and almost always diversified regarding type, number and way of integration, storage characteristics, e.g. number and function; separated storages for space heating and DHW can be chosen for most systems as well as combined storages, and the dimensioning of any components, e.g. nominal heating capacity, collector area and storage volume; these are too flexible to be specified for comparative analyses. It is clear that many companies offer more than one system. So, in conjunction with the discussion on parameters to be analysed, the question arises which parameters are defined as being distinctive. Within the scope of the survey, either a different concept (cf. Section 4.4) or a different source of the heat pump (cf. Section 4.5) justifies a distinguishable system. It has to be accepted that this decision is to some extent arbitrary. Depending on the reader, the collector type or the refrigerant used within the heat pump might be regarded as more important, and a consideration of these aspects would unquestionably result in a multiple of distinguishable systems. 4.2 Surveyed Companies As it can be seen in Figure 5, most of the surveyed companies are based in Germany (48 %) or Austria (19 %). Only a minority of all companies, however, restricts their market to one or two countries. The strong majority distributes their systems in three or more specified countries, even beyond those already named below, e.g. to Croatia or to Greece. Being available in Europe or worldwide was claimed less frequently. 1 confer Figure 5; all presented countries except of Sweden and China officially participate in Task 44 / Annex 38 Subtask A Report 1 Page 7 of 16

116 IEA SHC Task 44 / HPP Annex Figure 5: Surveyed companies by country Figure 6 shows that most companies entered the SHP market in recent years. It has to be noted that systems withdrawn from the market before or during the time the survey was conducted are ignored. Few are known to the authors, and it is estimated that their complete number is rather small. Figure 6: Companies entering the market of solar heat pump systems (The oldest system offered by each company is used as indicator, provided that it is still marketed today.) 4.3 System Functions The main functions for SHP systems, especially for residential applications, are space heating and the preparation of DHW. Figure 7 shows that both of these functions are featured in most cases. In contrast, few market-available systems are exclusively designed for DHW preparation. The fact that all Chinese systems and significant shares of the systems originating from the Mediterranean countries (France, Italy, Spain) are included within the latter is identified as strong indicator for market-specific and climate-specific system layout. Regarding the technical design, these DHW only systems can be divided into two groups: Roof-top thermosyphon constructions backed-up by an (air-source) heat Subtask A Report 1 Page 8 of 16
117 IEA SHC Task 44 / HPP Annex pump appear to be representative for China. In Europe, in contrast, storage and (often exhaust-air) heat pumps are typically installed indoors as one integrated unit, with the condenser of the heat pump immersed in the storage tank or coiled around it. Figure 7: Surveyed systems by function Space cooling functions were surveyed supplementary. Interestingly, more than half of the systems (58 %) are capable of active cooling via heat pump operation and/or passive cooling via ground or water source, also known as free or natural cooling. As it is seen in Figure 7, this applies only to systems that already offer space heating. It appears that air/air heat pumps, as popular as they might be for residential cooling and sometimes also heating purposes, are not combined with solar thermal systems. Instead, hydronic distribution is applied without exception. Here, floor-heating systems are repeatedly recommended though rarely defined as mandatory. As to the DHW preparation, modern hygienic approaches are found to be popular, given by internal heat exchangers (20 % of the systems), e.g. corrugated pipes, by external fresh water stations (24 %) or by either solution to be selected (additional 7 %). Austrian companies offer such technologies much above average. 4.4 System Concepts The classification approach introduced in Section 3.4, applied to the surveyed systems, results in a fragmentation that is shown by Figure 8. The parallel only concept, which is simpler in design, installation and control, clearly dominates (61 %). SHP systems with serial only (6 %) or regenerative only concepts (1 %) are rare. Most impressively, concepts with any combination of parallel, serial and/or parallel modes amount to no less than 33 %. Subtask A Report 1 Page 9 of 16

118 IEA SHC Task 44 / HPP Annex Figure 8: Surveyed systems by concept 4.5 Heat Pump Characteristics Energy Sources Leaving aside air/air heat pumps mainly used for space cooling in Mediterranean countries, it can be said that ambient air and ground are the most common sources for heat pump installations in Europe, while water and exhaust air cover smaller shares (cf. Nowak and Murphy 2011). Though not recorded by such statistics, Figure 8 demonstrates that energy converted by solar collectors is repeatedly utilised as a source, i.e. the serial concept and its variations. It becomes clear that even the serial-only concept allows other possible sources within the same system. Regarding the classical sources, Figure 9 illustrates that either pure air-source or pure ground-source heat pumps together are applied in half of the surveyed systems, namely 27 % and 23 %, respectively. Water (9 %) or exhaust air (2 %) are utilised as a source in few systems. Commercial SHP systems with waste-water or other sources appear untraceable. Figure 9: Surveyed systems by source Systems using solar energy as the sole source amount to 7 %. For a further 23 %, solar energy is used in addition to other conventional sources (air, ground or water). Such multisource systems require technical solutions which can be split into two groups, external and internal ones. The former refers to modified hydraulics between solar subsystem and heat Subtask A Report 1 Page 10 of 16

119 IEA SHC Task 44 / HPP Annex pump, e.g. by heat exchangers between solar loop and ground-source loop or even by joint brine loops. Thus, conventional heat pumps and solar collectors can be used. The latter means that either the heat pump or the solar collectors are specifically designed to be integrated within serial SHP systems. Though this approach is rare, offered by not more than 6 companies, it comprises the most alternative solutions, including: multi-source evaporators (two evaporators within one refrigerant cycle), directly-evaporating solar collectors (with refrigerant as circulating fluid for the solar loop), and hybrid collectors (the solar thermal collectors includes also the ambient air unit with integrated fan or other active technology). 4.6 Collector Types Within the conducted survey, the collector type was chosen as the most significant parameter to compare the applied solar subsystem. The results are shown in Figure 10. Questions on additional characteristics e.g. regarding the circulating fluid, material, operational modes, Solar Keymark certification or handling of stagnation were answered incomprehensively, and thus, these parameters cannot be presented in comparative form. Figure 10: Surveyed systems by collector type Flat-plate collectors (FPC) are stipulated in nearly half of the systems (47 %), whereas evacuated tube collectors (ETC) are essential only in the fewest cases (2 %). Instead, the choice between these two types is frequently left open, i.e. affected by the conditions on-site as well as the preferences of client and installer (36 %). Uncovered or unglazed collectors (UGC) are found repeatedly (7 %), mainly in specific applications (cf. Section 4.7). Recently developed photovoltaic-thermal (PVT) collectors are found only in few market-available SHP systems (4 %), according to this survey for the first time in Cross Analysis between Collector Type and System Concept When compared to flat-plate and evacuated tube collectors, photovoltaic-thermal and unglazed collectors are efficient only at low temperatures and thus inefficient for space heating and even more for the preparation of DHW. Independently, from the basics of heat pump technology, it is known that the source temperature for residential heating applications is relatively low though at the same time desired to be as high as possible, given the Subtask A Report 1 Page 11 of 16
120 IEA SHC Task 44 / HPP Annex conditions at site. The logical reasoning out of these observations would be that, if installed within SHP systems, UGCs and PVT collectors are preferably applied to concepts with serial and/or regenerative character while FPCs and ETCs are favoured for parallel concepts. The acquired data (cf. Figure 8 and Figure 10) allows verification by means of correlation. Figure 11 is a bubble plot with discrete values in all dimensions. The labelling for the collector types is given in accordance to Section 4.6, for the system concepts in accordance with Section 3.4. The area of each bubble is proportional to the number of respective systems. Figure 11: Surveyed systems correlated by collector type and system concept FPCs and ETCs preponderate within the parallel-only concept and all of its combinations. In contrast, UGCs and PVT collectors are never applied to parallel-only concepts but dominate both serial-only and regenerative-only concepts. This last insight is especially interesting, given the fact that FPCs or ETCs are found in 86 % of the systems in total. All in all, it is evident that the marketed systems mirror the theoretical considerations given above. 5 Relevance and market penetration illustrated with the example of Germany This section deals with the question to which extent SHP penetrated the market, or in other word, how many SHP systems are installed, either in absolute numbers or relative to conventional, i.e. non-solar heat pump systems. Unfortunately, such numbers are not monitored systematically, either on national or on international level. Separated numbers, without information about possible combinations, are well-established for both heat pumps and solar thermal collectors. For example, the European Solar Thermal Industry Federation ESTIF covers European solar thermal markets in great detail, and its comprehensive statistics are available online. Similarly, the European Heat Pump Association EHPA presents the development of European heat pump markets, Subtask A Report 1 Page 12 of 16
121 IEA SHC Task 44 / HPP Annex though for members only. However, neither of these or other institutions deals with combination. Furthermore, the manufacturers of heating equipment present their numbers carefully. In personal communications to the authors, they typically state that between 5 and 10 % of the produced heat pumps are installed with a solar thermal combination. A company distributing products as separated units instead of system solution is usually not able to provide any numbers. Partly, companies are not willing to state any numbers, which has of course to be accepted. Nevertheless, some other indicative values can be presented here, only referring to the German market. There are two reasons why Germany is chosen here. First, it is shown Section 4.2 that its market is most considerable compared to any other monitored country. Second, it is the only country where data was available at all, aggregated by three independent institutions. The results are explained in the following: The Federal Office of Economics and Export Control (Bundesamt für Wirtschaft und Ausfuhrkontrolle BAFA): Among other activities, this office promotes renewable energies by means of subsidisation. If a heat pump is installed in combination with a solar thermal system, an additional combination bonus can be granted, introduced in Since then, about 11 % of the supported heat pump installations also received the combination bonus (BAFA 2012). It has to be noted that BAFA subsidies are only applicable to renovation projects of certain size, and only upon application. Thus, less than a quarter of the German heat pump or solar thermal market is covered. Institut Wohnen und Umwelt (IWU) and Bremer Energie Institut (BEI): These institutes used a method were 7500 questionnaires were answered by building owners or property managers in After evaluating and scaling-up of these data, it is found that heat pumps are installed in about 1.5 % of about 18 million residential buildings in Germany. SHP systems exist in about 0.4 % of the buildings, or in other words, 26 % of the heat pumps are installed in a solar thermal combination. Information regarding the statistical uncertainties can be found in the report (IWU 2010). The Institute for Heating and Oil Technology (Institut für Wärme und Oeltechnik IWO): This institute conducts a yearly survey with about 1000 heating installation companies, asking for the numbers of installations of typical heat generators, and for the combination with solar thermal energy in particular. Both new buildings and renovation projects are covered. According to these surveys between 2008 and 2011, among 20 and 27 % of the electrical-driven heat pumps were combined with solar thermal systems (IWO 2012). 6 Conclusions and Outlook In this report, approaches for the analysis, representation and categorisation of solar heat pump systems were presented. They are based on scientific literature and the analysis of market-available systems. Three complementary elements were elucidated: a simplified graphical system representation used as qualitative analysis tool, a notation scheme, and a categorisation approach. The last approach with its 7 categories can be applied to all solar heat pump systems known today and also to future systems. Unlike former approaches, its categories do not exclude each other. It is therefore meant to replace former descriptions. Subtask A Report 1 Page 13 of 16
122 IEA SHC Task 44 / HPP Annex Within a market survey carried out by participants from several countries, 135 marketavailable SHP systems were identified. Most companies offer conventional systems with FPCs in parallel arrangement for both space heating and preparation of DHW. Still, manifold alternatives are found for each analysed parameter. As a main result of this survey, many technological and market-specific particularities of SHP systems are identified. For example, the fact that all Chinese systems and significant shares of the systems originating from the Mediterranean countries are designed for DHW preparation without space heating is identified as strong indicator for market-specific and climate-specific system layout. Probably the best example regarding the system design is the extensive usage especially of unglazed collectors in serial concepts. Here, it is evident that the industry follows theoretical considerations both in ecology and economy. This approach is, by definition, infeasible for non-solar heat pumps system as well as for solar heating systems combined with any fossil fuel heating. As additional result of this survey, the need for flexible performance figures and testing methods becomes visible. It was, for example, shown that serial or more complex configurations are widely distributed in Europe, which is ignored by today s standards. In these cases, solar energy is extensively used as source energy for the heat pump though not directly as useful energy. The application of PVT collectors in market-ready systems is a rather young trend. Consequently, assessment methods are required taking into account the energy both consumed from and fed-in to the grid, similar to cogeneration systems. Based on these results, performance figures as well as monitoring concepts can be developed to assess existing and even future systems. For example, it may be found that certain concepts are in general less efficient or that increased technical complexity required for some configurations does not result in a corresponding increased performance. The trend shown in Figure 6 suggests that further companies will enter the market of SHP systems soon. Furthermore, even systems offered today may be subject to changes in system concept or its components. The introduction of PVT collectors and the choice of refrigerants are examples. The dynamic history should remind the readers that the situation as presented in this report is merely a snap-shot. 7 Bibliography BAFA Bundesamt für Wirtschaft und Ausfuhrkontrolle, Marktanreizprogramm geförderte Anlagen, 2012, unpublished Berner, J., Wärmepumpe und Solar. Solarenergie den Vortritt lassen, Sonne Wind & Wärme 35 (8), 2011, Citherlet, S., Bony, J., Nguyen, B., SOL-PAC: Analyse des performances du couplage d une pompe à chaleur avec une installation solaire thermique pour la rénovation Rapport final, Haute Ecole d Ingénierie et de Gestion du Canton de Vaud (HEIG-VD). Laboratoire d Energétique Solaire et de Physique du Bâtiment (LESBAT), 2008, Yverdon-les-Bains, Switzerland Frank, E., Haller, M., Herkel, S., Ruschenburg, J., Systematic classification of combined solar thermal and heat pump systems, Proc. of the International Conference on Solar Heating, Cooling and Buildings, 2010, Graz, Austria Subtask A Report 1 Page 14 of 16
123 IEA SHC Task 44 / HPP Annex Freeman, T L., Mitchell, J W., Audit, T E., Performance of combined solar-heat pump systems, Solar Energy 22 (2), 1979, Hartmann, F., Schwarzburger, H., Systemtechnik für Wärmepumpen. Solar- und Umweltwärme für Wohngebäude, Hüthig & Pflaum Verlag GmbH & Co. Fachliteratur KG, 2009, Munich/Heidelberg, Germany Henning, H.-M., Miara, M., Kombination Solarthermie und Wärmepumpe Lösungsansätze, Chancen und Grenzen, Wittwer, V. (Ed.), Proc. of the 19. Symposium Thermische Solarenergie, 2009, Ostbayerisches Technologie-Transfer-Institut (OTTI), Bad Staffelstein, Germany IWO Institut für Wärme und Oeltechnik, Anlagenbaubefragung Solaranteile in Modernisierung plus Neubau, 2012, Hamburg, Germany IWU Institut Wohnen und Umwelt (Diefenbach, N., Cischinsky, H., Rodenfels, M.) and Bremer Energie Institut BEI (Clausnitzer, K.-D.), Datenbasis Gebäudebestand Datenerhebung zur energetischen Qualität und zu den Modernisierungstrends im deutschen Wohngebäudebestand, 2010, Darmstadt, Germany Kjellson, E., Solar collectors combined with ground-source heat pumps in dwellings, Ph.D. thesis, 2009, Lund University, Sweden Müller, H., Trinkl, C., Zörner, W., Kurzstudie Niederst- und Niedertemperaturkollektoren, 2008, Hochschule Ingolstadt (Institut für Angewandte Forschung), Ingolstadt, Germany Nowak, T., Murphy, P., Outlook European Heat Pump Statistics, 2011, The European Heat Pump Association EEIG (EHPA), Brussels, Belgium Tepe, R., Rönnelid, M., Solfångere och värmepump: Marknadsöversikt och preliminära simuleringsresultat, 2002, Centrum för Solenergiforskning, Solar Energy Research Center, Högskolan Dalarna, Borlänge, Sweden Trojek, S., Augsten, E., Solartechnik und Wärmepumpe. Sie finden zusammen, Sonne Wind & Wärme 33(6), 2009, Annex A Evaluated Companies 3s Swiss Solar Systems AG Ochsner Wärmepumpen GmbH Airwell Deutschland GmbH Orange Energy GmbH & Co. KG Alpha-InnoTec GmbH Prosolar Fertigungstechnik GmbH & Co. KG Aquasol Solartechnik GmbH ratiotherm Heizung + Solartechnik GmbH & Co. KG Ariston SpA Rehau AG + Co August Brötje GmbH Remko GmbH & Co. KG BioEnergieTeam GmbH Rennergy Systems AG Bosch Thermotechnik GmbH Rheinzink GmbH & Co. KG C. Bösch GmbH Rotex GmbH Capito GmbH & Co. KG Roth Werke GmbH Subtask A Report 1 Page 15 of 16
124 IEA SHC Task 44 / HPP Annex Clivet SpA Consolar Solare Energiesysteme GmbH Daikin Europe N.V. deematrix GmbH Drexel und Weiss GmbH DVI A/S Elcotherm AG Energie Est, Lda Energie Solaire SA EnergyPanel S.L. Evi Heat AB Giordano Industries, S.A. Glen Dimplex Deutschland GmbH Green Products GmbH Grünenwald AG Guangdong Vanward New Electric Co., Ltd. Harreither GmbH Hautec GmbH Heliopac SAS Heliotherm Wärmepumpentechnik GmbH Herz Energietechnik GmbH Hoval GmbH Icopal Danmark A/S IDM-Energiesysteme GmbH Immosolar GmbH isocal HeizKühlsysteme GmbH Kioto Clear Energy AG Max Weishaupt GmbH MHG Heiztechnik GmbH Milö- & Varmitek AB Nibe AB Nilan A/S Nordic Energy Group ApS Sanpone New Energy Technology Co., Ltd. Schüco International KG Siko Solar GmbH SmartHeat Deutschland GmbH Sofath-BDR Thermea Group B.V. Solar Power Austria Soltex Solar-Wärmepumpen-Kopplungen Soltop Schuppisser AG SOLution Solartechnik GmbH Solvis GmbH & Co. KG Sonne3 GmbH Sonnenkraft Österreich Vertriebs GmbH Stiebel Eltron GmbH & Co. KG Thermic Energy RZ GmbH Thermo Solar AG Thorens Energies Tritherm Thorén TRN Värmepumpar AB Vaillant Deutschland GmbH & Co. KG Vesttherm A/S Viessmann Werke GmbH & Co. KG Walter Bösch GmbH & Co. KG Walter Meier (Klima Schweiz) AG Waterkotte GmbH Westfa Vertriebs- und Verwaltungs-GmbH Wolf GmbH Viessmann Werke GmbH & Co. KG Walter Bösch GmbH & Co. KG Walter Meier (Klima Schweiz) AG Waterkotte GmbH Westfa Vertriebs- und Verwaltungs-GmbH Wolf GmbH Subtask A Report 1 Page 16 of 16
125 IWT-TETRA : Zongekoppelde Warmtepompsystemen ZON-WARM Eindverslag Werkpakket 4: Modellering geselecteerde systeemconfiguraties WP4T1:Parameteranalyse WP4T2:Dimensioneringsrichtlijnen Vakgroep Thermotechniek, Technologiecampus De Nayer Faculteit Industriële Ingenieurswetenschappen, KU Leuven Jan De Nayerlaan 5, 2860 Sint-Katelijne-Waver, België Tel.: + 32 (0) Maarten.Sourbron@kuleuven.be Auteurs: Redactie: Leen Goovaerts Dries Van Aken Jan Verheyen John Veeken Maarten Sourbron
126 IWT-TETRA : Zongekoppelde Warmtepompsystemen Eindverslag: Werkpakket 4: Modellering geselecteerde systeemconfiguratie Auteurs: Leen Goovaerts, Dries Van Aken, Jan Verheyen, John Veeken, Maarten Sourbron Copyright KU Leuven Zonder voorafgaande schriftelijke toestemming van zowel de auteur(s) als de redacteur(s) is overnemen, kopiëren, gebruiken of realiseren van deze uitgave of gedeelten ervan verboden. Voor aanvragen tot of informatie i.v.m. het overnemen en/of gebruik en/of realisatie van gedeelten uit deze publicatie, wend u tot KU Leuven Campus De Nayer, Jan De Nayerlaan 5, B-2860 Sint-Katelijne-Waver, of via iiw.thomasmore.denayer@kuleuven.be. Voorafgaande schriftelijke toestemming van de redacteur(s) is eveneens vereist voor het aanwenden van de in dit rapport beschreven (originele) methoden, producten, schakelingen en programma s voor industrieel of commercieel nut. 1
127 IWT-TETRA : Zongekoppelde Warmtepompsystemen Eindverslag: Werkpakket 4: Modellering geselecteerde systeemconfiguratie Auteurs: Leen Goovaerts, Dries Van Aken, Jan Verheyen, John Veeken, Maarten Sourbron Inhoudstafel 1 Taakbeschrijving (uit projectaanvraag) Taak 1 (WP4T1): Parameteranalyse Taak 2 (WP4T2): Dimensioneringsrichtlijnen Parameteranalyse en verbeterde basisconfiguratie Basisgegevens voor de simulatie-analyse Gebruikte software systeemconfiguraties Bodemkarakteristiek Gebouwen Verwarmingssysteem Warm water profiel Buffervolume sanitair warm water Buffervolume ruimteverwarming (indien aanwezig) Warmtevermogen warmtepomp Bronvermogen van de warmtepomp Dimensionering van de bron Thermische zonnecollector Dimensies van de zonwarmtepomp-installaties Parametervariaties Resultaten van de parameteranalyse Verschil tussen SYS-REF, SYS-COMBI en SYS-REG Invloed collectoroppervlakte SYS-REF Invloed collectoroppervlakte SYS-COMBI Invloed buffervolume SYS-REF Invloed buffervolume SYS-COMBI Dimensioneringsrichtlijnen Bijlage 1: Gedetailleerde ontwerp-procedure voor de gesimuleerde zonwarmtepomp-installaties 17 2
128 IWT-TETRA : Zongekoppelde Warmtepompsystemen Eindverslag: Werkpakket 4: Modellering geselecteerde systeemconfiguratie Auteurs: Leen Goovaerts, Dries Van Aken, Jan Verheyen, John Veeken, Maarten Sourbron 1 Taakbeschrijving (uit projectaanvraag) Op basis van de basisconfiguratie uit WP3T2 dient een parameteranalyse uitgevoerd te worden en de configuratie geoptimaliseerd. Uitgaande van deze optimale configuratie en berekeningsmethoden uit WP2T1 worden dimensioneringsrichtlijnen voorgeschreven. 1.1 Taak 1 (WP4T1): Parameteranalyse Type : onderzoeksactiviteit Uitgaande van een belastingspatroon van een courante woning met standaard bezetting (vast te leggen door de projectmedewerkers) wordt een parameteranalyse uitgevoerd op de basisconfiguratie. Door bepaling van de invloed van alle parameters (grootte systeemcomponenten, instelling- en regel-parameters, ) kan een optimale configuratie bekomen worden. Streefdoel van deze optimalisatie is een minimaal primair energieverbruik (en dus ook CO2-uitstoot) gekoppeld aan economische randvoorwaarden. Voor de parameteranalyse wordt voornamelijk geopteerd voor een detailsimulatiepakket (Polysun, TSOL/WP-SOL, ), waarin meerdere bestaande configuraties voldoende gedetailleerd gesimuleerd kunnen worden. Eventueel kan ook gekozen worden voor een dynamisch simulatiepakket (Trnsys, E+, ), waarin de gebruiker meer vrijheid heeft, maar deze pakketten vereisen een langere studie alvorens men correct kan simuleren. Eventuele nieuwe configuraties kunnen met deze pakketten gesimuleerd worden. Resultaat: - sensitiviteit van de verschillende parameters - optimale basisconfiguratie 1.2 Taak 2 (WP4T2): Dimensioneringsrichtlijnen Type : onderzoeksactiviteit Ontwerpers, installateurs, hebben nood aan bruikbare ontwerpberekeningen van de mogelijke installatiecomponenten op zich, maar ook van de volledige configuratie. Deze taak bestaat er dan ook in, de bestaande berekeningsmethoden van de componenten te inventariseren en te combineren tot één geheel. Mogelijke berekeningsmethoden zijn te vinden in voorgaande projecten uitgevoerd aan Lessius Mechelen Campus De Nayer en moeten worden nagekeken op hun relevantie bij de koppeling van warmtepompen met zonthermische systemen. Voor de resterende componenten moet de gepaste methodiek opgezocht/opgesteld worden. Resultaat: dimensioneringsrichtlijnen koppeling zonthermie/warmtepomp 3
129 IWT-TETRA : Zongekoppelde Warmtepompsystemen Eindverslag: Werkpakket 4: Modellering geselecteerde systeemconfiguratie Auteurs: Leen Goovaerts, Dries Van Aken, Jan Verheyen, John Veeken, Maarten Sourbron 2 Parameteranalyse en verbeterde basisconfiguratie 2.1 Basisgegevens voor de simulatie-analyse De simulatie-analyse werd uitgevoerd op basis van de gegevens en parameters die overeengekomen waren in het IEA-SHC task 44 / HPP annex 38-project Solar and Heat Pump systems ( (zie ZonWarm_Eindverslag_WP0). Binnen dit consortium van onderzoeksgroepen zijn gelijke randvoorwaarden afgesproken om de simulatieresultaten van iedere groep vergelijkbaar te maken. De zonwarmtepomp-installatie moet warmte leveren voor ruimteverwarming (RV) en voor sanitair warm water (SWW). In grote lijnen volgt hier het overzicht (meer details zijn te vinden in de Engelstalige bijlage) Gebruikte software Polysun version 7.0 [Vela Solaris; 2014] systeemconfiguraties De 3 zonwarmtepomp-installaties uit Figuur 1 zijn gesimuleerd. Op basis van de technologieverkenning, literatuurstudie (WP2) en de registratie van de technologische noden van de bedrijven (zie WP1), werden deze installatieschema s geselecteerd. Voor het regeneratieschema moet vermeld worden dat de simulatieresultaten met enig voorbehoud moeten geïnterpreteerd worden, omdat onvoldoende geweten is hoe het bodem-model van POLYSUN omgaat met de regeneratie Bodemkarakteristiek De bodemgegevens worden bepaald op basis van het Geotrainet handboek 1. Hier wordt uitgegaan van een uniforme bodemlaag met een warmtegeleidbaarheid van 2 W/mK, een warmtecapaciteit van 800 J/kgK. 1 McCorry M., Jones G.Ll. (eds); 2011; Geotrainet Training Manual for Designers of Shallow Geothermal Systems; Geotrainet, European Federation of Geologists; Brussels; 2011; 4


130 IWT-TETRA : Zongekoppelde Warmtepompsystemen Eindverslag: Werkpakket 4: Modellering geselecteerde systeemconfiguratie Auteurs: Leen Goovaerts, Dries Van Aken, Jan Verheyen, John Veeken, Maarten Sourbron SYS-REF SYS-COMBI SYS-REG Figuur 1: Zonwarmtepomp-installaties uit de simulatiestudie [Vela Solaris; 2014] 2 2 In de simulatie-code zijn andere benamingen gebruikt: SYS-REF=SYS2; SYS-REG=SYS3; SYS-COMBI=SYS1 5
131 IWT-TETRA : Zongekoppelde Warmtepompsystemen Eindverslag: Werkpakket 4: Modellering geselecteerde systeemconfiguratie Auteurs: Leen Goovaerts, Dries Van Aken, Jan Verheyen, John Veeken, Maarten Sourbron Gebouwen Drie versie van hetzelfde gebouw worden overgenomen uit T44: SFH15: passiefhuisstandaard (uiteindelijk net geen PH) SFH45: goede huidige standaard SFH100: niet-gerenoveerde woning Basisparameters (resp. Voor SFH015, SFH045 en SFH100 als 3 parameters gegeven) : Vloeroppervlakte: 140 m² Volume: 390 m³ Transmissie-oppervlak: 329 m² Verliescoëfficiënt wanden: 0.24; 0.36; 0.80 W/m²K Verliescoëfficiënt ramen: 1.0; 1.5; 3.0 W/m²K Luchtwisselingen: 0.4 ACH Verwarmingsvermogen: 20; 34; 63 W/m² Interne warmtewinsten: 6.5W/m² of 911W (continu) Verdere parameters zijn te vinden in Bijlage Verwarmingssysteem De volgende karakteristieken gelden: Afgiftesysteem SFH015 en SFH045: vergrote radiatoren op regime (Polysun kan geen gebouwgeïntegreerd afgiftesysteem simuleren met een thermische massa) Afgiftesysteem SFH100: radiatoren op regime De resulterende warmtevraag is: SFH015: 16 kwh/m² (net geen PassiefHuis standaard van 15kWh/m²) SFH045: 50 kwh/m² SFH100: 150 kwh/m² OPMERKING: deze resultaten wijken iets af van de resultaten uit IEA-Task44 omdat deze gebouwen gesimuleerd werden met een klimaatbestand van Ukkel, terwijl dit voor IEA-Task44 voor Straatsburg was Warm water profiel Het warm water verbruiksprofiel is overgenomen uit IEA-Task44 (details zie bijlage). Het is gebaseerd op een gemiddeld aftapvolume van: 140 liter per dag (koud water 10 C) 5.8 kwh per dag (2133 kwh per jaar) Dit komt overeen met 100 liter per dag aan 60 C (koud water 10 C) Het jaarprofiel wordt gecorrigeerd met een sinus-functie (amplitude 20%, max. op 9 februari) 6
132 IWT-TETRA : Zongekoppelde Warmtepompsystemen Eindverslag: Werkpakket 4: Modellering geselecteerde systeemconfiguratie Auteurs: Leen Goovaerts, Dries Van Aken, Jan Verheyen, John Veeken, Maarten Sourbron Buffervolume sanitair warm water Op basis van de richtlijnen van de Code van Goede Praktijk (voor een huishouden van 2,3 personen, het Belgische gemiddelde): 1.2 x (max. dagvolume +40l) = 260 l Geen extra zonne-volume is toegevoegd 54% zonnevolume; 46 % naverwarmingsvolume Er wordt verondersteld dat de warmtepomp dit volume in 4 uur tijd moet kunnen opwarmen, wat een vermogen voor SWW oplevert van: Q SWW = 3398 W Buffervolume ruimteverwarming (indien aanwezig) De redenering is dat het RV-buffervolume moet de minimale uit -tijd van de warmtepomp (hier 10min) kunnen overbruggen en moet dus gedurende 10 minuten het piek-warmtevermogen kunnen leveren: SFH015: 82 liter (2840 T = 5 C) SFH045: 137 liter T = 5 C) SFH100: 128 liter (8868 T = 10 C) Warmtevermogen warmtepomp Het thermisch vermogen van de warmtepomp: Q Warmtepomp = max (Q Op basis van een warmteverliesberekeningen volgens EN12831 is Q RV: RV, Q SWW) SFH015: 2840 W (20.3 W/m²) SFH045: 4780 W (34.1 W/m²) SFH100: 8868 W (63.3 W/m²) Q SWW = 3398 W werd hogerop berekend. Verder: Er wordt in basis geen rekening gehouden met de aanwezigheid van de zonnecollectoren Geen backup Als het vermogen voor RV (Q RV) kleiner is dan het vermogen (Q SWW) dat nodig is om het SWW-buffervolume in 4 uur tijd op te warmen, dan is Q SWW het ontwerpvermogen voor de warmtepomp Dit levert als thermisch vermogen voor de warmtepomp: SFH015: 3398 W (24.3 W/m²) (= Q SWW) SFH045: 4780 W (34.1 W/m²) (= Q RV) SFH100: 8868 W (63.3 W/m²) (= Q RV) 7

133 IWT-TETRA : Zongekoppelde Warmtepompsystemen Eindverslag: Werkpakket 4: Modellering geselecteerde systeemconfiguratie Auteurs: Leen Goovaerts, Dries Van Aken, Jan Verheyen, John Veeken, Maarten Sourbron Bronvermogen van de warmtepomp Het bronvermogen van de warmtepomp wordt berekend op basis van het boven vermelde afgiftevermogen en een optimistische COP-waarde (een hoge COP leidt tot een hoog aandeel van de bron in de totale energietoevoer naar de warmtepomp). 1 Q bron = Q afgifte (1 ) COP optimistisch Tabel 1: Optimistische COP-waarden voor de dimensionering van de bron (overgenomen uit Code van Goede Praktijk voor de toepassing van warmtepompsystemen in de woningbouw (VEA, 2005), p62) Dimensionering van de bron Voor een vertikale bodemwarmtewisselaar: 50W/m boorlengte (aan te passen naar de lokale omstandigheden!) Thermische zonnecollector Dimensionering op basis van de eenvoudige rekenregel uit de Technische Voorlichting van WTCB 3 : 50 liter SWW-buffervolume per m² zonnecollector Enkel vlakke plaat zonnecollectoren worden bekeken. 3 WTCB; 1999; TVN 212 leidraad voor de installatie van zonneboilers; Wetenschappelijk en Technisch Centrum voor het Bouwbedrijf; 2e uitgave; Brussel; juni 1999; 8
134 IWT-TETRA : Zongekoppelde Warmtepompsystemen Eindverslag: Werkpakket 4: Modellering geselecteerde systeemconfiguratie Auteurs: Leen Goovaerts, Dries Van Aken, Jan Verheyen, John Veeken, Maarten Sourbron Dimensies van de zonwarmtepomp-installaties Deze dimensioneringsstrategie leidt tot de volgende installaties: Tabel 2: Parameters van de referentie-installaties Gebouw SFH015 SFH045 SFH100 Verliesvermogen RV (W) 2840 (20.3 W/m²) 4780 (34.1 W/m²) 8868 (63.3 W/m²) Volume RV-buffer (l) (10min Q RV leveren) SWW profiel 100% 100% 100% (% van T44-profiel) Volume SWW-buffer (l) Temp. SWW-buffer ( C) Opwarmvermogen SWW-buffer (W) (10 C-->55 C op 4u) Afgiftevermogen warmtepomp (W) 3398 (Q SWW) 4780 (Q RV) 8868 (Q RV) Lengte vertikale bodem-ww (m) (@ 50W/m) Opp. vlakke plaat collector (m²) Parametervariaties Op basis van de vorige stappen werd voor elke basisconfiguratie een referentiesysteem opgebouwd. De parametersanalyse start met dit referentiesysteem is varieert: Voor de drie huizen SFH015, SFH045 en SFH100 Voor de 4 systeemconfiguraties Voor de oppervlakte van de vlakke plaat collectoren: 50%-100%-200% Voor het SWW-buffervolume: 50%-100%-150% 9
135 IWT-TETRA : Zongekoppelde Warmtepompsystemen Eindverslag: Werkpakket 4: Modellering geselecteerde systeemconfiguratie Auteurs: Leen Goovaerts, Dries Van Aken, Jan Verheyen, John Veeken, Maarten Sourbron 2.3 Resultaten van de parameteranalyse Verschil tussen SYS-REF, SYS-COMBI en SYS-REG De onderstaande tabel toont de simulatieresultaten met opslagvolume en zonnecollectoroppervlakte zoals in de basisdimensionering. Tabel 3: Vergelijking tussen SYS-REF, SYS-COMBI en SYS-REG (Etot=Totaal el. verbruik; Ewp=el. verbruik van de warmtepomp; Epar=el. verbruik van de circulatiepompen; Quse=warmtelevering aan het gebouw; SPF=Seasonal Performance Factor) Verschil SYS Etot Ewp Epar Quse SPF (basisdimensionering) 015-Sys-REF Sys-COMBI % % % % % 015-Sys-REG % % % % % 045-Sys-REF Sys-COMBI % % % % % 045-Sys-REG % % % % % 100-Sys-REF Sys-COMBI % % % % % 100-Sys-REG % % % % % Figuur 2: Vergelijking van de 3 basisinstallaties (Etot=Totaal el. verbruik; Ewp=el. verbruik van de warmtepomp; Epar=el. verbruik van de circulatiepompen) SYS-REF (zonnecollectoren enkel voor SWW) heeft een lager energieverbruik Etot dan de twee andere installaties. Vooral bij de SFH015 woning is dit verschil groot: 25% en 18%. Bij de SFH015 woning ligt het aan een combinatie van het verbruik van de warmtepomp (Ewp) en van de circulatiepompen (Epar), bij de SFH045 en SFH100 vooral aan het hulpverbruik van de circulatiepompen (Epar). 10
136 IWT-TETRA : Zongekoppelde Warmtepompsystemen Eindverslag: Werkpakket 4: Modellering geselecteerde systeemconfiguratie Auteurs: Leen Goovaerts, Dries Van Aken, Jan Verheyen, John Veeken, Maarten Sourbron Naast het verschillende parasitair verbruik, kan het verschil tussen SYS-REF en SYS-COMBI ook verklaard worden als het warmteverlies van het opslagvat vergeleken wordt (zie Tabel 4). De verliezen van het combi-opslagvat zijn 1,5 of meer keer groter dan het SWW-buffervat van SYS-REF (en ook SYS-REG). Tabel 4: Vergelijking van de verliezen van het opslagvat Verschil SYS (basisdimensionering) Tank heat loss Connections heat loss Total storage heat loss Diff. with SYS- REF 015-Sys-REF Sys-COMBI % 015-Sys-REG % 045-Sys-REF Sys-COMBI % 045-Sys-REG % 100-Sys-REF Sys-COMBI % 100-Sys-REG % De SPF waarde van SYS-COMBI en SYS-REG zijn duidelijk lager dan de overeenkomstige waarde van SYS-REF. Dit geldt ook, zij het in mindere mate voor de SPF van de warmtepomp alleen (resultaat niet getoond). Voor de SFH015 woning is dit het meest uitgesproken, waaruit kan besloten worden dat voor goed geïsoleerde woningen complexere systemen, met meer hulpverbruik en warmteverlies, zwaarder wordt afgestraft. Regeneratie heeft in deze resultaten geen positief effect, noch op de gehele installatie, maar ook niet op de prestatiefactor van de warmtepomp. Dit is onverwacht omdat het verhogen van de brontemperatuur normaal gezien een positief effect heeft op de prestatie van de warmtepomp. Hier moet echter wel bij vermeld worden dat we geen voldoende duidelijk beeld hebben op de werking van het bodemmodel om de waarde hiervan in te schatten. In de volgende analyses zal SYS-REG ook niet verder worden opgenomen Invloed collectoroppervlakte SYS-REF Voor SYS-REF lijkt de basisdimensionering van de zonnecollectoren een goede ontwerpkeuze. Verkleinen levert een duidelijke daling van de systeemprestatie en het verdubbelen een stijging, zij het iets minder dan de stap van 50% naar 100% van de basisdimensionering. Verder is het duidelijk dat het toepassen van zonnecollectoren op het globale verbruik voor slecht geïsoleerde woning een zeer beperkt effect heeft. Zelfs bij een verdubbeld collectoroppervlak leveren de zonnecollectoren maar 10% van de totale warmtevraag voor ruimteverwarming en sanitair warm water. 11

137 IWT-TETRA : Zongekoppelde Warmtepompsystemen Eindverslag: Werkpakket 4: Modellering geselecteerde systeemconfiguratie Auteurs: Leen Goovaerts, Dries Van Aken, Jan Verheyen, John Veeken, Maarten Sourbron Invloed collectoroppervlakte SYS-REF Tabel 5: invloed van het collectoroppervlakte op de prestatie van SYS-REF (code: SYS-REF-woningtype-zonnecollector-opslagvolume; 100% is de basisdimensionering) Etot Eaux Epar Quse SPF Solar fraction SYS-REF % % % % SYS-REF % SYS-REF % % % % SYS-REF % % % % SYS-REF % SYS-REF % % 177-9% % SYS-REF % % 259 9% % SYS-REF % SYS-REF % % 222-7% % Figuur 3: Effect van veranderend collectoroppervlakte op de prestaties van SYS-REF 12
138 IWT-TETRA : Zongekoppelde Warmtepompsystemen Eindverslag: Werkpakket 4: Modellering geselecteerde systeemconfiguratie Auteurs: Leen Goovaerts, Dries Van Aken, Jan Verheyen, John Veeken, Maarten Sourbron Invloed collectoroppervlakte SYS-COMBI Voor de combi-installatie zijn de besluiten analoog aan die van SYS-REF, maar de systeemprestaties liggen systematisch iets lager dan bij SYS-REF. Dit was eerder al opgemerkt. Tabel 6: invloed van het collectoroppervlakte op de prestatie van SYS-COMBI (code: SYS-COMBI-woningtype-zonnecollector-opslagvolume; 100% is de basisdimensionering) SYS-COMBI SYS-COMBI SYS-COMBI SYS-COMBI SYS-COMBI SYS-COMBI SYS-COMBI SYS-COMBI SYS-COMBI Etot Eaux Epa r Quse SPF Solar Fraction % % 180 7% % % % % % % % % 284 3% % % % % 259-6% % % % 402 1% % % % % 385-3% % Figuur 4: Effect van veranderend collectoroppervlakte op de prestaties van SYS-COMBI 13
139 IWT-TETRA : Zongekoppelde Warmtepompsystemen Eindverslag: Werkpakket 4: Modellering geselecteerde systeemconfiguratie Auteurs: Leen Goovaerts, Dries Van Aken, Jan Verheyen, John Veeken, Maarten Sourbron Invloed buffervolume SYS-REF Invloed Etot Eaux Epar Quse SPF opslagvolume SYS- REF REF % % % REF REF % 860-2% % REF % % 199 2% REF REF % % 194-1% REF % % 240 1% REF REF % % 238 0% Bij SYS-REF heeft de aanpassing van het buffervolume een impact, maar die invloed neemt af naarmate de woning slechter geïsoleerd is. Bij de SFH100 woning is er weinig verschil merkbaar. 14
140 IWT-TETRA : Zongekoppelde Warmtepompsystemen Eindverslag: Werkpakket 4: Modellering geselecteerde systeemconfiguratie Auteurs: Leen Goovaerts, Dries Van Aken, Jan Verheyen, John Veeken, Maarten Sourbron Invloed buffervolume SYS-COMBI Voor SYS-COMBI heeft het buffervolume weinig impact. Let wel op het feit dat enkel het SWWvolume aangepast wordt in deze parameteranalyse, en niet het RV-gedeelte. Invloed opslagvolume Etot Eaux Epar Quse SPF SYS-COMBI COMBI % % 168 0% COMBI COMBI % % 164-2% COMBI % % 274-1% COMBI COMBI % % 273-1% COMBI % % 398 0% COMBI COMBI % % 391-1%
141 IWT-TETRA : Zongekoppelde Warmtepompsystemen Eindverslag: Werkpakket 4: Modellering geselecteerde systeemconfiguratie Auteurs: Leen Goovaerts, Dries Van Aken, Jan Verheyen, John Veeken, Maarten Sourbron 3 Dimensioneringsrichtlijnen Voor de dimensioneringsrichtlijnen wordt verwezen naar het rapport van Werkpakket 6. Daar wordt in paragraaf 2 beschreven dat, volgens de bevindingen van dit project, een correcte zonwarmtepomp kan gedimensioneerd worden als: De warmtepomp gedimensioneerd wordt volgens de Code van Goede Praktijk voor Warmtepompen 4 De zonnecollectoren gedimensioneerd worden volgens de basisrichtlijnen van WTCB (TV 212) 5 In dit project zijn beide documenten gebruikt als ontwerprichtlijn en de parameteranalyse wijst uit dat voor de 4 geanalyseerde zonwarmtepompen dit een correct ontwerp oplevert. 4 ANRE; 2005; Code van goede praktijk voor de toepassing van warmtepompsystemen in de woningbouw; Ministerie van de Vlaamse Gemeenschap, afdeling natuurlijke rijkdommen en energie (ANRE); 2005; 5 WTCB; 1999; TV 212 leidraad voor de installatie van zonneboilers; Wetenschappelijk en Technisch Centrum voor het Bouwbedrijf; 2e uitgave; Brussel; juni 1999; 16
142 IWT-TETRA : Zongekoppelde Warmtepompsystemen Eindverslag: Werkpakket 4: Modellering geselecteerde systeemconfiguratie Auteurs: Leen Goovaerts, Dries Van Aken, Jan Verheyen, John Veeken, Maarten Sourbron 4 Bijlage 1: Gedetailleerde ontwerp-procedure voor de gesimuleerde zonwarmtepomp-installaties 17
143 WP4-attachement: detailed design procedure of solar-heatpump systems Table of content Vocabularium... 4 Introduction... 5 Objective... 5 Method... 5 Software... 5 System configurations... 5 Boundary conditions... 7 Climate... 7 Ground... 7 Buildings and space heating systems... 7 Domestic hot water Preliminary system sizing Introduction Boundary conditions DHW tank volume SH tank volume Thermal capacity of the heat pump HP Source side heat exchanger Solar thermal collector Pumps Controllers Varying Parameters Evaluation Results Preliminary sizing Influence of system configurations and buildings energy demand Influence of domestic hot water energy demand... Error! Bookmark not defined. Influence of DHW tank volume Influence of solar thermal collector area... 27
144 Influence of storage tank control and hydraulic configuration... Error! Bookmark not defined. Conclusions... Error! Bookmark not defined. References: Appendix A: Description of the reference components Heat Pumps Brine/Water Heat Pumps Air/Water Heat Pumps Ground heat exchanger Solar thermal collector Flat plate solar thermal collectors Vacuum tube solar thermal collectors Tank Geometry Materials, thickness and insulation Pumps Pipes Appendix B: Simplifications concerning the building input Appendix C: Pump sizing method Total flow rate HP secondary circuit HP primary circuit Solar circuit Regeneration circuit Pipe sections Total pressure loss Notes on the calculation of p tot Circuit system curve Pump selection Fluids... 43
145
146 Vocabularium Abbreviations A/W HP Air/water heat pump. BHE B/W HP DHW HP S SC SCFP SCVT SH SHP SPF SF Definitions Aerosol Borehole heat exchanger. Brine/water heat pump. Domestic hot water. Heat pump. Share. Solar thermal collectors. Flat plate solar thermal collectors. Vacuum tube solar thermal collectors. Space heating. Solar thermal and heat pump system. seasonal performance factor. solar fraction. a suspension of fine solid or liquid particles in a gas, such as air). Legionella Pneumophila Legionellosis Legionella pneumophila (Legionella after the legionnaires who were infected at the convention in Philadelphia in 1976, resulting in an outbreak of severe pneumonia among the participants of the American Legion that led to the term Legionnaires disease ; pneumophila meaning lungloving ) or briefly referred to as Legionella or L. Pneumophila; bacterium, belonging to the family Legionellaceae, that may cause legionellosis. [WHO; 2007] Legionellosis is a collection of infections that are caused by Legionella pneumophila and related Legionella bacteria. [WHO; 2007]
147 Introduction 40% of total energy consumption and 36% of total CO 2 emission of Europe is building related. The application of combined SHP systems for SH and DHW in residential buildings can contribute to the objectives regarding energy performance of buildings and the use of renewable energy sources aimed at in the European EPBD and RESD directives. A well designed and controlled application of a SHP system in the residential sector has various important advantages. These can briefly summarized all be framed within the following 4 improvements; an augmented seasonal performance factor by reaching higher solar fractions, a reduction of primary energy consumption and related CO 2 emission, an augmented share of energy from renewable energy sources and a reduction in peak electricity demand. This document presents simulation results of the project Zon Warm. The energy performance of combined SHP systems for residential applications in a Belgian context is compared for various system configurations and the influence of parameters on the energy performance is quantified. Various SME s, scientific, academic, non profit or sectorial and governmental organisations participate in the project consortium. The project is funded by IWT (Flemish Agency for Innovation by Science and Technology) together with the participating group of SME s. It is coordinated by THELES research group of KULeuven, Campus De Nayer. THELES has also participated in IEA SHC task 44 / annex 38 of the solar heating and cooling programme. It is briefly referred to as T44 in this text. More information on the project Zon Warm can be found at warm.lessius.eu/. More information on the project T44 can be found at shc.org/. Objective The objective of the simulation within project ZonWarm is the quantification of the influence of the size of components on the energy performance of different SHP systems, potentially interesting for residential applications in the Belgian context. Method The energy performance of SHP systems is quantified by simulation. The effect of selected parameters on various criteria regarding SHP system energy performance is analyzed and evaluated. In the following sections the method used in the simulation analysis is described. Software Polysun version 7.0 [Vela Solaris; 2014] is used. This is the most recent version at the time of the writing of this report (July 31, 2014). It is briefly referred to as Polysun in this text. System configurations The system configurations depicted as concepts of various combinations of components within SHP systems in the publication by Henning et al. [Henning et al.; 2008] numbers 1, 2 and 4 (numbering according to [Henning et al.; 2008]) are selected for the parameter analysis. Following figure gives an overview.

![Following figure gives an overview of these configurations. Figure: System configurations subjected to simulation analysis [Vela Solaris; 2014].](/docs-images/92/108577123/images/148-1.jpg "System configurations SYS 2 and SYS 4 are an interpretation of system configuration number 1 according to Henning, SYS 3 is an interpretation of")
148 Figure: overview of existing SHP system configurations; numbering according to original publication [Henning et al.; 2008] and selection for parameter analysis. Various interpretations of the selected configuration concepts are considered in the analysis. Following figure gives an overview of these configurations. Figure: System configurations subjected to simulation analysis [Vela Solaris; 2014]. System configurations SYS 2 and SYS 4 are an interpretation of system configuration number 1 according to Henning, SYS 3 is an interpretation of system configuration number 2 according to
149 Henning and SYS 1 is an interpretation of system configuration number 4 according to Henning [Henning et al.; 2008]. A detailed description of the components applied in these configurations can be found in appendix A. Note: it is possible that not all controllers are visualized in the figure. A detailed description of the controllers is given in the section on controllers. Boundary conditions Climate The climatic conditions used for the simulations are taken from the Polysun database for Brussels, Belgium. Ground The characteristics of the ground, considered representative for the Belgian context and used as boundary condition for the simulations of SHP systems are adopted from T44 [Haller et al.; 2013] and Geotrainet [McCorry et al.; 2011]. Soil warming (average difference between the earth surface temperature and the air temperature): 0.8 C Axial temperature gradient: 0.03 K/m [McCorry et al.; 2011] number of earth layers: 1 density of earth layer material: 2500 kg/m³ specific heat capacity of earth layer material: 800 J/(kgK) thermal conductivity of earth layer material: 2 W/(mK) thickness of earth layer 1: 400 m Buildings and space heating systems Buildings The reference buildings used as boundary conditions for the simulations of SHP systems are all single family houses; SFH015, SFH045 and SFH100 and are adopted from T44 [Dott et al.; 2013]. SFH15 represents an actual building according to passive house requirements. SFH45 represents a building of which the elements are constructed, such that they are oriented at actual legal requirements or represent a renovated building with good thermal quality of the building envelope. SFH100 represents a non renovated existing building. [Dott et al.; 2013] The numbers in the name of the buildings refer to the annual specific net energy demand for space heating in Strasbourg climate. Simulation shows that in Belgian climate (location Brussels, taken from Polysun database) SFH015, SFH045 and SFH100 require a yearly specific net energy demand for space heating of respectively 16, 50 and 150 kwh/m². These values were obtained using the detailed building input module in Polysun for Brussels climate selected from the Polysun database. The net floor area is 140m² (sum of first and second floor) and the inner volume is m³. The geometrical and physical parameters related to energy performance are summarized in following figure and table. The characteristics included under title T44 refer to the original buildings according to T44. A complete description of the buildings can be found in the original publication [Dott et al.; 2013]. The characteristics included under title ZonWarm refer to the input in Polysun. The
150 differences can be attributed to the simplifications as a result of the limitations of the Polysun software. A description of these simplifications is given in appendix B. N Figure: view of the buildings showing South and West facades [Dott et al.; 2013].
151 T44 ZonWarm SFH015 SFH045 SFH100 SFH015 SFH045 SFH100 Length building, external [m] Width building, external [m] Height building, external [m] n.a. n.a. n.a Length building, internal [m] Width building, internal [m] Height building, internal [m] n.a. n.a. n.a A floor, tot, net [m²] V internal [m³] A T [m²] U m, building [W/(m²K)] U tot, window [W/(m²K)] g window [-] R window-wall [%] South* R window-wall [%] West* R window-wall [%] East* R window-wall [%] North* Internal heat gain [W] ACH ventilation&in-exfiltration [h -1 ] eventilation heat recovery [%] Specific heating power demand [W/m²] Total thermal capacity of building [kj/k] A floor, tot, net Total net floor area of the building (ground floor and first floor, excluding external walls, including internal walls) [m²] ACH ventilation&in-exfiltration Air change rate for ventilation and in- and exfiltration [h -1 ] A T Total transmission heat loss area of the building envelope [m²] e ventilation heat recovery Effectiveness of the heat recovery unit for ventilation [%] g window Solar factor for solar energy transmittance through the window [-] Internal heat gain R window-wall orientation Specific heating power demand Total thermal capacity of building U m, building U tot, window V internal Internal heat gain (attributable to equipment and people) [W] Window to wall area ratio for the indicated orientation (walls only, here in relation to the outside dimensions*) [%] Design heat load for Belgian climate expressed per unit of net floor area (calculation according to CEN for ZonWarm) [W/m²] Thermal capacity of the whole building [kj/k] Average heat transfer coefficient of the building [W/(m²K)] Total heat transfer coefficient of the window [W/(m²K)] Internal volume (volume of the building excl. external walls, incl. internal walls) [m³] * Note: The window to wall area ratio is given in relation to the inside dimensions in the original publication [Dott et al.; 2013] Table: geometrical characteristics and characteristics related to building physics of the buildings used in T44 [Dott et al.; 2013] and in project ZonWarm. Space heating system of the buildings For SFH100 a radiator heating system is used according to T44 reference building description [Dott et al.; 2013]. For SFH045 and SFH015 a floor heating system is used according to T44 reference building description [Dott et al.; 2013]. In this reference building description it is suggested to simulate the floor heating emission system in a simplified approach using a radiator with radiator exponent set to
152 1.1 and a raised thermal capacity of the radiator of 40000kJ/K and omitting the ground floor thermal capacity in the building model. Because Polysun does not allow accounting for thermal inertia in the heating emission system (except for the heat transferring fluid in the emission system itself), a floor heating system without thermal inertia was inserted. The thermal capacity of the ground floor construction is included in the calculation of the thermal capacity of the building. The setpoint temperature for heating is 20 C. No nighttime temperature reduction is applied. The design heat load is calculated according to European standard EN12831 [CEN; 2003] using external dimensions of the building. It is assumed that the distance between the ground floor slab and the water table is more than 1m and no heating up capacity is included. The annual mean external temperature of Belgium (used for the calculation of the transmission losses through the ground floor) is calculated as the average of hourly values from the reference year file containing weather data taken from TRNSYS file BE-Uccle tm2; (yearly average ambient air temperature=9.732 C). The design heat load of the cases SFH015, SFH045 and SFH100 is then respectively: 2840, 4780 and 8868W for the Belgian climate. The design power of the heating emission system is taken to be equal to 1.3 times the design heat load. Following table shows a summary of the characteristics of the buildings regarding the heating system used in the Polysun simulations. Q loc,be Table: Building and heating emission system characteristics. The values of the annual specific net energy demand for space heating were obtained by simulation of a space heating system (with a gas boiler production unit) in Polysun. Domestic hot water Q heating system Q loc,spec,be Q heating module Q dem,spec [kwh/m²] detailed input Q dem,spec [kwh/m²] max. power number of heating modules building code [Dott et al.; 2013] [W] [W] [W/m²] [W] [ C] [ C] flow rate [l/h] SFH SFH SFH Q loc,be Design heat load of the building [W], calculated according to EN [CEN; 2003] Q loc,spec,be Q heating module Q dem,spec T inlet T outlet Design heat load of the building [W/m²], calculated according to EN [CEN; 2003] and expressed per unit of floor area Power of the heating emission system module [W] Annual specific net energy demand for space heating (simulation using detailed building input or based on maximum power input) Inlet temperature of the heating emission system [ C] Outlet temperature of the heating emission system [ C] DHW demand profile The profile for domestic hot water demand (DHW) is adopted from T44 (appendix C, table 7 of the original document [Haller et al.; 2013]). This hot water draw-off profile is based on an average drawoff of 140 liter per day at 45 C (cold water 10 C) or kwh per day (2133 kwh per year). This energy corresponds with 100 liter per day at 60 C for a cold water supply of 10 C. The latter draw-off is considered as an average for a single family [Haller et al.; 2013]. T inlet T outlet
153 Power [kw] The profile is translated to a suitable format for input in Polysun. The original profile is shown in the following table. Legend: S=Small; Sh=Shower; FC=Floor cleaning; DW= Dish washing; HC=Household cleaning; Ba=Bath tub. Sunday only; bath tub replaces evening shower; Table: DHW profile [Haller et al.; 2013] T44/A38 domestic hot water weekday profile Time [s]
154 Energy [kwh] Power [kw] T44/A38 domestic hot water sunday profile Time [s] Figure: Power profile requested for instantaneous provision of domestic hot water weekday (above), sunday (mid) profile of the previous table. T44/A38 domestic hot water week profile Time [s] Figure: Energy needed for the provision of domestic hot water week profile of the previous table. The Sunday bath does not require additional power for instantaneous provision of the draw off energy profile in comparison to the daily evening shower; the draw-off requires more time at equal flow rate and temperature. Limitations to the use of Polysun in regard to DHW input include following aspects; only one value can be chosen for the temperature of the DHW draw-off. Each draw-off is released instantaneous at the beginning of the respective timestep and the nominal flow rate is calculated automatically. Following steps were performed: 1) The energy of the original DHW profile is recalculated, taking the site-specific average cold water supply temperature. The site specific cold water temperature is assumed to be equal to the average ambient temperature of Belgium (the average of hourly values from the reference year file containing weather data taken from TRNSYS file BE-Uccle tm2; (yearly average Tamb=9.732 C). More information on the recalculation of this amount of energy can be found in the original publication of T44 [Haller et al.; 2013]. 2) The temperature of the hot water draw-off is set at a fixed value equal to the maximum temperature occurring in the draw-off profile. This temperature is the constant temperature
155 of all the hot water draw-off and is equal to 55 C. For the lower values then the value for the fixed temperature (from start of step 2) occuring in the original DHW profile, the energy remains unaltered. (The resulting time of draw off at the same flow rate will be lower.) 3) A yearly file is composed. It is assumed the first day of the year is a Monday. The variation of the hot water demand over the year (for various reasons; see T44/A38 [Haller et al.; 2013]) is taken into account by variation of each tapping energy with the day of year by a sine function with amplitude of 20%. The positive peak occurs on February 9. More information on the calculation of this variation and the ratio behind it can be found in the original publication of T44 [Haller et al.; 2013]. Note: the daily average energy consumption over the year is not exactly equal to the daily average energy consumption over the week because one year consists of 52 weeks and one Monday. Household composition and distribution. The average household size is 2.3 for Belgium and 2.4 for the European Union (27 countries; including new member states), 2.3 for European Union (15 countries; excluding new member states) and 2.3 for Euro area (17 countries). (All data are taken from EUROSTAT, year=2010.) The data for Belgium are retained for further analysis. It is assumed that household composition does not influence the average amount of hot water draw-off per person, meaning that the average DHW profile of a one-person single family household is a factor 2.3 times smaller than the average. The following table and figure shows the evolution of the distribution of households by household size in Belgium in past years from 2004 to year #persons Table 2: Evolution of distribution of households by household size in Belgium (data: EUROSTAT) Te average of the table is 2.3 assumed that for the category 6, the average number < 8.5.
156 Distribution of households by household size frequency [%] number of persons per household Figure: Evolution of household size in Belgium (data: Eurostat) The figure shows a slight increase in one-person single family households. The average frequency of the 5 persons single family households over the considered period of time is 5.4%. It can be concluded that a 5 person single family household can be considered as a case to consider as the boundary of what a normal DHW heating plant should be able to manage. Starting from the original DHW profile and considering all parameters fixed except the mass flow rates for all the tappings, the average amount of energy needed per day then becomes kwh and kWh for the cases of a one-person and a 5 person single family household respectively. DHW cases Following table gives an overview of the various DHW demand profiles
157 daily amount [l/d] amplitude summer/winter rate of E_T44*** Table: Domestic hot water draw-off profile cases considered in the Zon-Warm project. V [m³/a] (excl. BU heater) DHW profile name T DHW,draw-off [ C]* E avg,day [kwh/d]** SHP_DHW_40_ %/+20% 100% SHP_DHW_45_ %/+20% 100% SHP_DHW_50_ %/+20% 100% SHP_DHW_55_ %/+20% 100% SHP_DHW_60_ %/+20% 100% SHP_DHW_45_ %/+20% 43% SHP_DHW_55_ %/+20% 43% SHP_DHW_45_ %/+20% 87% SHP_DHW_55_ %/+20% 87% SHP_DHW_45_ %/+20% 130% SHP_DHW_55_ %/+20% 130% SHP_DHW_45_ %/+20% 174% SHP_DHW_55_ %/+20% 174% SHP_DHW_45_ %/+20% 217% SHP_DHW_55_ %/+20% 217% Legend: *T DHW,draw-off Fixed temperature of domestic hot water supply provided by the solar heat pump system [ C]. For legionella prevention, daily amount E avg, day the hot water tank additionaly is heated to 60 C once a week; thermal benefits for draw-offs and energy use are not included. Average daily volume of domestic hot water draw-off if it were supplied at the fixed temperature TDHW, draw-off, and a cold water supply temperature of 10 C [l/d] Average daily energy of domestic hot water draw-off if it were supplied at the fixed temperature TDHW, draw-off, and a cold water supply temperature of 10 C [kwh/d]. ** Part of this energy is delivered via electrical backup heater to reach the minimum temperature as set by T44/A38 [Haller et al.; 2013] for some tappings. amplitude summer/winter Amplitude of the sine-curve for the variation of the DHW energy demand [%]. ***rate of E_T44: green color, bold red color, underlined Rate of energy of domestic hot water draw-off if it were supplied at the fixed temperature TDHW, draw-off, and a cold water supply temperature of 10 C, compared to the energy of DHW draw-off specified by T44/A38 [%]. 43% corresponds to a one-person single family household (assumption average number of persons per household=2.3). 87% corresponds to a two-persons single family household (assumption average number of persons per household=2.3). 100% corresponds to an average single family household according to T44/A38 [Haller et al.; 2013]. 130% corresponds to a tree-persons single family household (assumption average number of persons per household=2.3). 174% corresponds to afour-persons single family household (assumption average number of persons per household=2.3). 217% corresponds to a five-persons single family household (assumption average number of persons per household=2.3). Reference profiles. Parameters defining the deviation of the specific DHW profile in comparison to the reference profiles. When the minimum temperature of the case (specified by column with header TDHW, draw-off) is lower than the minimum temperature indicated in the T44 DHW profile, part of the energy to reach the minimum temperature indicated in the T44 DHW profile is delivered by a backup-heater. A recalculation is performed so that the daily average over the year (Eavg,day) for a cold water supply of 10 C matches the total energy needed to provide the rate of E_T44. The final resulting DHW load files are however constructed for the local cold water supply of C.
158 Total energy (excl. penalty) [kwh/week] Total energy (incl. penalty) [kwh/week] Following figure gives an overview of the weekly total energy for all the DHW cases DHW draw-off profiles Week SHP_DHW_40_100_var20 SHP_DHW_45_100_var20 SHP_DHW_50_100_var20 SHP_DHW_55_100_var20 SHP_DHW_60_100_var20 SHP_DHW_45_43_var20 SHP_DHW_55_43_var20 SHP_DHW_45_87_var20 SHP_DHW_55_87_var20 SHP_DHW_45_130_var20 SHP_DHW_55_130_var20 SHP_DHW_45_174_var20 SHP_DHW_55_174_var20 SHP_DHW_45_217_var20 SHP_DHW_55_217_var20 Figure: DHW weekly total energy (including backup heater with the use of the penalty factor of 1.5) over the year for all DHW profile cases as described in the previous table 3. Following figure gives the same information as the previous figure, but excluding the use of the penalty factor for the backup heater DHW draw-off profiles Week SHP_DHW_40_100_var20 SHP_DHW_45_100_var20 SHP_DHW_50_100_var20 SHP_DHW_55_100_var20 SHP_DHW_60_100_var20 SHP_DHW_45_43_var20 SHP_DHW_55_43_var20 SHP_DHW_45_87_var20 SHP_DHW_55_87_var20 SHP_DHW_45_130_var20 SHP_DHW_55_130_var20 SHP_DHW_45_174_var20 SHP_DHW_55_174_var20 SHP_DHW_45_217_var20 SHP_DHW_55_217_var20 Figure: DHW weekly total energy (including backup heater) excluding the penalty factor over the year for all DHW profile cases as described in the previous table. Legionella and SHP systems in a residential context The information in this section is selected focusing on influencing parameters and guidelines for the prevention of legionella and on legislative prescriptions for Flanders, Belgium.
159 Risk factors [WHO; 2007] Hot and cold water systems in private residences are known sources of Legionella. Low numbers of legionellosis disease outbreaks over prolonged periods have been recorded in relation to such systems worldwide. Proximity to the source is a risk factor and infection may be acquired by inhalation of contaminated aerosol. Risk factors for the growth and proliferation of legionella in hot and cold water systems include complex water systems, the presence of other microorganisms, scale and corrosion, long pipe runs, poor temperature control and low flow rates or stagnation. The optimal temperature range for Legionella is C. Growth decreases at temperatures above C. At 50 C the time required to kill 90% of population of L. Pneumophila is 80 to 124 minutes and at 60 C 2 minutes. As the temperature falls below 37 C, the bacteria s reproductive rate decreases and there is little or no increase in numbers of bacteria below 20 C. To prevent Legionella infection, the recommended temperature for storage and distribution of cold water is below 25 C, and ideally below 20 C. The bacteria may however grow below 20 C under certain conditions. Legionella will survive for long periods at low temperatures and then proliferate when the temperature increases, if other conditions allow. The presence of other microorganisms (e.g. that serve as nutrients), sodium concentrations, the composition and formation of biofilms (making the effect of biocides less effective) promote the growth of legionella if other conditions also are favorable. Scale and corrosion, stagnation or lowflow increase the formation of biofilms and sediment. Temperature control, temperature extremes, UV light, low humidity, biocide are common treatments to prevent legionella. WTCB [WTCB; 2007] advices to produce the DHW at a minimum temperature level of 60 C and maintain a minimum temperature level of 55 C throughout the whole installation. This corresponds with the best available techniques described below in this document in the section Best available techniques. Cold water should be maintained at a temperature level below 20 C to inhibit growth of legionella [WTCB; 2007]. Legionella legislation The legislation in Flanders, Belgium concerning prevention of legionella is prescribed in the directive on the prevention of legionella ( legionellabesluit in Dutch) [Vervotte; 2007]. The scope of application of this legislation only includes publically accessible buildings. Publically accessibility in this context means but is not limited to the provision of services to the public, including for instance offering food or drinks for consumption. The scope of the project ZonWarm is limited to small-scale residential buildings; houses and apartments. In the majority of this type of buildings no services are provided to the public. In the case sensitive people reside in a publically accessible residential building, prescriptions categorized for high risk facilities apply. Also, in the case DHW in a publically accessible residential building is produced collectively, meaning at least 15 people excluding employees are potentially exposed, prescriptions categorized for moderate risk facilities apply. The fact that legislative prescriptions from the directive on legionella [Vervotte; 2007] do not apply for most of the single family houses, does not mean the design and operation of sanitary systems
160 should not be executed with the greatest care concerning the prevention of legionella. The measures included in the study on best available techniques for the prevention of legionella by VITO [VITO; 2007] can serve as guidelines. Best available techniques [VITO; 2007] The best available techniques aim at prevention or reduction of growth and development of legionella by temperature control, adequate flow-through and inhibition of growth of biofilms. The techniques include measures for the control and use of the system while in operation as well as sizing prescriptions. Only the measures regarding temperature control are adopted in the current report. The guidelines contain following prescriptions concerning temperature control: Limit the cold water temperature level to beneath 25 C an avoid warming, certainly in the case the water temperature can be greater than 25 C at the meter. In high risk facilities: the hot water temperatures in the production system should be at least 60 C; the complete storage tank volume should be heated to a temperature level of at least 60 C during 1 hour every 24 hour period; the hot water should enter the distribution system at a temperature level of at least 60 C and should nowhere be below 55 C; the installation should allow the production of hot water at each tapping point at a temperature level of 70 C. In moderate risk facilities: the hot water temperatures in the production system should be at least 60 C; the complete storage tank volume should be heated to a temperature level of at least 60 C during 1 hour every week; the hot water should enter the distribution system at a temperature level of at least 60 C and should nowhere be below 55 C unless pipes are limited to a length of maximum 5 meter or a content volume of maximum 3l; the installation should allow the production of hot water at each tapping point at a temperature level of 70 C. Apart from these measures, numerous other measures are included in the original publication [VITO; 2007] concerning initial water quality, the design of water systems for human consumption and the Construction, maintenance and operation of sanitary systems. The reader is referred to the original publication for further information [VITO; 2007]. Preliminary system sizing Introduction The sizing method described in this document is established for various configurations of SHP systems. These systems are designed to cover the demand for SH and the production of DHW. The methods for system sizing are based on the methods described in [ANRE; 2005] and [WTCB; 1999]. The sizing method is applied for all reference cases. These cases form the basis for the variation in parameters to enable quantification of the influence of these parameters on the energy performance. Boundary conditions For the sizing of the thermal capacity of the heat pump (HP), the design heat load of the building and the maximum of the daily DHW draw-off volume are calculated in a preliminary step. A) The design heat load of the building is calculated according to EN12831 [CEN; 2003] using external dimensions of the building. Further details on the calculation of the design heat load
161 can be found in subsection Buildings and space heating systems of the section Boundary conditions. The design heat load of the cases SFH015, SFH045 and SFH100 is then respectively: 2840, 4780 and 8868W for the Belgian climate. B) The maximum of the daily DHW draw-off volume is defined by the DHW profile as specified in the frame of T44 [Haller et al.; 2013], further referred to as 100%T44. This DHW profile specification contains timing, volume and temperature of the individual draw-off tappings at temperatures of 45 C and 55 C for an average single family household. Further information on the DHW profile can be found in the subsection Domestic hot water of the section Boundary conditions. DHW tank volume The maximum daily DHW-draw-off volume is expressed at a temperature equal to the maximum temperature in the draw-off profile, here 55 C. This is the basis for the DHW tank sizing. Translated to a temperature of 55 C, the 100%T44 DHW profile results in a maximum of the daily DHW draw-off volume of 176.5l. An additional 40 l (to account for incidental peak consumption) is added and the result is multiplied by a factor of 1.2 (to account for tank stratification) [ANRE; 2005]. This results in a DHW tank volume of 260l (at a temperature of 55 C). V DHW, tank = (V DHW,daily,max + V add ) * f In which: f = factor (to take tank stratification into account) [-] = 1.2 V add = additional volume to be added (to account for incidental peak consumption) [m³] = V DHW,daily,max = yearly maximum value of daily DHW draw-off volume to be specified at 55 C (maximum temperature of draw-offs in T44 DHW profile) [m³] = volume of the DHW tank [m³] V DHW, tank SH tank volume If a SH tank is part of the SHP system configuration, the SH tank volume for storage of SH energy is sized to allow storing of SH peak energy demand during a minimum off-time of the production system of 10 minutes. The volume of water is calculated from the energy of the design heat load during this off-time, for a temperature difference equal to the design heating regime of the SH system. This results in 82l, 137l and 128l for the SFH015, SFH045 and SFH100 respectively in Belgian climate. (The design heat load of SFH015, SFH045 and SFH100 equals 2840W, 4780W and 8868W respectively according to EN [CEN; 2003]). In the case a combined tank is present, the sizing rules remain the same but the SH (part of the) tank volume is considered cumulative to the DHW tank volume. The only system for which this cumulative approach is relevant is system number 4 (original numbering according to [Henning et al.; 2008], our SYS1). It contains a stratified storage buffer for SH and DHW. When varying the DHW tank volume during the parameter analysis, the variation is only applied on the DHW part of the volume. Thermal capacity of the heat pump The SHP system consists of a HP, a DHW tank and SC. For the sizing of the HP, the SC are not taken into account [ANRE; 2005]. The thermal capacity (; power on the condenser side) of the HP for SH are determined according to [ANRE; 2005]. The system does not contain a Backup-heater. This is not in
162 correspondence with [ANRE; 2005]. In [ANRE; 2005] it is advised for systems requiring a thermal capacity smaller than 10kW to apply a mono-energetic system with a -factor of 0.6 [ANRE; 2005]. In the frame of project ZonWarm a -factor of 1.0 is aimed at for SH, which means no Backup-heater is applied. This corresponds to the advice given in the frame of project T44 in which the use of a backup heater is disencouraged. In the case of no nighttime reduction, (part of) the thermal capacity needed for the production of DHW should be added [ANRE; 2005]. It is not specified how to quantify this additional capacity. The capacity of the HP is calculated in the frame of the project ZonWarm in the following manner. The design rules for DHW system sizing are based on rules applied to systems with a 100% DHW storage. The time in which the DHW tank is to be heated is taken to be 4 hours. If the thermal capacity of the heat pump (which is equal to the design heat load) is insufficient to provide this heat within this timing, it is augmented accordingly. Following calculation steps describe the procedure to calculate the thermal capacity of the HP: a) Set aim (here aim =1.0) b) set the value for t DHW = 4 hours c) calculate V DHW,tank (see above) d) set T DHW, tank (here: T DHW, tank = T DHW, max ) e) calculate Q HP Q HP,DHW = V DHW,tank * w * c p,w * (T DHW,tank - T cw ) / (3600 * t DHW ) Q HP,SH = Q BUI,SH * aim Q HP is taken equal to the largest of Q HP,DHW and Q HP,SH Q HP = max(q HP,DHW ; Q HP,SH ) f) calculate res res = Q HP / Q BUI,SH In which: = Bèta-factor = ratio of thermal capacity of the heat pump to the required thermal capacity of the SHP system for SH [-]. The latter is taken equal to or greater than the design heat load. Here the thermal capacity of the HP is taken equal to the design heat load. aim = initial value for. res = value for corresponding with the calculated result for Q HP. Note: the resulting value res may be greater than the initial value aim. c p,w = specific heat of water [J/(kg.K)] =4187 Q BUI,SH = design heat load of the building [W] Q HP,SH = thermal capacity of the HP for SH [W] Q HP,DHW = thermal capacity of the HP for DHW [W] = thermal capacity of the HP [W] Q HP w = density of water [kg/m³]= 1000 t DHW = time available to heat V DHW,tank from T cw to T DHW,tank [h] T cw = temperature of the cold water supply [ C] (here: T cw = 10 C) T DHW, max = maximum temperature of all tappings in the DHW profile (in 100%T44 this is 55 C) T DHW, tank = setpoint temperature of the DHW tank. (Here it is taken equal to T DHW,max, provided that a cut-in temperature differential is applied, large enough to account for the thermal losses in between the tank and the draw-off locations.)
163 V DHW, tank = volume of the DHW tank [m³] HP Source side heat exchanger The required thermal capacity of the heat exchanger on the source side of the HP is calculated based on the thermal capacity of the HP using the COP of the HP. An optimistic value of the COP is taken to ensure not to undersize the BHE. Following table gives an overview of the optimistic values of COP to size the BHE. Q BHE =Q HP * (1-1/COP optimistic ) In which: Q BHE = thermal capacity of the borehole heat exchanger [W] Q HP = thermal capacity of the HP [W] COP optimistic = optimistically estimated value for the coefficient of performance [-] COP optimistic source of the heat pump T i [ C] groundwater ground air T i [ C] Inlet temperature of the heating system [ C] Table: optimistic COP to size the BHE [ANRE; 2005]. In the case a borehole ground heat exchanger (BHE) is used on the source side of the HP, the required thermal capacity of the BHE is translated to the required total length of the BHE using a rule of thumb of 50W/m [McCorry et al.; 2011] [CEN; 2007]. l BHE = Q BHE /q BHE in which: l BHE = length of the BHE [m] Q BHE = thermal capacity of the BHE [W] q BHE = average specific extraction heat flow rate [W/m] = 50 This corresponds with the specific extraction heat flow rate of normal underground and water saturated sediment for an operation period of the GHE loop of 2400 hours; see following table. For other ground quality choose an adequate specific extraction heat flow rate.
![Table: average specific extraction heat flow rate (q BHE ) of vertical ground heat exchangers (double U- tube) as function of the ground quality and operation period [CEN; 2007].](/docs-images/92/108577123/images/164-0.jpg "The long term effects of continuous heat extraction shall also be considered in the design of the BHE.")
164 Table: average specific extraction heat flow rate (q BHE ) of vertical ground heat exchangers (double U- tube) as function of the ground quality and operation period [CEN; 2007]. The long term effects of continuous heat extraction shall also be considered in the design of the BHE. The annual heat energy per meter borehole depth reflects these long-term effects and should be in between 100 and 150 kwh/(year.m) [CEN; 2007]. The indicator for these long term effects is calculated as follows; The simulation is performed after a preconditioning of 5 years of the BHE with a specific annual heat extraction rate of 100kWh/(m.a). The specific annual heat extraction rate of the consecutive simulation should be below 100 kwh/(m.a). If this is not the case, degradation of the ground as a result of the long-term relative high heat extraction is possible. This can be remedied by extending the size of the BHE. This sizing can be done by performing following consecutive simulation steps to ensure limiting the risk on long-term degradation of the ground; Step 1) Simulate the system while setting the preconditioning time for the ground equal to 5 years and the yearly specific ground energy yield to 100kWh/m. Step 2) Simulate the system while using the resulting yearly specific ground energy yield (obtained as a result of step 1) in the preconditioning (also set the preconditioning time at 5 years) and check the resulting yearly specific ground energy yield. The resulting yearly specific ground energy yield should be a) below 100kWh/m/year, b) within + or - 10% of the result obtained in step 1. If requirement a) is not met, augment the length of the BHE. If requirement b) is not met repeat step 2 while using the resulting yearly specific ground energy yield (obtained as a result of the previous step in the preconditioning (set the preconditioning time at 5 years)) and check the resulting yearly specific ground energy yield.
165 Solar thermal collector The solar thermal collector area is determined according to the rule of thumb described in TV 212 [WTCB; 1999] that links the volume of the storage to the area of the solar thermal collectors. It states that per unit of area of solar collector, a volume of the storage of 50l should be provided. Using this rule of thumb, starting from the DHW tank volume, sized in a previous step, the area of the solar thermal collectors can be calculated; A SC = V DHW,tank / v DHW,tank In which: A SC = area of the solar thermal collectors [m²] V DHW,tank = volume of the DHW tank [m³] v DHW,tank = specific volume of the tank (expressed per unit of collector area [m³/m²] = Pumps The pumps are chosen following a general method for pump sizing in which the operating point of each circuit is calculated from the required flow rate and the circuits pressure drop. This allows selection of a pump with a suitable performance curve enabling energy efficient operation for each of the circuits. The thermal properties of the fluids in the circuits are taken into account. A detailed description of the method to select the pumps is described in appendix C. Controllers See paper: J. Veeken*, J. Verheyen, M. Sourbron (2014), Impact of storage tank control and hydraulic configuration on solar heat pump performance, 9th International Conference on System Simulation in Buildings (SSB2014), December 10-12, 2014, Liège, Belgium Both DHW storage volume and SH storage volume are controlled with two temperature sensors, in the upper and lower layer of the respective storage volume. A heating curve control is applied to determine the heating supply set point. The DHW setpoint is determined by the draw-off profile. Varying Parameters Apart from the boundary conditions (buildings, domestic hot water demand profiles, climatic conditions and ground characteristics) domestic hot water tank volume and solar thermal collector gross area are varied. Following table gives an overview of the system configuration variants regarding component type and size considered in the simulations.
166 simulation code System Building A sc Flat plate / Vacuum Tube SC V DHW,tank HP SYS1_BXL_SFH015_EDHW100_AFP100_VDHW100_b100 1 SFH015 REF FP REF B/W SYS2_BXL_SFH015_EDHW100_AFP100_VDHW100_b100 2 SFH015 REF FP REF B/W SYS3_BXL_SFH015_EDHW100_AFP100_VDHW100_b100 3 SFH015 REF FP REF B/W SYS4_BXL_SFH015_EDHW100_AFP100_VDHW100_b100_BWHP 4 SFH015 REF FP REF B/W SYS4_BXL_SFH015_EDHW100_AFP100_VDHW100_b100_AWHP 4 SFH015 REF FP REF A/W SYS1_BXL_SFH015_EDHW100_AFP050_VDHW100_b100 1 SFH015 50% FP REF B/W SYS1_BXL_SFH015_EDHW100_AFP200_VDHW100_b100 1 SFH % FP REF B/W SYS2_BXL_SFH015_EDHW100_AFP050_VDHW100_b100 2 SFH015 50% FP REF B/W SYS2_BXL_SFH015_EDHW100_AFP200_VDHW100_b100 2 SFH % FP REF B/W SYS3_BXL_SFH015_EDHW100_AFP050_VDHW100_b100 3 SFH015 50% FP REF B/W SYS3_BXL_SFH015_EDHW100_AFP200_VDHW100_b100 3 SFH % FP REF B/W SYS4_BXL_SFH015_EDHW100_AFP050_VDHW100_b100 4 SFH015 50% FP REF B/W SYS4_BXL_SFH015_EDHW100_AFP200_VDHW100_b100 4 SFH % FP REF B/W SYS1_BXL_SFH015_EDHW100_AFP100_VDHW050_b100 1 SFH015 REF FP 50% B/W SYS1_BXL_SFH015_EDHW100_AFP100_VDHW150_b100 1 SFH015 REF FP 150% B/W SYS2_BXL_SFH015_EDHW100_AFP100_VDHW050_b100 2 SFH015 REF FP 50% B/W SYS2_BXL_SFH015_EDHW100_AFP100_VDHW150_b100 2 SFH015 REF FP 150% B/W SYS3_BXL_SFH015_EDHW100_AFP100_VDHW050_b100 3 SFH015 REF FP 50% B/W SYS3_BXL_SFH015_EDHW100_AFP100_VDHW150_b100 3 SFH015 REF FP 150% B/W SYS4_BXL_SFH015_EDHW100_AFP100_VDHW050_b100 4 SFH015 REF FP 50% B/W SYS4_BXL_SFH015_EDHW100_AFP100_VDHW150_b100 4 SFH015 REF FP 150% B/W SYS1_BXL_SFH045_EDHW100_AFP100_VDHW100_b100 1 SFH045 REF FP REF B/W SYS2_BXL_SFH045_EDHW100_AFP100_VDHW100_b100 2 SFH045 REF FP REF B/W SYS3_BXL_SFH045_EDHW100_AFP100_VDHW100_b100 3 SFH045 REF FP REF B/W SYS4_BXL_SFH045_EDHW100_AFP100_VDHW100_b100_BWHP 4 SFH045 REF FP REF B/W SYS4_BXL_SFH045_EDHW100_AFP100_VDHW100_b100_AWHP 4 SFH045 REF FP REF A/W SYS1_BXL_SFH045_EDHW100_AFP050_VDHW100_b100 1 SFH045 50% FP REF B/W SYS1_BXL_SFH045_EDHW100_AFP200_VDHW100_b100 1 SFH % FP REF B/W SYS2_BXL_SFH045_EDHW100_AFP050_VDHW100_b100 2 SFH045 50% FP REF B/W SYS2_BXL_SFH045_EDHW100_AFP200_VDHW100_b100 2 SFH % FP REF B/W SYS3_BXL_SFH045_EDHW100_AFP050_VDHW100_b100 3 SFH045 50% FP REF B/W SYS3_BXL_SFH045_EDHW100_AFP200_VDHW100_b100 3 SFH % FP REF B/W SYS4_BXL_SFH045_EDHW100_AFP050_VDHW100_b100 4 SFH045 50% FP REF B/W SYS4_BXL_SFH045_EDHW100_AFP200_VDHW100_b100 4 SFH % FP REF B/W SYS1_BXL_SFH045_EDHW100_AFP100_VDHW050_b100 1 SFH045 REF FP 50% B/W SYS1_BXL_SFH045_EDHW100_AFP100_VDHW150_b100 1 SFH045 REF FP 150% B/W SYS2_BXL_SFH045_EDHW100_AFP100_VDHW050_b100 2 SFH045 REF FP 50% B/W SYS2_BXL_SFH045_EDHW100_AFP100_VDHW150_b100 2 SFH045 REF FP 150% B/W SYS3_BXL_SFH045_EDHW100_AFP100_VDHW050_b100 3 SFH045 REF FP 50% B/W SYS3_BXL_SFH045_EDHW100_AFP100_VDHW150_b100 3 SFH045 REF FP 150% B/W SYS4_BXL_SFH045_EDHW100_AFP100_VDHW050_b100 4 SFH045 REF FP 50% B/W SYS4_BXL_SFH045_EDHW100_AFP100_VDHW150_b100 4 SFH045 REF FP 150% B/W SYS1_BXL_SFH045_EDHW100_AVT100_VDHW100_b100 1 SFH045 REF VT REF B/W SYS2_BXL_SFH045_EDHW100_AVT100_VDHW100_b100 2 SFH045 REF VT REF B/W SYS3_BXL_SFH045_EDHW100_AVT100_VDHW100_b100 3 SFH045 REF VT REF B/W SYS4_BXL_SFH045_EDHW100_AVT100_VDHW100_b100 4 SFH045 REF VT REF B/W SYS1_BXL_SFH100_EDHW100_AFP100_VDHW100_b100 1 SFH100 REF FP REF B/W SYS2_BXL_SFH100_EDHW100_AFP100_VDHW100_b100 2 SFH100 REF FP REF B/W SYS3_BXL_SFH100_EDHW100_AFP100_VDHW100_b100 3 SFH100 REF FP REF B/W SYS4_BXL_SFH100_EDHW100_AFP100_VDHW100_b100_BWHP 4 SFH100 REF FP REF B/W SYS4_BXL_SFH100_EDHW100_AFP100_VDHW100_b100_AWHP 4 SFH100 REF FP REF A/W SYS1_BXL_SFH100_EDHW100_AFP050_VDHW100_b100 1 SFH100 50% FP REF B/W SYS1_BXL_SFH100_EDHW100_AFP200_VDHW100_b100 1 SFH % FP REF B/W SYS2_BXL_SFH100_EDHW100_AFP050_VDHW100_b100 2 SFH100 50% FP REF B/W SYS2_BXL_SFH100_EDHW100_AFP200_VDHW100_b100 2 SFH % FP REF B/W SYS3_BXL_SFH100_EDHW100_AFP050_VDHW100_b100 3 SFH100 50% FP REF B/W SYS3_BXL_SFH100_EDHW100_AFP200_VDHW100_b100 3 SFH % FP REF B/W SYS4_BXL_SFH100_EDHW100_AFP050_VDHW100_b100 4 SFH100 50% FP REF B/W SYS4_BXL_SFH100_EDHW100_AFP200_VDHW100_b100 4 SFH % FP REF B/W SYS1_BXL_SFH100_EDHW100_AFP100_VDHW050_b100 1 SFH100 REF FP 50% B/W SYS1_BXL_SFH100_EDHW100_AFP100_VDHW150_b100 1 SFH100 REF FP 150% B/W SYS2_BXL_SFH100_EDHW100_AFP100_VDHW050_b100 2 SFH100 REF FP 50% B/W SYS2_BXL_SFH100_EDHW100_AFP100_VDHW150_b100 2 SFH100 REF FP 150% B/W SYS3_BXL_SFH100_EDHW100_AFP100_VDHW050_b100 3 SFH100 REF FP 50% B/W SYS3_BXL_SFH100_EDHW100_AFP100_VDHW150_b100 3 SFH100 REF FP 150% B/W SYS4_BXL_SFH100_EDHW100_AFP100_VDHW050_b100 4 SFH100 REF FP 50% B/W SYS4_BXL_SFH100_EDHW100_AFP100_VDHW150_b100 4 SFH100 REF FP 150% B/W Table: Variants regarding components and components size considered in the simulation analysis.
167 To gain insight in the robustness of system performance under varying circumstances, the domestic hot water energy demand profile is varied for a selection of the system configurations. The system sizing is not adapted accordingly. The systems are sized for 100%T44 profile. Only B/W heat pumps, flat plate solar thermal collectors and SFH015 building are considered. Following table gives an overview of the variants regarding domestic hot water energy demand profile for a selection of the system configurations considered in the simulation analysis. simulation code System T DHW,tank,set [ C] SHP1_DHW_40_ SHP1_DHW_45_ SHP1_DHW_50_ SHP1_DHW_55_ SHP1_DHW_60_ SHP1_DHW_45_ SHP1_DHW_55_ SHP1_DHW_45_ SHP1_DHW_55_ SHP1_DHW_45_ SHP1_DHW_55_ SHP1_DHW_45_ SHP1_DHW_55_ SHP1_DHW_45_ SHP1_DHW_55_ SHP2_DHW_40_ SHP2_DHW_45_ SHP2_DHW_50_ SHP2_DHW_55_ SHP2_DHW_60_ SHP2_DHW_45_ SHP2_DHW_55_ SHP2_DHW_45_ SHP2_DHW_55_ SHP2_DHW_45_ SHP2_DHW_55_ SHP2_DHW_45_ SHP2_DHW_55_ SHP2_DHW_45_ SHP2_DHW_55_ DHW energy demand %T44 Table: variants regarding domestic hot water energy demand profile. Evaluation Energy performance indicators; SPF, SPF of components, Share of SC and HP, are calculated according to the same principles as used in the evaluation of the in-situ measurements. Results Preliminary sizing A preliminary sizing is executed to determine the size of the components of all the system configurations. Based on these reference values, the size of the components of the variants are calculated. Following table gives an overview of the preliminary sizing results.
168 Building SFH015 SFH045 SFH100 DHW profile %T44 [%] T DHW,tank [ C] Q BUI,SH [W] V SH,tank* [l] Q DHW [W] V DHW,tank* [l] t DHW [h] Q HP * [W] res [-] l BHE [m] A SC [m] Flat plate 100% A SC [m] Vacuum tube 100% * Results are rounded to above to the nearest integer (except res which is rounded to the nearest second decimal and except ASC which is rounded to above to the nearest decimal) Table: preliminary sizing results. The factor res is greater than 1 because DHW demand is determining for the sizing of the HP. The results of the pump sizing (total circuit pressure loss, flow rate to be handled and pump choice) can be found in the original Polysun file. All pumps are of type ZW_Pump_25-30 except the pumps on the secondary side of the HP of system 2 and system 3 and the pump of the space heating circuit of system 1 and system 4. Influence of system configurations and buildings energy demand For SFH015 SPF of the SPF of system 1, 2, 3 and 4 is respectively 3.40, 4.25, 3.71 and For SFH015 system 2 and 4 perform best. Remarkably these are the systems that do not apply part of the solar thermal yield for space heating. It seems appropriate to keep the installation as simple as possible. This is also corresponding to the low energy demand of this type of building, in which the question of augmented cost versus energy performance improvement is relevant. It should be emphasized that improvements on the system sizing, hydraulics and control may influence the SPF and the ranking of the respective system configurations in view of their energy performance. Influence of DHW tank volume For SFH015, SPF increases with greater tank volume, but a stabilizing trend can be noticed for all system configurations. The influence of increasing tank volume neutralizes around 100%, indicating a fairly good tank volume sizing of the reference. This should be checked with other SFH. Following figure shows the influence of DHW tank volume on SPF for SFH015.
169 5 4 SFH015: Influence of DHW tank size on SPF 3 SPF [-] VDHW,tank 50% VDHW,tank 100% VDHW,tank 150% Volume of DHW tank (100%=260l) SYS 1 SYS 2 SYS 3 SYS 4 Figure: influence of DHW tank volume on SPF for SFH015. Influence of solar thermal collector area For SFH015, doubling the area of solar thermal collectors can augment the SPF by 0.4 to 0.6. Following figure shows the influence of collector area on SPF for SFH SFH015: Influence of solar collector area on SPF 4 SPF [-] Asc 50% Asc 100% Asc 200% Solar thermal collector area (100%=5.2m²) SYS 1 SYS 2 SYS 3 SYS 4 Figure: influence of solar thermal collector area on SPF for SFH015. References: ANRE; 2005; Code van goede praktijk voor de toepassing van warmtepompsystemen in de woningbouw [in Dutch]; Ministerie van de Vlaamse Gemeenschap, afdeling natuurlijke rijkdommen en energie (ANRE); 2005; CEN; 2011; EN 14511: Air conditioners, liquid chilling packages and heat pumps with electrically driven compressors for space heating and cooling; European Committee for Standardization (CEN), Brussels; 2011; CEN; 2007; EN 15450: Heating systems in buildings Design of heat pump heating systems; European Committee for Standardization (CEN), Brussels; 2007; Desmedt J., Van Bael J., Hoes H., Robeyn N.; 2012; Experimental performance of borehole heat exchangers and grouting materials for ground source heat pumps; International Journal of Energy Research; 2012 (36); ; 2012;
170 Dott R., Haller M.Y., Ruschenburg J., Ochs F., Bony J.; 2013; The Reference Framework for System Simulations of the IEA SHC Task 44 / HPP Annex 38 Part B: Buildings and Space Heat Load A technical Report of Subtask C Report C1 part B; Institut Energie am Bau Fachhochschule Nordwestschweiz, IEBau FHNW, Muttenz, Switzerland; September ; Grundfos; 2008; Verwarmingssystemen in woonhuizen - Grundfos installatiehandboek 4e editie [in Dutch]; 2008; Haller M. Y., Dott R., Ruschenburg J., Ochs F., Bony J.; 2013; The Reference Framework for System Simulations of the IEA SHC Task 44 / HPP Annex 38 - Part A: General Simulation Boundary Conditions - A technical report of subtask C - Report C1 Part A; Institut für Solartechnik SPF, Hochschule für Technik HSR; November ; Haller M.; 2013; Hydraulic Integration of Heat Pumps with Combistores; SHP Symposium: Solar Thermal and Heat Pump Systems for Residential Applications; Mechelen, Belgium; April ; Henning H.-M., Miara M.; 2008; Systems using solar thermal energy in combination with heat pumps 1st concept paper; 64th ExCo meeting; Winterthur, Switzerland; November ; McCorry M., Jones G.Ll. (eds); 2011; Geotrainet Training Manual for Designers of Shallow Geothermal Systems; Geotrainet, European Federation of Geologists; Brussels; 2011; Vervotte I.; 2007; Besluit van de Vlaamse regering betreffende de preventie van de veteranenziekte op publiek toegankelijke plaatsen; Brussel, België; 9 februari 2007; VITO; 2007; Beste Beschikbare Technieken (BBT) voor Legionella-beheersing in Nieuwe Sanitaire Systemen; BBT-Kenniscentrum, Vlaamse Instelling voor Technologisch Onderzoek (VITO); Mol, Belgium; April 2007; WHO; 2007; Legionella and the prevention of Legionellosis; World Health Organization (WHO); Geneva, Switzerland; ISBN ; 2007; WPZ; 2014a; Prüfresultate Luft/Wasser-Wärmepumpen basierend auf der EN 14511:2011; WPZ, Wärmepumpen Testzentrum; January ; WPZ; 2014b; Prüfresultate Sole/Wasser- und Wasser/Wasser-Wärmepumpen basierend auf der EN 14511:2011; WPZ, Wärmepumpen Testzentrum; January ; WTCB; 2008; Twintig Legionella-risicopunten in sanitaire installaties [in Dutch]; Wetenschappelijk en Technisch Centrum voor het Bouwbedrijf (WTCB) afdeling technische uitrustingen; February 2008; WTCB; 1999; TVN 212 leidraad voor de installatie van zonneboilers [in Dutch]; Wetenschappelijk en Technisch Centrum voor het Bouwbedrijf; 2e uitgave; Brussel; juni 1999;
171 Appendix A: Description of the reference components This appendix describes the characteristics of the various components to be used in the reference systems. Heat Pumps Average values for thermal capacity versus electrical consumption at various working conditions from test results [WPZ; 2014a][ WPZ; 2014b] are used for A/W, B/W and W/W heat pumps. Values of test results for at least 3 different working conditions should be available to retain the test results in the analysis and should include the reference working conditions for the respective type of heat pump. Brine/Water Heat Pumps Heat pumps with refrigerant R407C occur most frequent in the dataset of Brine/Water heat pumps (B/W HPs). The dependency of COP on thermal capacity is small for heat pumps with refrigerant R407C within a small interval of thermal capacity. The dependency of COP on thermal capacity is neglected. For the B/W heat pumps to be used in Polysun analysis B/W HPs with R407C are considered. The average COP of all WPZ data entries of HPs with refrigerant R407C tested not earlier than 2013 (#=6) is used. (The COPs of the sole entry of a HP tested not earlier than 2013 with thermal capacity below 10kW (;Striega-Therm AG SWU8) within the dataset of these 6 entries corresponds well with the average COPs for the various working conditions considered.) The volume flow rate (of the water at the condenser side) is calculated as function of the thermal capacity at B0/W35-30 (V 35 ). Per kw thermal capacity the B/W HP contains 0.21kg refrigerant. Following table contains a summary of the input parameters for B/W HP. The COP values are obtained from tests according to EN14511: 2011 []. Volume flow adjustment V35 V35 V35 V45 V45 V55 V55 V55 Heat. cap. [kw] Volume flow cooling agent at B0/W35 Refrigerant working conditions: B5 / W35 B0 / W35-30 B-5 / W35 B5 / W45 B0 / W45-40 B5 / W55 B0 / W55-47 B-5 / W55 [m³/h] amount [kg] B/W HP input R407C COP [-]: Coefficient (apply on thermal capacity at B0/W35) Table: input parameters for B/W heat pumps. Translated to the thermal capacity resulting from the system sizing, the input in Polysun becomes: Heat. cap. Volume flow adjustment V 35 V 35 V 35 V 45 V 45 V 55 V 55 V 55 at B0/W35 Volume flow cooling agent Polysun [W] Refrigerant working conditions: B5 / W35 B0 / W35-30 B-5 / W35 B5 / W45 B0 / W45-40 B5 / W55 B0 / W55-47 B-5 / W55 [m³/h] amount [kg] B/W HP input 3399 R407C COP [-] Thermal capacity [W] Electrical Input Power [W] R407C COP [-] Thermal capacity [W] Electrical Input Power [W] R407C COP [-] Thermal capacity [W] Electrical Input Power [W] R407C COP [-] Thermal capacity [W] Electrical Input Power [W] Table: input parameters for B/W heat pumps.
172 Air/Water Heat Pumps Refrigerant R407C occurs more frequent in the complete dataset of Air/Water (A/W) heat pumps [WPZ; 2014a]. For the heat pumps tested according to EN: 14511: these are considered to be the most recents HPs - HPs with refrigerant R410A with output modulation using frequency inverter occur most frequent in the dataset. The dependency of COP on thermal capacity is neglected. For the A/W heat pumps to be used in Polysun analysis R407C A/W heat pumps are considered. The average COP of all WPZ data entries of A/W heat pumps with refrigerant R407C tested according to EN 14511: 2011 (#=7) is used. The volume flow rate (of the water at the condenser side) is calculated as function of the thermal capacity at A2/W35 (V 35 ). Per kw thermal capacity the A/W HP contains 0.61kg refrigerant. Following table contains a summary of the input parameters for A/W heat pumps: Heat. Cap. Volume flow adjustment V35 V35 V35 V35 V35 V45 V55 V55 at A2/W35 A10 / W35 A7 / W35-30 A2 / W35 A-7 / W35 A-15 / W35 A7 / W45-40 A7 / W55-47 A-7 / W55 Volume flow cooling agent [kw] Refrigerant (80% r. H.) (89% r. H.) (84% r. H.) (75% r. H.) (--) (89% r. H.) (89% r. H.) (75% r. H.) [m³/h] amount [kg] A/W HP input R407C COP [-] Coefficient (apply on thermal capacity at A2/W35) Table: input parameters for A/W heat pumps. Translated to the thermal capacity resulting from the system sizing, the input in Polysun becomes: Heat. cap. Volume flow adjustment V 35 V 35 V 35 V 35 V 35 V 45 V 55 V 55 at A2/W35 Volume flow Cooling agent Polysun [W] Refrigerant working conditions: A10 / W35 A7 / W35-30 A2 / W35 A-7 / W35 A-15 / W35 A7 / W45-40 A7 / W55-47 A-7 / W55 [m³/h] amount [kg] A/W HP input 3399 R407C COP [-] Thermal capacity [W] Electrical Input Power [W] R407C COP [-] Thermal capacity [W] Electrical Input Power [W] R407C COP [-] Thermal capacity [W] Electrical Input Power [W] R407C COP [-] Thermal capacity [W] Electrical Input Power [W] Table: input parameters for A/W heat pumps. Ground heat exchanger When part of the system configuration, the ground heat exchanger is a double U-tube vertical borehole heat exchanger. Its characteristics are adopted from T44 [Haller et al.; 2013]; vertical borehole heat exchanger with double-u pipes (two U-loops in parallel; geometrical configuration at the U-turn r/d i =2). borehole diameter = 0.18m pipe material: PE80 32/26; inner diameter of pipes = 0.026m; pipe roughness e=0.002mm. maximum admitted fluid temperature = 90 C Single borehole: g-value 1, 2, 3, 4, 5 respectively = 4.82, 5.69, 6.29, 6.57, 6.6 Ground loop length: according to system sizing (see chapter on preliminary system sizing; HP Source side heat exchanger) specific heat capacity of the filling material = 1.65 kj/kgk density of the filling material = 2000 kg/m3 heat conductivity of the filling material (lambda) = 2.0 W/mK
173 Ground loop preload time = 5years (see chapter on preliminary system sizing; HP Source side heat exchanger) Annual withdrawn energy = 100kWh per year and per meter BHE length (maximum) (see chapter on preliminary system sizing; HP Source side heat exchanger) EWS file: no BHE loop fluid=polypropylene mixture (33.3% mass fraction) Solar thermal collector The various units of solar thermal collectors are applied in parallel. Flat plate solar thermal collectors The specifications of the solar thermal flat plate collectors (SCFP) applied in simulation are the result of an analysis of 14 Polysun catalogue entries of flat plate collectors of 2m² gross area with recent test date completed by data taken from TVN 212 [WTCB; 1999] reference collector and Polysun catalogue entry number 3 ( flat-plate, good quality specifications by SPF)): orientation: south (azimuth = 0 ) (TVN 212) [Haller et al.; 2013] angle (between collector and horizontal plane) = 45 (TVN 212) [Haller et al.; 2013] rotation of the collector plane = 0 derived from 14 Polysun catalogue flat plate collectors of 2m² gross area with test date 2013: o gross area = 2m² o aperture area=absorber area = 1.87m² o internal diameter = 7mm o single pipe length = 1.85m o parallel piping = 8 o pipe roughness e = 0.1mm o linear form factor = 1 o friction factor = 0 o optical efficiency η 0 = at laminar flow in pipes of the collector o optical efficiency η 0 =0.793 at turbulent flow in pipes of collector o linear heat loss coefficient without wind = 3.72 W/(m²K) o linear heat loss coefficient with wind (3±1 m/s) = 4.14 W/(m²K) (according to EN12975) o quadratic heat loss coefficient = W/(m²K²) (according to EN12975) o dynamic heat capacity = J/K o diffuse irradiation fraction = 0 o volume = 1.66l o test flow rate =100 l/h o maximum flow rate =2000 l/h o maximum pressure = 10 bar o maximum temperature = 182 C no tracking no shade
174 wind speed at the collector plane = 50% of the wind speed taken from climatic data [Haller et al.; 2013] solar loop fluid: polypropylene mixture (33.3% mass fraction) Following table gives an overview of SCFP input. collector type aperture gross eta0 eta0 A1 A1 dyn. heat diffuse test absorber area area (laminar) (turbulent) (without wind) (with wind) A2 capacity North-South irradiation date area [m²] [m²] [m²] [-] [-] [W/m²/K] [W/m²/K] [W/m²/K²] [J/K] axis fraction North-South 0 internal pipe single pipe pipe test flow max. flow max. volume diameter length parallel roughness linear form fluid for rate rate max pressure temperature [l] [mm] [m] piping [mm] factor friction factor test [l/h] [l/h] [bar] [ C] Flat-plate collector Water Table: SCFP input parameters. Incident angle modifier (IAM) model and angle factors are copied from Polysun catalogue entry number 3 ( flat-plate, good quality ). Vacuum tube solar thermal collectors The specifications of the vacuum tube solar thermal collectors (SCVT) applied in simulation are the result of an analysis of 9 Polysun catalogue entries of vacuum tube solar thermal collector with gross area in between 1.9 and 2.1m². Following table gives an overview of SCVT input parameters. collector type Tube collector aperture gross eta0 eta0 A1 A1 dyn. heat diffuse test absorber area area (laminar) (turbulent) (without wind) (with wind) A2 capacity North-South irradiation date area [m²] [m²] [m²] [-] [-] [W/m²/K] [W/m²/K] [W/m²/K²] [J/K] axis fraction North-South 0 internal pipe single pipe pipe test flow max. flow max. volume diameter length parallel roughness linear form fluid for rate rate max pressure temperature [l] [mm] [m] piping [mm] factor friction factor test [l/h] [l/h] [bar] [ C] Water Table: SCVT input parameters. IAM model and angle factors copied from catalogue entry number: 14416: SUNSYSTEM VTC15; NES New Energy Systems Ltd.; Fraunhofer ISE; Tube collector tested in Tank Geometry The area of a cylindrical tank is minimal for equal volume when the height of the tank is equal to the diameter of the tank. To benefit from thermal stratification and for practical convenience, the height is taken to be at least twice the diameter. h tank =2 * D tank With: h tank = height of tank (excluding top and bottom bulge height) [m] (maximum is set at 2m) D tank = diameter of tank [m] (maximum is set at 1m)
175 The bulge height is taken to be 0.1m for all tanks and is to be added for both top and bottom to obtain total height of the tank. The bulge volume is taken equal to 75% of its circumscribed cylinder. The volume then becomes equal to the volume of an equivalent cylinder with height: h equivalent,cylinder =2 * D tank * h bulge in which: h equivalent,cylinder = height of an equivalent cylinder with same volume as the tank [m] h bulge = height of each bulge [m] =0.1 V tank = * (D/2)² * h equivalent,cylinder Substituting h equivalent,cylinder results in: V tank = * D³/ *h bulge * * D²/4 in which: V tank = Volume of the tank [m³] For h bulge taken 0.1m and a given volume, solving the equation results in tank diameter D tank. tank height h tank results from h tank = 2 * D tank. Upper coil: simmer pipe 25x2.5 h upper coil = h tank * 0.30/1.05 h lower coil = h tank * 0.50/1.05 A upper coil = V tank * 1.8/0.260 A lower coil = V tank * 3.6/0.260 In which: h upper coil = height of the upper coil [m] h lower coil = height of the lower coil [m] h tank = height of tank (excluding bulges) [m] A upper coil = area of the upper coil [m²] A lower coil = area of the lower coil [m²] V tank = volume of DHW tank [m³] Position of lower coil (port number 1 pos. C[1]) =54 % (This corresponds with the position of the middle of layer number 7 (numbering according to Polysun manual).) Applying the equation for the height of the lower coil, this results in the outflow at layer number 1(numbering according to Polysun manual). Position of upper coil (port number 3 pos. C[3]) =96 % (This corresponds with the position of the middle of layer number 12 (numbering according to Polysun manual).) Applying the equation for the height of the upper coil, this results in the outflow at layer number 8 (numbering according to Polysun manual). (The position of the coils refers to the height of the top connection of each coil relative to the tank height. For more information, please refer to the Polysun manual [Vela Solaris; 2014].) Materials, thickness and insulation Tank material: enameled steel

.")
176 Combitank material: steel Tank wall thickness: 2.5mm Combitank wall thickness: 3mm Connection losses =0.2W/K (S-bending at ports and lower connection of one coil=0.1 and upper connection of one coil=0.1w/k) Inflow damping: 100% Tank insulation level: Table: minimum insulation thickness of DHW tank of solar thermal system as function of thermal conductivity of insulation material and of DHW tank volume [WTCB; 1999] These insulation levels are applied for all tanks (not limited to the tanks for DHW storage only). Rigid PU foam is applied (Polysun catalogue (entry number 20 in the material catalog); thermal conductivity =0.03W/(mK)). Pumps Technical specifications from a range of pumps from one manufacturer have been adopted for use in the simulations. Pump characteristic curves of pumps taken from Grundfos UPS range [Grundfos; 2008]. The characteristic curves of the selected pump range were translated to equations of paraboles. p =C 1 * (C 2 - q) 0.5 in which: p q = Pump Head [kpa] = Flow rate of the pump [l/h]
177 Head [kpa] C 1 &C 2 = characteristic coefficients of the pump [-] Following table defines the performance curves of the pumps used. ZW_Pump_25-30 ZW_Pump_25-40 ZW_Pump_25-50 ZW_Pump_25-55 ZW_Pump_25-60 ZW_Pump_25-80 C C P [W]* P [W]** P [W]*** * data taken from Polysun catalog (level 2) ** data taken from technical specifications (level 2) *** data used for ZW project simulations Table: Characteristic coefficients and power of the pumps. The graph in following figure contains the curves of the pumps used for pump selection. Pumps: performance curves Flow rate [l/h] ZW_Pump_25-30 ZW_Pump_25-40 ZW_Pump_25-50 ZW_Pump_25-55 ZW_Pump_25-60 ZW_Pump_25-80 Figure: Parabolic fits of the performance curves of the pumps used for pump selection The original specifications obtained from the Polysun databank (performance curves) and from the manufacturers specifications (nominal power) are used in the simulations. Pipes Except otherwise stated at the component description (e.g. heating system, BHE, solar collector and tank coils) copper pipe are applied with external diameter of 22mm, internal diameter of 20mm; length of 1m, insulated by 20mm thick loose glass fibres and mineral wool with a thermal conductivity equal to W/(mK). These pipes have a pipe roughness of 0.002mm. They are applied indoors with 10% of recoverable losses. The linear form factor for pressure drop multiplication to account for pipe bends, joints, etc. is equal to 1. The pipes to and from the solar collector each have a length of 15m [Haller et al.; 2013]. The pipes to and from the BHE each have a length of 10m.
178 Appendix B: Simplifications concerning the building input This appendix describes the simplifications regarding the building that were introduced as a result of the limitations of Polysun software. It is not possible to insert an inclined roof in Polysun. The geometry of the building is simplified in Polysun as a rectangular volume. The ventilation flow rate (for the purpose of ventilation heat loss calculation) is calculated as follows: air change rate multiplied by inner volume in which inner volume is calculated as follows: heated/air-conditioned living area multiplied by floor height in Polysun [Personal communication with the Polysun helpdesk]. The transmission heat loss area (for the purpose of transmission heat loss calculation) is equal to the area of a rectangular volume with (length x width x height) equal to ( length of building x width of building x ( number of floors multiplied by floor height )). The total thermal capacity of the building [kj/k] (for the purpose of calculation of time-dependent thermal behavior) is calculated as follows; heat capacity of the building (expressed in [kj/m²/k]) multiplied by the transmission heat loss area (determined according to the description in the previous alinea). The heated/air-conditioned living area is calculated as the product of (length of building), (width of building) and (number of floors). In order to enable a correct output of reported values of (or in relation to) the net area heated/airconditioned floor, the choice is made to construct an equivalent rectangular volume with the area of ground surface equal to the internal area of the ground surface of the original building and the number of floors is kept equal to the number of floors in the original building. This is the reason why it is chosen to translate the (geometrical characteristics and wherever needed parameters related to building physics of the) original building to a rectangular volume matching the internal dimensions of ground floor and volume of the original building. The floor height is then calculated so that the internal volume of the new building matches the internal volume of the original building. This enables to keep the air exchange rates for ventilation and infiltration (related to the internal dimensions of the building) equal for the new building and the original building. Such parameters include: air exchange rate and in- and exfiltration air exchange rate. As the transmission losses are calculated in relation to the external dimensions, the overall heat loss coefficient Um is recalculated so that the total heat transfer of the new rectangular building matches the total heat transfer of the original building. The specific thermal capacity of the new building is calculated in relation to the new building geometry so that the total thermal capacity matches the total thermal capacity of the original building. The manipulation of geometrical and physical parameters of the building as described above was required by the very simplified building model but results in equal total transmission and ventilation heat losses, equal heat gains and equal thermal capacity of the new rectangular building and original building.
179 Following steps summarize the method to determine the dimensions of the new rectangular geometry of the building for input in Polysun building component; 1) Length of building, width of building, number of floors of the new, rectangular building is kept equal to those of the original building. This results in equal heated/air-conditioned living area and parameters related to it of the new building and of the original building. 2) Floor height is calculated so that the volume of the new, rectangular building matches the internal volume of the original building. Parameters related to the internal volume of the building such as the air exchange rate for ventilation and infiltration of the original building can thus be used for the new building. The specific thermal capacity (related to the internal area of the building envelope) needs to be recalculated so that the total thermal capacity of the new building matches the total thermal capacity of the original building. 3) The parameters overall heat loss coefficient and window to wall area ratio are defined in relation to the new geometry and are recalculated so that the total transmission losses and solar heat gains of the new building are equal to those of the original building. The calculation of thermal capacity of external walls of the original building is performed assuming a volume weighted average thermal capacity of the composing layers that are within the boundaries of thermal insulation of the building envelope. The total thermal capacity of the original building is calculated from specific values related to the exposed area (internal dimensions of the building). In concordance with T44, the calculation of the thermal capacity of the internal walls, all internal construction elements are replaced in simulation by a 200m² 0.2m thick clinker wall (thermal capacity= 0.92 kj/(kg.k), density=650kg/m²) of which two sides are exposed. They are inserted in Polysun as part of the overall thermal capacity of the building. Polysun allows input of internal heat gains by people (and electrical equipment) expressed specifically (to net floor area) and rounds off to the nearest integer. A detailed input is possible by adding the internal heat gains caused by electrical appliances and people in the input for internal heat gain by electrical equipment (2) expressed in power [W]. When postsprocessing the results, the internal heat gain can be split up accordingly. The total internal heat gains for all buildings is W of which 47% is caused by electrical equipment and 53% by people. Shading is taken into account when the room temperature is greater than 23.8 C and irradiation is reduced by 90%. This is a simplification imposed by the limited possibilities of Polysun in comparison to the more detailed calculation of shading according to T44 [Dott et al.; 2013]. For ventilation and infiltration air exchange rates it is not possible for either of the two to insert a value below 0.1. For the SFH015 a heat recovery with an effectiveness of 60% is applied on a total air exchange rate (for ventilation only) of 0.4. The airtightness reaches near zero infiltration rate. In Polysun an air exchange rate [1/hr] of 0.3, an air infiltration rate of 0.1 and a heat recovery gain [%] of 80 is inserted so that the air infiltration equals 0.1 air changes per hour and the ventilation heat loss equals 20% of 0.3 air changes per hour, adding up to a total loss rate (ventilation & infiltration) of 0.16 which is equal to 0.4 *(1-0.6). The percentage of heat recovery gain relates just to the ventilation losses (air exchange) of the building [Personal communication with the Polysun helpdesk]. Natural ventilation is enabled in Polysun; this means that natural ventilation is used during hot days, particularly in summer time by opening windows [Vela Solaris; 2013]. It is enabled when the outside
180 temperature is at least 24 C and the inside temperature is higher than the outside temperature [Personal communication with the Polysun helpdesk]. No further details are available. A more detailed approach of free driven night ventilation depending on various criteria as used in the reference buildings of T44 [Dott et al.; 2013] could not be included in the building component in Polysun.
181 Appendix C: Pump sizing method This appendix describes the method used for the selection of pumps. For each circuit, a pump is selected based on the circuit system curve and the pump performance curve according to following procedure: Step 1: calculate the total flow rate to be handled in the circuit; Step 2: calculate the total pressure loss in the circuit to be handled by the pump; Step 3: construct the circuit system curve; Step 4: choose an appropriate pump based on the performance curve. Each of the steps is further explained in the following sections. Total flow rate In a first step, the total flow rate q m,tot to be handled in the circuit is calculated. HP secondary circuit The total flow rate to be handled in the secondary circuit of the HP is taken equal to the flow rate needed to provide the capacity of the HP at a temperature difference of 5 C; q m,tot,sec = q nom,hp in which: q m,tot,sec = total flow rate in secondary circuit of HP (used for pump sizing) [kg/h] q nom,hp = flow rate at T=5 C to provide Q HP [kg/h] with: Q HP = thermal capacity of the HP [W] Note regarding the BU-heater and the flow rate; the BU-heater is expected to augment the capacity of the HP at the total flow rate by augmenting the temperature, when the temperature difference becomes greater than T in the case the capacity of the HP is insufficient. note regarding T for SFH 100; the design temperature regime of the space heating system (=temperature difference between supply and return pipes at design conditions) T = 10 C [Dott et al.; 2013] instead of 5 C. However for DHW production the pump is sized to enable the delivery of Q HP at T =5 C. For the purpose of pump sizing, both operational variants are taken into account. HP primary circuit In the case of BHE on the source side, the total flow rate of the primary circuit of the HP is calculated as a rate x of the total flow rate of the secondary circuit of the HP. q m,tot,prim =x * q m,tot,sec with x= q m,tot,prim / q m,tot,sec x is calculated to enable the heat transfer necessary on the primary side to provide the capacity on the secondary side of the HP taking the temperature difference over the evaporator and the
182 condenser of the HP and the thermodynamic characteristics of the working fluids in the primary and secondary circuits into account. Q BHE =(1-1/COP optimistic )*Q HP and Q BHE = q m,tot,prim * c pfbhe * T prim / 3600 and Q HP = q m,tot,sec * c pw * T sec / 3600 together with x= q m,tot,prim / q m,tot,sec leads to: x = (1-1/COP optimistic ) * c pw * T sec / (c pfbhe * T prim ) in which: q m,tot,prim T prim = total flow rate in primary circuit of heat pump (used for pump sizing) [kg/h] = temperature difference over the evaporator [ C] =5 C T sec = temperature difference over the evaporator [ C]. This is taken equal to 5 C c pw = specific heat of water [J/(kg.K)] = 4187 c pfbhe = specific heat of fluid in the primary circuit of the heat pump [J/(kg.K)] COP optimistic = optimistic value for the coefficient of performance used to size the BHE (see table above) [-] x = rate of total flow rate in secondary circuit of heat pump to be applied on secondary circuit of the HP (used for pump sizing) [kg/h] Solar circuit The flow rate is calculated based on the yearly maximum solar yield of the collector and a temperature difference of 10 C. The yearly maximum solar yield is calculated based on the optical efficiency of the collector and the number of collectors. This is the efficiency when the temperature of the absorber is equal to the ambient temperature (no collector envelope losses). Q SC = n * A a * o * S t,max In which: Q SC = yearly maximum solar yield for the solar collector total area [W] n = number of solar thermal collectors [-] = aperture area of one solar thermal collector [m²] A a o = optical efficiency of the solar thermal collector [-] S t,max = yearly maximum of total solar radiation incident on a unit area with ideal tilt and orientation for clear sky in Belgium [W/m²] = 1000 The total flow rate to enable the energy transfer at a certain temperature difference with given fluid characteristics can be calculated from the yearly maximum solar yield; q m,tot,sol = Q SC * 3600 / (c pfsol * T) in which: q m,tot,sol = total flow in solar loop (used for pump sizing) [kg/h] Q SC = yearly maximum solar yield for the solar collector total area [W] c pfsol = specific heat of fluid in the solar loop [J/(kg.K)] T = temperature difference between inlet and outlet of the solar thermal collector [ C] = 10 C Regeneration circuit The same pump is taken for the regeneration circuit as in the primary loop of the heat pump. The flow rate is limited to the flow rate of the primary loop to limit the maximum temperature rise over the heat exchanger in the regeneration circuit. This is done to reduce the risk of overheating the
183 borehole heat exchanger and the temperature level at the evaporator of the heat pump. The maximum of this temperature rise occurs in the case of the smallest heat pump in combination with the largest area of solar collectors and is about 14 C in design conditions. Pipe sections The speed in all the pipes in the circuits should be limited. This can be done by choosing larger pipe sections if needed. Starting from the calculated flow rate, calculate the minimum pipe section corresponding with a maximum speed allowed in the pipes (=1.5m/s). A c,min = q m / (3600 * * v max ) Make sure that the section of the pipe is equal to or larger than the minimum section; A c A c,min in which: v max = speed limit in pipes [m/s] = flow in pipe [kg/h] q m f A c A c,min =density of fluid [kg/m³] = section of the pipe [m²] = minimum section of the pipe corresponding with v max [m²] Total pressure loss Determine the total pressure loss p tot in the circuit; p tot = p linear + p local with: p linear = (R * l) With: and R = * * v² / (d * 2) With: For Re 2300 (laminar flow in pipes): p local = ( * * v² / 2) = 64 / Re For Re 3500 (turbulent flow in pipes): 1 λ = 2 log ( ε d Re 0.901) For 2300 < Re < 3500 (transitional flow regime for flow in pipes): In which: d = inner diameter of pipe [m] e = roughness factor [mm] λ = λ L (3500 Re)+λ T (Re 2300) With (for flow in pipes): Re = v * d /
184 l = length of pipe [m] = friction coefficient [-] L = friction coefficient for laminar flow regime [-] T = friction coefficient for laminar flow regime [-] = kinematic viscosity of fluid in pipe [m²/s] p linear = linear pressure loss [Pa] p local = local pressure loss [Pa] R = specific pressure loss (per unit of pipe length) [Pa/m] Re = Reynolds number [-] = density of fluid in pipe [kg/m³] v = speed in pipe [m/s] = local pressure loss coefficient [-] Notes on the calculation of p tot In the case of parallel loops in the circuit, the maximum pressure drop occurring at one of the parallel loops is taken in the calculation for the total circuit pressure drop. This means that the most demanding loop in the circuit should be considered. The additional pressure loss due to buoyancy (thermosiphon) is neglected. (This corresponds with the assumption the pump is located at equal or lower height then the high level temperature component(s) in the circuit and the positive difference in height (h hightempcomp -h pump ) is small.) Values of pressure loss coefficients usually are given for water as a fluid (at 80 C). In the case of another fluid (at another temperature), the linear pressure loss coefficients shall be calculated at the thermodynamic properties of the fluid at the respective temperature. Lowest temperature levels are determining for pump sizing because they correspond with highest pressure losses (highest viscosity and density). Values of local pressure loss coefficients shall be taken from technical information provided by the manufacturer. The local pressure loss coefficient is often taken from tables derived from tests or calculated with formulas that are independent of the density and kinematic viscosity of the heat transfer fluid [Kovacs et al.;2012]. Default values (for water at 80 C) can be found in annex B of WTCB report n 14 [WTCB; 2013]. The local pressure losses occurring in straight joints with varying diameters and in connections are neglected unless specified in this document. For the local pressure losses occurring in the evaporator and the condenser of the HP, the backup heater and the external heat exchanger in the regeneration circuit, an equivalent linear pressure drop of 1m pipe length is taken. For the floor heating emission system, enough loops shall be applied in parallel to limit the pressure drop of each loop to maximum of 30kPa. This corresponds with the description of the heating emission system according to T44 [Dott et al.; 2013]. Circuit system curve The theoretical working point of the circuit is defined by the total pressure loss and the total flow rate. Construct the circuit system curve based on the total pressure loss and the flow rate to be handled. C = p tot / q² m, tot
185 In which: C = characteristic value for the circuit [kg -1 m -1 ] Pump selection Select a high efficiency pump with a performance curve so that the operation point lies: in close vicinity to, but above the theoretical operation point of the circuit system curve in close vicinity to the BEP (flow at operation point in second third of flow range (preferably the right side part of it); 0.8 * q BEP < q operation point < 1.10 * q BEP ) In which: BEP = Best efficiency point of the pump C = circuit system characteristic [kg -1.m -1 ] p linear p local p tot q BEP = Linear pressure losses due to pipes in the circuit [Pa] = Pressure losses due to local components [Pa] = Total pressure loss in circuit [Pa] = Flow rate at best efficiency point [kg/h] q operation point = Flow rate at operation point [kg/h] q m,tot = Total flow rate to be handled in the circuit [kg/h] Fluids For the primary circuit of the HP (this is the BHE circuit) and for the solar circuit a propylene mixture is used (propylene glycol and water: proportion in weight (= m propylene /m mixture ) = 33.3%). For practical convenience, fluid properties are only evaluated at 20 C here. c p,w =4187J/(kg.K) c p,p =2358J/(kgK) p =1065kg/m³ w =1000kg/m³ w = m²/s p = m²/s In which: p w c p,p c p,w w p =density of propylene [kg/m³] =density of water [kg/m³] = specific heat of propylene [J/(kgK)] = specific heat of water [J/(kgK)] = kinematic viscosity of water [m²/s] = kinematic viscosity of propylene [m²/s] Calculation of the kinematic viscosity of a mixture of liquids The kinematic viscosity of a mixture can be estimated by calculation of a Viscosity Blending Number (VBN) of each component and of the mixture from which the kinematic viscosity of the mixture can be calculated as follows:
186 ν m = exp (exp ( VBN m )) With: VBN m = ( x i * VBN i ) VBN i = * ln ( ln ( i ) ) In which: x i = mass fraction of component i in the mixture [%] i = kinematic viscosity of component i [cst] m = kinematic viscosity of the mixture [cst] VBN i = Viscosity Blending Number of component i in the mixture [-] VBN m = Viscosity Blending Number of the mixture [-] Note: notice that the kinematic viscosity is inserted in the formula in centistokes. 1cSt=10-6 m²/s Calculation of the specific heat of a mixture of two liquids. The specific heat of a mixture of two liquids expressed per mass unit, can be calculated as the massweighted average of the specific heats of the two component liquids; C pm = (x i * C pi ) Calculation of the density of a mixture of two liquids. Method A: ( only valid for preliminary assumption that mass fraction equals volume fraction); m = (x i * i ) Method B: (only valid for preliminary assumption that volumes of components of mixture are additive); 1/ m = (x i / i ) In the frame of the project ZonWarm method B is used.
187 IWT-TETRA : Zongekoppelde Warmtepompsystemen ZON-WARM Eindverslag Werkpakket 5: Meetcampagne systeemrendement Taak 5.1: Gedetailleerde labometing Taak 5.2: Opstellen uniforme meetkit Taak 5.3: Metingen op reële installaties Vakgroep Thermotechniek, Technologiecampus De Nayer Faculteit Industriële Ingenieurswetenschappen, KU Leuven Jan De Nayerlaan 5, 2860 Sint-Katelijne-Waver, België Tel.: + 32 (0) Maarten.Sourbron@kuleuven.be Auteurs: Redactie: Leen Goovaerts Dries Van Aken Maarten Sourbron
188 IWT-TETRA : Zongekoppelde Warmtepompsystemen Eindverslag Werkpakket 5: Meetcampagne systeemrendement Auteurs: Leen Goovaerts, Dries Van Aken, Maarten Sourbron Copyright KU Leuven Zonder voorafgaande schriftelijke toestemming van zowel de auteur(s) als de redacteur(s) is overnemen, kopiëren, gebruiken of realiseren van deze uitgave of gedeelten ervan verboden. Voor aanvragen tot of informatie i.v.m. het overnemen en/of gebruik en/of realisatie van gedeelten uit deze publicatie, wend u tot KU Leuven Campus De Nayer, Jan De Nayerlaan 5, B-2860 Sint-Katelijne-Waver, of via iiw.thomasmore.denayer@kuleuven.be. Voorafgaande schriftelijke toestemming van de redacteur(s) is eveneens vereist voor het aanwenden van de in dit rapport beschreven (originele) methoden, producten, schakelingen en programma s voor industrieel of commercieel nut. 1
189 IWT-TETRA : Zongekoppelde Warmtepompsystemen Eindverslag Werkpakket 5: Meetcampagne systeemrendement Auteurs: Leen Goovaerts, Dries Van Aken, Maarten Sourbron Inhoudstafel 1 Taakbeschrijving (uit projectaanvraag) Taak 1 (WP5T1): Gedetailleerde labometing Taak 2 (WP5T2): Opstellen uniforme meetkit Taak 3 (WP5T3): Metingen op reële installaties Resultaat van het werkpakket Uniforme aanpak voor meting en dataverwerking Principeschema s Flowcharts Berekeningen WP5T1: Gedetailleerde labometing Overzicht installatie 1:bodem/water wp Gegevens Hydraulisch schema Principeschema Flowchart Berekeningen Bespreking Overzicht installatie : Lucht/water wp Gegevens Hydraulisch schema Principeschema Flowchart Berekeningen Meetresultaten Bespreking Besluit WP5T2: Metingen in situ Overzicht Betekom Gegevens Hydraulisch schema Principeschema
190 IWT-TETRA : Zongekoppelde Warmtepompsystemen Eindverslag Werkpakket 5: Meetcampagne systeemrendement Auteurs: Leen Goovaerts, Dries Van Aken, Maarten Sourbron Flowchart Berekeningen Meetresultaten Bespreking Overzicht Beverlo Gegevens Hydraulisch schema Principeschema Flowchart Berekeningen Meetresultaten Bespreking Conclusies Overzicht Lede Gegevens Hydraulisch schema Principeschema Flowchart Berekeningen Meetresultaten Bespreking Problemen Overzicht Noorderwijk Gegevens Hydraulisch schema Principeschema Flowchart Berekeningen Meetresultaten Bespreking
191 IWT-TETRA : Zongekoppelde Warmtepompsystemen Eindverslag Werkpakket 5: Meetcampagne systeemrendement Auteurs: Leen Goovaerts, Dries Van Aken, Maarten Sourbron 1 Taakbeschrijving (uit projectaanvraag) Het is van belang om op ieder moment de resultaten van berekeningen en simulaties uit WP 4 te kunnen toetsen aan de werkelijkheid. Hiervoor dienen een aantal metingen in labo-omgeving en in situ uitgevoerd te worden. Deelname aan IEA-SHC Task 44 is hierbij een belangrijk aspect. Tijdens deze meetings wordt de definitie van het systeemrendement vastgelegd, wat bepaalt welke metingen allemaal uitgevoerd moeten worden om een vergelijking met externe metingen mogelijk te maken. 1.1 Taak 1 (WP5T1): Gedetailleerde labometing Type : onderzoeksactiviteit De bestaande warmtepompteststand van Lessius Mechelen Campus De Nayer beschikt reeds over alle faciliteiten om de dynamische werking van een warmtepomp met bron- en afgiftesysteem te simuleren. Mits aanpassing, kan deze teststand uitgebreid worden voor het opmeten van dynamische werking van deze basisconfiguratie uit WP3T2. Minimale meting: - systeemrendement van de configuratie - invloed van de regelparameters op het systeemrendement Mogelijke uitbreidingen: - invloed van dimensioneringsparameters (grootte buffer, ) - aanpassing configuratie (plaats van componenten in het hydraulisch schema) - Resultaat: praktisch systeemrendement van de basisconfiguratie met invloed van de regelparameters 1.2 Taak 2 (WP5T2): Opstellen uniforme meetkit Type : onderzoeksactiviteit Voor het goede verloop van de metingen op reële installaties is één uniforme meetkit (datalogger, sensoren, ) voor alle installaties van groot belang. Het vermindert niet alleen de verwerkingstijd van de data voor de verschillende installatie, het maakt ook de vergelijking van de systemen mogelijk. De projectingenieurs stellen tijdens de tweede gebruikersvergadering een drietal meetsystemen voor, waaruit de gebruikers in consensus voor één systeem kiezen. Deze meetkit zal dan ook op alle installaties geplaatst worden. Resultaat: meetkit koppeling zonthermie/warmtepomp 1.3 Taak 3 (WP5T3): Metingen op reële installaties Type : onderzoeksactiviteit 4
192 IWT-TETRA : Zongekoppelde Warmtepompsystemen Eindverslag Werkpakket 5: Meetcampagne systeemrendement Auteurs: Leen Goovaerts, Dries Van Aken, Maarten Sourbron Om labometingen te toetsen aan de praktijkomgeving, worden er in gerealiseerde of te realiseren bouwprojecten metingen uitgevoerd of opgevolgd (case studies). Deze metingen dragen bij tot en worden getoetst aan de dimensioneringsmethodiek die in dit project wordt opgesteld. Daarnaast moet de ervaring van de meetsessie leiden tot aanbevelingen voor de opvolging van warmtepompsystemen. Uitgangspunt voor deze metingen zijn de aanbevelingen uit de IEA-SHC Task 44. In de bedrijvengroep van de gebruikersgroep wordt op zoek gegaan naar concrete installaties die gebruik maken van warmtepompen gecombineerd met zonthermische systemen. Het is de groep van bedrijven die de selectie voert van de types installaties die zullen bemeten worden. Een eerste uitgangspunt is dat het concept dat in het labo bemeten is, ook in de praktijk een tegenhanger vindt. In het kader van het collectief onderzoek WP-Direct zijn reeds 2 installaties, waarbij zonneboiler en warmtepomp gekoppeld zijn, opgemeten. Dit enkel met het oog op de prestaties van de warmtepomp, eventueel kunnen deze meetinstallaties uitgebreid worden om de systeemprestaties te bepalen. Resultaat: praktisch systeemrendement van de configuratie(s) 5
193 IWT-TETRA : Zongekoppelde Warmtepompsystemen Eindverslag Werkpakket 5: Meetcampagne systeemrendement Auteurs: Leen Goovaerts, Dries Van Aken, Maarten Sourbron 2 Resultaat van het werkpakket Dit werkpakket had als doel om metingen in labo en in situ op te zetten om de resultaten van berekeningen en simulaties te kunnen toetsten. Voor Taak 5.1: Gedetailleerde labometingen zijn er twee installaties opgesteld. Omwille van enkele technische oorzaken is hiermee niet het aantal metingen gehaald zoals vooropgesteld (zie betreffende paragraaf). Ook maakte de oorspronkelijke opzet van de metingen dat niet volledig de geplande meetresultaten konden gehaald worden: De gebruikte monitoringapparatuur was identiek aan de in-situ metingen waardoor onvoldoende nauwkeurige metingen konden uitgevoerd worden (bv. te grote tijdstap van de meting die niet alle regelgedrag kan opmeten) De regeling van de installaties werd niet mee opgemeten, zodat meetresultaten niet kon verbonden worden met het gedrag van de regeling. Dit maakt het verklaren van de meetresultaten moeilijk. De regeling van de installaties was niet extern stuurbaar (enkel de standaard regeling beschikbaar), waardoor bepaald installatiegedrag onvoldoende kon opgelegd worden Sanitair warm water-profielen konden in redelijk detail opgelegd worden, maar verwarmingsprofielen niet. De meetopstelling zijn aangesloten op de luchtgroep van het labo, waardoor het afnameprofiel voor verwarming niet instelbaar was. Taak 5.2: Uniforme meetkit is uitgevoerd zoals voorzien, waarbij een meetset is uitgewerkt waarmee alle insitu-installaties zijn uitgerust. In Taak 5.3: Metingen op reële installaties zijn 4 installaties opgemeten. Voor 2 van deze installaties is (Beverlo en Noorderwijk) meetdata beschikbaar voor een langere periode van enkele maanden. Dit maakt relevante conclusies mogelijk. 1 installatie (Betekom) heeft een meetinstallatie die volledig operationeel is, maar omdat de woning nog niet bewoond is, zijn de resultaten minder relevant. Nochtans kunnen wel valabele conclusies getrokken worden voor wat betreft de warmteverliezen van sommige installatieonderdelen. Bij de laatste installatie (Lede) is door vertraging bij het installatiewerk slechts meetdata van 1 maand beschikbaar. Deze meetdata leggen wel enkele fouten in de installatie bloot die moeten opgelost worden vooraleer deze installatie representatieve data kan opleveren. 6
194 IWT-TETRA : Zongekoppelde Warmtepompsystemen Eindverslag Werkpakket 5: Meetcampagne systeemrendement Auteurs: Leen Goovaerts, Dries Van Aken, Maarten Sourbron 3 Uniforme aanpak voor meting en dataverwerking 3.1 Principeschema s Principeschema s worden gebruikt om de installatie op een eenvoudige manier weer te geven. De verschillende blokken die terug te vinden zijn op de principeschema s maken het gemakkelijk om de energiebalans over een bepaald blok en dus een bepaalde component te berekenen. Op deze manier kan elk blok onafhankelijk van de andere bekeken en geanalyseerd worden. De volle bollen op de schema s geven een pomp weer, 2 lege vierkantjes geven samen 1 thermische energiemeter aan en de bollen met een cijfer in, geven een elektrische energiemeter weer. Tabel 1: Principeschema's van alle installaties in het project A: Betekom B: Beverlo C: Lede D: Noorderwijk E: Labo: Bodem/water F: Labo: Lucht/water 7
195 IWT-TETRA : Zongekoppelde Warmtepompsystemen Eindverslag Werkpakket 5: Meetcampagne systeemrendement Auteurs: Leen Goovaerts, Dries Van Aken, Maarten Sourbron Tabel 2: Verklaring nummers en afkortingen op schema's Nummer Afkorting Omschrijving 1 P wp Elektriciteit warmtepomp (compressor + eventuele circulatiepompen die via de warmtepomp gevoed worden) De onderverdeling 1.1 en 1.2 staat voor het andere elektriciteitsverbruik dan de compressor, dat apart opgemeten wordt, maar wel bij het elektriciteitsverbruik van de warmtepomp hoort. 1.3 en 1.4 staat voor het elektriciteitsverbruik van de warmtepomp dat niet apart opgemeten wordt. 2 P zon Elektriciteit pomp zonneboiler 3 P rvw Elektriciteit pomp ruimteverwarming 4 Q zon,opwek,tot Thermische energie uit de zonnecollectoren in totaal 5 Q zon,rvw Thermische energie uit de zonnecollectoren gebruikt voor ruimteverwarming 6 Q zon,sww Thermische energie uit de zonnecollectoren gebruikt voor sanitair warm water 7 Q wp,rvw Thermische energie opgewekt door de warmtepomp voor ruimteverwarming 8 Q afgifte,rvw Thermische energie afgegeven voor ruimteverwarming 9 Q wp,sww Thermische energie opgewekt door de warmtepomp voor sanitair warm water 10 Q afgifte,sww Thermische energie afgegeven voor sanitair warm water 11 Q wp Thermische energie opgewekt door warmtepomp 12 Q reg Thermische energie gebruikt voor regeneratie van de bodem 13 Q bron Thermische energie afkomstig van de bron (bodem, buitenlucht) 8
196 IWT-TETRA : Zongekoppelde Warmtepompsystemen Eindverslag Werkpakket 5: Meetcampagne systeemrendement Auteurs: Leen Goovaerts, Dries Van Aken, Maarten Sourbron 3.2 Flowcharts Flowcharts worden gebruikt om de energiestromen in de installatie in kaart te brengen. De rode pijlen stellen de thermische energiestromen voor, de grijze pijlen stellen de elektrische energiestromen voor, pompen worden aangeduid door blauwe cirkels, de blauwe vierkanten stellen energiemeters voor. Energy Flow Chart: DHW & Heating - Copyright IEA SHC-Task 44 / HPP-Annex38 Sun Ground Air Water Waste Heat Solar Collectors Ground Probes Air HX Water HX Waste HX Electricity Primary Storage Rejection Storage Energy Carrier Water Tank Cold Distrib. HP Heat Distrib. DHW Tank DHW Distrib. Secondary Storage By: AIT EURAC Fraunhofer ISE SPF Figuur 1: Flowchart van de installatie in Beverlo 9
197 IWT-TETRA : Zongekoppelde Warmtepompsystemen Eindverslag Werkpakket 5: Meetcampagne systeemrendement Auteurs: Leen Goovaerts, Dries Van Aken, Maarten Sourbron 3.3 Berekeningen Tabel 3 geeft de definities zoals ze te vinden zijn in Task 44 en de definities zoals ze toegepast worden op de installaties in dit project. Niet alle berekeningen zullen voor alle installaties mogelijk zijn. Wanneer bepaalde berekeningen enkel mogelijk zijn met de volledige elektriciteitsvraag, dit is zowel het elektriciteitsverbruik van de warmtepomp, alle pompen in het systeem en de sturing, zal dit aangeduid worden met dezelfde benaming, maar dan voorzien van een +. Tabel 3: Richtlijnen voor berekeningen Benaming Benaming Task 44 Definitie Task 44 Berekening blokschema s SPF tot+ SPF SHP+ (Q SH + Q DHW + Q C)dt ( P el,shp+ )dt SPF tot SPF SHP (Q SH + Q DHW + Q C)dt ( P el,shp )dt SPF WP SPF HP (Q HP,H + Q HP,C)dt P el,hp dt Of Q RVW afgifte + Q SWW afgifte P WP + P SOL + P RVW Q RVW afgifte + Q SWW afgifte P WP + P SOL Q opwek P WP Q RVW opwek + Q SWW opwek SPF zon Of P WP Q sol opwek tot P sol Q sol RVW + Q sol SWW P sol SPF SWW SPF RVW Q SWW afgifte P WP,SWW Q RVW afgifte P WP,RVW f zon f sol,1 Q SC,H Q DHW + Q SH Q sol opwek tot Q SWW afgifte + Q RVW afgifte Of Q sol RVW + Q sol SWW Q SWW afgifte + Q RVW afgifte Energiebalans Q uit - Q in 10
198 IWT-TETRA : Zongekoppelde Warmtepompsystemen Eindverslag Werkpakket 5: Meetcampagne systeemrendement Auteurs: Leen Goovaerts, Dries Van Aken, Maarten Sourbron 4 WP5T1: Gedetailleerde labometing Op KU Leuven Campus De Nayer werden gedetailleerde labometingen uitgevoerd. Via deze labometingen kon het systeemrendement van de configuratie en de invloed van de regelparameters op het systeemrendement worden bepaald. Eventueel kon ook de invloed van dimensioneringsparameters worden getest of de invloed van aanpassingen aan de configuratie. Voor het uitvoeren van deze gedetailleerde labometingen werden twee systemen geïnstalleerd: Het eerste systeem beschikt over een bodem/water warmtepomp. Deze warmtepomp is aangesloten aan een gecombineerd buffervat. Via een externe sferische warmtewisselaar zijn de vlakke plaat zonnecollectoren aangesloten aan het gecombineerd buffervat. Het gecombineerd buffervat is aangesloten aan een luchtgroep voor de voorziening van ruimteverwarming van de laboruimte. Sanitair warm water wordt voorzien door middel van een doorstroomprincipe door het gecombineerd buffervat. Het tweede systeem maakt gebruik van een lucht/water warmtepomp. Deze warmtepomp is aangesloten aan twee afzonderlijke buffervaten, één voor ruimteverwarming en één voor sanitair warm water. Het buffervat voor ruimteverwarming is aangesloten aan een luchtgroep voor de verwarming van de laboruimte. De vacuümbuis zonnecollectoren zijn aangesloten aan het buffervat voor sanitair warm water. Voor deze beide systemen wordt het elektrisch verbruik van de warmtepomp en zonnecollectoren opgemeten. Ook wordt door middel van warmtemeters opgemeten hoeveel warmte de zonnecollectoren leveren aan de buffervaten, hoeveel warmte de warmtepomp levert aan de buffervaten en hoeveel warmte de buffervaten afgeven aan sanitair warm water en ruimteverwarming. Aan de hand van de opgemeten waarden kan het systeemrendement bepaald worden en de invloed van regelparameters nagegaan worden. Echter vanwege problemen met de meetapparatuur, namelijk de warmtemeters, kan het systeemrendement van beide systemen en de invloed van regelparameters niet worden bepaald (zie paragraaf Bespreking van beide systemen). Enkel voor het tweede systeem met de lucht/water warmtepomp kan de invloed van een regelparameter voor de circulatiepomp in de warmtepomp worden bepaald. Door het kiezen van de juiste regelparameter kan het elektrisch verbruik van de warmtepomp beperkt worden. 11
199 IWT-TETRA : Zongekoppelde Warmtepompsystemen Eindverslag Werkpakket 5: Meetcampagne systeemrendement Auteurs: Leen Goovaerts, Dries Van Aken, Maarten Sourbron 4.1 Overzicht installatie 1:bodem/water wp Gegevens Tabel 5.1.1: De technische gegevens van installatie1. Type Warmtepomp Vermogen Warmtepomp Warmtepomp Bodem/water warmtewisselaar (Viessmann, Vitocal 300-G) 10,2 kw (0 C/35 C) Zonnecollectoren Type zonnecollector Vlakke plaatcollector (Baxi Belgium, FK7300L) Absorberoppervlakte 13,66 m² Hellingsgraad 45 Azimuthoek 180 Buffer Type buffer Grootte buffervat Gecombineerd (TiSUN, Stratificatieboiler Pro Clean) 760 l Zoals zichtbaar in bovenstaande tabel (Tabel 5.1.1) heeft de warmtepomp een vermogen van 10.2 kw. De zonnecollectoren zijn bevestigd met een hellingsgraad van 45 en met een azimuthoek van 180 (Zuiden). Zes vlakke plaatcollectoren geven een totaal absorberoppervlakte van m 2 voor installatie1. Voor deze installatie wordt een gecombineerd buffervat gebruikt met een volume van 760l voor sanitair warm water- en ruimteverwarming-voorziening. 12
200 IWT-TETRA : Zongekoppelde Warmtepompsystemen Eindverslag Werkpakket 5: Meetcampagne systeemrendement Auteurs: Leen Goovaerts, Dries Van Aken, Maarten Sourbron Hydraulisch schema Figuur 5.1.2: Het hydraulisch schema van installatie1. In hydraulisch schema van installatie 1 (Figuur 5.1.1) wordt een verticale en een horizontale bodemcollector weergegeven. De warmtepomp is aangesloten aan zowel de verticale als de horizontale bodemcollector, maar door middel van kranen wordt één van beide uitgeschakeld. In eerste instantie werd de verticale bodemwarmtewisselaar (weergegeven in lichtgrijs) aangesloten aan de warmtepomp, maar vanwege problemen met deze bodemcollector werd overgeschakeld naar de horizontale bodemcollector (zie de Bespreking van installatie1). De warmtepomp heeft één retourleiding en twee afzonderlijke aanvoerleidingen, één voor sanitair warm water en één voor ruimteverwarming. Door middel van driewegkranen stuurt de warmtepomp de opgewekte warmte voor sanitair warm water naar de bovenste aansluitingen van het buffervat en voor ruimteverwarming naar de onderste aansluitingen van het buffervat. De warmte afkomstig van de zonnecollectoren wordt door middel van een externe sferische warmtewisselaar toegevoegd aan het buffervat. Afhankelijk van de temperatuur, wordt de warmte toegevoegd op de juiste temperatuurslaag in het gestratificeerd buffervat. Het buffervat produceert sanitair warm water door middel van een doorstroom-principe. De luchtgroep voor ruimteverwarming is rechtstreeks aangesloten op het buffervat. Op de warmtepomp zijn twee elektriciteitsmeters aangesloten: één voor het elektrisch verbruik van de compressor en één voor het elektrisch verbruik van de sturing van de warmtepomp (primaire pomp, secundaire pomp, ). De pomp voor de zonnecollectoren wordt ook apart opgemeten met 13
201 IWT-TETRA : Zongekoppelde Warmtepompsystemen Eindverslag Werkpakket 5: Meetcampagne systeemrendement Auteurs: Leen Goovaerts, Dries Van Aken, Maarten Sourbron een elektriciteitsmeter. De warmtemeters werken door middel van een debietsmeter en twee temperatuurmeters (aanvoer en retourtemperatuur). Zo wordt de warmte opgemeten die wordt opgewekt door de warmtepomp en zonnecollectoren en die nadien wordt afgegeven door het buffervat. De elektriciteitsmeters en warmtemeters slagen meetwaarden op om de 5 minuten. De meetwaarden van de elektriciteitsmeter van de warmtepomp (P 1 en P 2) worden samengeteld om het totaal elektrisch verbruik van de warmtepomp te bepalen. Dit totaal elektrisch verbruik van de warmtepomp wordt nadien opgesplitst in het elektrisch verbruik van de warmtepomp voor sanitair warm water(p WP-SWW) en voor verwarming(p WP-RVW). Het elektrisch verbruik van de warmtepomp opsplitsen gebeurde aan de hand van het debiet dat werd opgemeten door de warmtemeters Q RVWopwek en Q SWWopwek. Aan de hand van de bekomen meetwaarden worden de verschillende SPFwaarden, zonnefracties en verliesberekeningen uitgevoerd (zie paragraaf Berekeningen ). De luchtgroep voor de ruimteverwarming van het labo werkt elke dag van 08.00uur tot 18.00uur en behoud de ruimte op 20 C. Aangezien op deze luchtgroep de twee installaties zijn aangesloten leveren deze alternerend om het uur warmte aan de luchtgroep. Zo voorziet installatie 1 om 09.00, 11.00, 13.00, 15.00, 17.00uur telkens een uur warmte voor de ruimteverwarming. De warmtepomp regelt een opslagtemperatuur van 50 C voor sanitair warm water. De stand van de warmtepomp Uit betekent dat geen warmte wordt geleverd aan het buffervat, bij de stand Boven wordt enkel warmte opgeslagen in het bovenste deel van het buffervat en voor de stand Normaal wordt warmte opgeslagen over heel het volume van het vat voorzien voor sanitair warm water. Desinfectie is echter niet nodig voor installatie 1 aangezien met een doorstroomprincipe wordt gewerkt. Het programma voor warmteopslag van sanitair warm water: Van tot uur: Normaal Van tot uur: Uit Van tot uur: Boven Van tot 3.59uur: Uit Voor ruimteverwarming is het programma bufferopslag over heel de dag actief. Hierbij houdt de warmtepomp het volume voor sanitair warm water en een bovenste deel van het volume voor ruimteverwarming minstens op 50 C. Zodat steeds kan voldaan worden aan de eisen voor ruimteverwarming en sanitair warm water. De temperatuur waarbij het buffervat warmte afgeeft aan de ruimteverwarming wordt gestuurd door het programma Verwarmingskring2. Hierbij wordt een normale kamertemperatuur van 20 C en een verlaagde kamertemperatuur van 16 C ingevoerd. Afhankelijke van de stookcurve varieert de temperatuur die het buffervat levert aan de luchtgroep voor ruimteverwarming. Indien in het onderstaand programma Normaal wordt in gesteld, wordt de normale kamertemperatuur behouden en indien de stand Gereduceerd wordt ingesteld, wordt de verlaagde kamertemperatuur behouden. Het programma Verwarmingskring2 : Maandag tot Vrijdag: Van tot 05.29uur: Gereduceerd 14
202 IWT-TETRA : Zongekoppelde Warmtepompsystemen Eindverslag Werkpakket 5: Meetcampagne systeemrendement Auteurs: Leen Goovaerts, Dries Van Aken, Maarten Sourbron Van tot 08.29uur: Normaal Van tot 16.44uur: Gereduceerd Van tot 21.29uur: Normaal Van tot 23.59uur: Gereduceerd Zaterdag tot zondag: Van tot 05.44: Gereduceerd Van tot 21.29uur: Normaal Van tot 23.59uur: Gereduceerd Tabel 5.1.2: De stookcurve van de warmtepomp van installatie1. T A (buitentemperatuur) T V (aanvoertemperatuur) 20 C 20 C 10 C 27 C 0 C 33 C -10 C 38 C -20 C 43 C In Tabel worden de instellingen van de pompgroep van de zonnecollector van installatie1 weergegeven. Tabel 5.1.3: De instellingen voor de zonnecollector van installatie1. Afkorting Waarde Beschrijving DT E 9,5K Inschakeltemperatuurverschil van de pomp DT A 6,0K Uitschakeltemperatuurverschil van de pomp S MX 95 C Maximale temperatuur boiler NOT 115 C Noodtemperatuur collector KMN 25 C Minimum temperatuur collector Als aftapprofiel voor sanitair warm water werd het aftapprofiel van Task44 gebruikt (Michel Y. Haller, 2013). Het sanitair warm water wordt via een thermostatisch mengventiel op een temperatuur van 45 C afgetapt met een dag gemiddelde van ongeveer 140 l. In onderstaande Tabel worden het tapprofiel weergegeven: Tabel 5.1.4: Het aftapprofiel voor sanitair warm water van installatie1. Programma Van (uur:min:sec) Tot (uur:min:sec) Debiet [l/min] 1 7:00:00 7:03:36 11,85 2 8:00:00 8:00:57 11,85 3 9:00:00 9:00:57 11, :45:00 11:46:26 11,85 15
203 IWT-TETRA : Zongekoppelde Warmtepompsystemen Eindverslag Werkpakket 5: Meetcampagne systeemrendement Auteurs: Leen Goovaerts, Dries Van Aken, Maarten Sourbron 5 16:30:00 16:30:57 11, :00:00 19:02:09 11, :30:00 21:33:07 11, Principeschema Figuur 5.1.2:Het principeschema van installatie1. Het principeschema van installatie1 (Figuur 5.1.2) is een eenvoudige weergave van het hydraulisch schema. Deze installatie neemt warmte op vanuit de bodem(bron) en zon, hierbij verbruikt de installatie elektriciteit aan de zonnecollector(2), de compressor van de warmtepomp(1.1) en de regeling en sturing van de warmtepomp (1.2). De installatie geeft zijn warmte af via sanitair warm water en ruimte verwarming. De circulatiepomp tussen het buffervat van verwarming en de verwarming wordt niet opgemeten. Het verbruik van deze pomp wordt hierdoor ook niet mee in rekening gebracht bij de berekeningen. 16
204 IWT-TETRA : Zongekoppelde Warmtepompsystemen Eindverslag Werkpakket 5: Meetcampagne systeemrendement Auteurs: Leen Goovaerts, Dries Van Aken, Maarten Sourbron Flowchart Figuur 5.1.3: De flowchart van installatie1. Van installatie1 werd een flowchart opgesteld(figuur 5.1.3), waarbij de warmte- en elektriciteitsstromen tussen de verscheidene componenten voorgesteld. De flowchart geeft weer hoe de warmte opgewekt uit de bodemcollectoren wordt afgegeven aan de warmtepomp, waarbij de warmtepomp op zijn beurt de warmte opnieuw afgeeft aan het buffervat. De zonnecollectoren geven de opgewekte warmte vanuit de zon ook af aan het buffervat waarna het buffervat zijn warmte afgeeft aan de afgiftesystemen voor sanitair warm water en ruimteverwarming. 17
205 IWT-TETRA : Zongekoppelde Warmtepompsystemen Eindverslag Werkpakket 5: Meetcampagne systeemrendement Auteurs: Leen Goovaerts, Dries Van Aken, Maarten Sourbron Berekeningen SPF SPF TOT = Q RVWafgifte + Q SWWafgifte P SOL + P WP RVW + P WP SWW SPF WP = Q RVWopwek + Q SWWopwek P WP RVW + P WP SWW SPF sol = Q SOLopwek P SOL Q RVWafgifte SPF RVW = P SOL + P WP RVW Q SWWafgifte SPF SWW = P SOL + P WP SWW Zonnefractie Q SOLopwek f zontot = Q SWWafgifte + Q RVWafgifte Q SOLopwek f zontot opwek = Q SWWopwek + Q RVWopwek f zonnuttig opwek = Q SOLopwek Q SWWopwek Verliezen E vat = Q RVWafgifte + Q SWWafgifte (Q RVWopwek + Q SWWopwek + Q SOLopwek ) 18
206 IWT-TETRA : Zongekoppelde Warmtepompsystemen Eindverslag Werkpakket 5: Meetcampagne systeemrendement Auteurs: Leen Goovaerts, Dries Van Aken, Maarten Sourbron Bespreking Van deze installatie zijn geen meetresultaten beschikbaar, wegens problemen met de installatie. De warmtepomp was eerst aangesloten op de verticale bodemwarmtewisselaars. Echter na het opstarten van de installatie, werd opgemerkt dat de druk in de verticale bodemwarmtewisselaars te laag was. Na het opnieuw opvullen van de verticale bodemwarmtewisselaars, daalde de druk opnieuw. Voor zover de aansluitingen zichtbaar zijn werd geen lek ontdekt, maar op de verticale bodemwarmtewisselaar is geen expansievat aangebracht. Dit kan een mogelijke oorzaak zijn voor het drukverlies in de verticale bodemwarmtewisselaar vanwege de variërende temperaturen. Hierdoor kon de warmtepomp niet werken en zodus werd overgeschakeld op de horizontale bodemwarmtewisselaars. Hierna deed de installatie zijn werk, maar er werden enkele problemen vastgesteld met de meetapparatuur, namelijk de warmtemeters. Deze warmtemeters berekenen de hoeveelheid afgegeven of opgewekte warmte aan hand van 2 temperatuursensoren (aan- en afvoer) en een debietmeter. De data wordt intern in de meters opgeslagen om de 5 minuten en uitgelezen via een optisch oog. De problemen die hierbij werden ondervonden: De warmtemeter heeft intern een accumulerende volume- en warmteteller. Bij het uitlezen werd opgemerkt dat de stand van de volume- en warmteteller niet verandert over heel de periode dat data werd uitgelezen. De data van de volume- en warmteteller verschilt wel met de data van de uitgelezen periode ervoor. Het verschil tussen de data komt overeen met de opgewekte warmte en verbruikt volume van de eerste of laatste uitgelezen periode. De temperaturen werden ook over de hele periode niet correct weergegeven. Bij het controleren van de weergave op de display van de warmtemeters tijdens de perioden dat warmte werd opgewekt of afgegeven, bleek dat de warmtetellers wel correct werkten. De data werd enkel fout uitgelezen. Door de software voor elke meter tijdens uitlezing opnieuw op te starten kon dit probleem worden voorkomen. De volumeteller, waarmee het debiet wordt bepaald, geeft echter bij het uitlezen op onwillekeurige momenten een lagere waarde weer dan de voorgaande. Hierna telt de volumeteller opnieuw normaal op tot dit fenomeen zich opnieuw voordoet. Het debiet wordt bepaald door de warmtemeter aan de hand van het verschil in verbruikt volume van de volumeteller over de periode dat wordt uit gelezen (5minuten). Indien het verschil wordt genomen met het voorgaand volume en het huidige volume, resulteert dit verschil in een negatieve waarde om bij de warmteteller op te tellen. De warmteteller kan enkel positieve waarden optellen, waardoor deze waarde wordt genegeerd. Bij het uitlezen werden perioden opgemerkt waarbij geen data beschikbaar was in het geheugen van de warmtemeter of deze data niet kon worden uitgelezen. De leverancier en producent van deze warmtemeters weet de oorzaak niet van deze problemen en kon zodus ook geen oplossing voorleggen. 19
207 IWT-TETRA : Zongekoppelde Warmtepompsystemen Eindverslag Werkpakket 5: Meetcampagne systeemrendement Auteurs: Leen Goovaerts, Dries Van Aken, Maarten Sourbron 4.2 Overzicht installatie : Lucht/water wp Gegevens Tabel 5.1.5: De technische gegevens van installatie2. Type Warmtepomp Vermogen Warmtepomp Warmtepomp Lucht/water warmtewisselaar (Daikin, Altherma LT: ERLQ008CV3 en EHBX08C3V) 7,4 kw (7 C/35 C) Zonnecollectoren Type zonnecollector Vacuümbuis zonnecollector (Viessmann, Vitosol 200-T type SP2) Absorberoppervlakte 3,02 m² Hellingsgraad 45 Azimuthoek 180 Type buffer Volume buffervat sanitair Volume buffervat verwarming Buffer Gescheiden (Viessmann, Vitocell-B 100 type CVB) 300l 300l Tabel geeft de technische gegevens van installatie 2. De lucht/water warmtepomp heeft een vermogen van 7.4 kw. Deze warmtepomp bestaat uit twee units, namelijk een buiten- en binnenunit. De vacuümbuiszonnecollector heeft een absorberoppervlakte van 3.02 m 2 en staat gemonteerd onder een hellingshoek van 45. De zonnecollector staat georiënteerd volgens een azimuthoek van 180 (Zuiden). Het buffervat voor sanitair warm water en voor ruimteverwarming zijn identiek aan elkaar. Beide buffervaten hebben een volume van 300 l. 20
208 IWT-TETRA : Zongekoppelde Warmtepompsystemen Eindverslag Werkpakket 5: Meetcampagne systeemrendement Auteurs: Leen Goovaerts, Dries Van Aken, Maarten Sourbron Hydraulisch schema Figuur 5.1.4: Het hydraulisch schema van installatie2. In Figuur wordt het hydraulisch schema weergegeven van installatie2. De lucht/waterwarmtepomp is aangesloten aan twee afzonderlijke buffervaten. Via een driewegkraan, die gestuurd wordt vanuit de warmtepomp, levert de warmtepomp warmte aan ofwel het buffervat voor ruimteverwarming ofwel aan het buffervat voor sanitair warm water. De luchtgroep voor de ruimteverwarming van het labo is aangesloten aan de spiraal doorheen het buffervat voor ruimteverwarming. De zonnecollector is in deze installatie enkel aangesloten op het buffervat voor sanitair warm water, namelijk op de onderste spiraal doorheen het buffervat. De warmtepomp is aangesloten op de bovenste spiraal van het buffervat. De aansluitingen voor de aftap van sanitair warm water bevinden zich rechtstreeks op het buffervat. Ook op installatie2 werden drie elektrische meters aangesloten, namelijk twee voor het elektrisch verbruik van de warmtepomp en één voor het elektrisch verbruik van de pomp van de zonnecollector. Het elektrisch verbruik van de warmtepomp van beide meters wordt samen geteld. Het totaal elektrisch verbruik van de warmtepomp wordt opgesplitst in het verbruik van de warmtepomp voor sanitair warm water (P WP-SWW) en verwarming (P WP-RVW). Het opsplitsen van het elektrisch verbruik gebeurt door middel van het debiet opgemeten door de warmtemeters Q RVWopwek en Q SWWopwek. De warmtemeters berekenen ook bij deze installatie de hoeveelheid opgewekte of afgegeven warmte aan de hand van een debietsmeter en een temperatuursensor in de aanvoer- en retourleiding. Bij deze installatie wordt afzonderlijk opgemeten hoeveel warmte wordt opgewekt vanuit de warmtepomp voor het buffervat van ruimteverwarming en voor het buffervat van sanitair 21
209 IWT-TETRA : Zongekoppelde Warmtepompsystemen Eindverslag Werkpakket 5: Meetcampagne systeemrendement Auteurs: Leen Goovaerts, Dries Van Aken, Maarten Sourbron warm water op te warmen. De warmte die wordt afgegeven aan het sanitair warm water wordt opgemeten en ook de afgegeven warmte aan de ruimteverwarming. Tenslotte wordt de warmte opgewekt door de zonnecollector en opgeslagen in het buffervat voor sanitair warm water nog opgemeten door een vijfde warmte meter. Aan de hand van deze opgewekte en afgegeven warmte worden de mogelijke berekeningen uitgevoerd voor de verschillende SPF-waarden, zonnefracties en verliezen over de buffervaten. Deze meetwaarden worden om de 5 minuten opgeslagen door zowel de warmte- als de elektriciteitsmeters. De luchtgroep voor de ruimteverwarming van het labo werkt elke dag van 08.00uur tot 18.00uur en behoud de ruimte op 20 C. Aangezien op deze luchtgroep de twee installaties zijn aangesloten leveren deze alternerend om het uur warmte aan de luchtgroep. Zo voorziet installatie 2 om 08.00, 10.00, 12.00, 14.00, 16.00uur telkens een uur warmte voor de ruimteverwarming. De warmtepomp heeft twee afzonderlijke programma s voor de regeling van het opwarmen van de twee buffervaten. De regeling voor ruimteverwarming houdt het buffervat heel de dag door op een constante temperatuur van 35 C. Dit programma werkt aan de hand van de aanvoertemperatuur. Een interne circulatiepomp in de warmtepomp, langs de secundaire kant, circuleert heel de dag water tussen het buffervat en de warmtepomp. Indien de temperatuur in de aanvoer daalt onder 35 C, wordt de compressor in de warmtepomp opgestart om het buffervat opnieuw op te warmen. In de paragraaf Bespreking wordt deze regeling verder besproken. Voor het opwarmen van het buffervat voor sanitair warm water wordt een ander programma gebruikt. Hierbij wordt een temperatuur voor opslag comfort ingesteld van 50 C en een temperatuur voor opslag economisch van 45 C. Het programma heeft volgend tijdsprofiel: uur: opslag stop uur: opslag comfort uur: opslag stop uur: opslag eco Dit regime wordt elke dag doorlopen. De warmtepomp doorloopt ook een desinfectie-functie elke vrijdag om uur, waarbij voor een uur lang de warmtepomp het buffervat opwarmt tot 60 C. In Tabel worden de instellingen van de pompgroep van de zonnecollector van installatie1 weergegeven. Tabel 5.1.6: De instellingen voor de zonnecollector van installatie2. Afkorting Waarde Beschrijving DT E 8 C Inschakeltemperatuurverschil van de pomp DT A 4 C Uitschakeltemperatuurverschil van de pomp S SL 90 C Gewenste boilertemperatuur NOT 140 C Collector-grenstemperatuur 22
210 IWT-TETRA : Zongekoppelde Warmtepompsystemen Eindverslag Werkpakket 5: Meetcampagne systeemrendement Auteurs: Leen Goovaerts, Dries Van Aken, Maarten Sourbron Als aftapprofiel voor sanitair warm water werd het aftapprofiel van Task44 gebruikt (Michel Y. Haller, 2013). Het sanitair warm water wordt via een thermostatisch mengventiel op een temperatuur van 45 C afgetapt met een dag gemiddelde van ongeveer 140 l. In onderstaande Tabel worden het tapprofiel weergegeven: Tabel 5.1.7: Het aftapprofiel voor sanitair warm water van installatie2. Programma Van [uur:min:sec] Tot [uur:min:sec] Debiet [l/min] 1 7:00:00 7:03:36 11,85 2 8:00:00 8:00:57 11,85 3 9:00:00 9:00:57 11, :45:00 11:46:26 11, :30:00 16:30:57 11, :00:00 19:02:09 11, :30:00 21:33:07 11, Principeschema Figuur 5.1.5: Het principeschema van installatie2. Ook het principeschema van installatie2 (Figuur 5.1.5) is een eenvoudige weergave van het hydraulisch schema. Deze installatie neemt warmte op vanuit de lucht(bron) en zon, hierbij verbruikt de installatie elektriciteit aan de zonnecollector(2) en de warmtepomp(1.1 en 1.2). De installatie geeft zijn warmte af via sanitair warm water en ruimte verwarming. 23
211 IWT-TETRA : Zongekoppelde Warmtepompsystemen Eindverslag Werkpakket 5: Meetcampagne systeemrendement Auteurs: Leen Goovaerts, Dries Van Aken, Maarten Sourbron Flowchart Energy Flow Chart: DHW & Heating - Copyright IEA SHC-Task 44 / HPP-Annex38 Sun Ground Air Water Waste Heat Solar Collectors Ground Probes Air HX Water HX Waste HX Electricity Energy Carrier Heating Tank Cold Distrib. HP Heat Distrib. DHW Tank DHW Distrib. By: AIT EURAC Fraunhofer ISE SPF Figuur 5.1.6: De flowchart van installatie2. Van installatie2 (Figuur 5.1.6) werd ook een flowchart opgesteld, waarbij de warmte- en elektriciteitsstromen tussen de verscheidene componenten voorgesteld. De flowchart toont dat warmte wordt opgenomen uit de zon en wordt afgegeven aan het vat voor sanitair warm water (DHW Tank). De warmtepomp onttrekt warmte aan de buitenlucht. De warmte opgewekt door de warmtepomp wordt nadien af gegeven aan beide buffervaten voor sanitair warm water en ruimteverwarming (Heating Tank). De buffervaten geven op hun beurt de warmte opnieuw af aan de afgiftesystemen. 24
212 IWT-TETRA : Zongekoppelde Warmtepompsystemen Eindverslag Werkpakket 5: Meetcampagne systeemrendement Auteurs: Leen Goovaerts, Dries Van Aken, Maarten Sourbron Berekeningen SPF SPF TOT = Q RVWafgifte + Q SWWafgifte P SOL + P WP RVW + P WP SWW SPF WP = Q RVWopwek + Q SWWopwek P WP RVW + P WP SWW SPF sol = Q SOLopwek P SOL SPF RVW = Q RVWafgifte P WP RVW Q SWWafgifte SPF SWW = P SOL + P WP SWW Zonnefractie Q SOLopwek f zontot = Q SWWafgifte + Q RVWafgifte Q SOLopwek f zontot opwek = Q SWWopwek + Q RVWopwek f zonnuttig = Q SOLopwek Q SWWafgifte f zonnuttig opwek = Q SOLopwek Q SWWopwek Verliezen E vatcv = Q RVWafgifte Q RVWopwek E vatsww = Q SWWafgifte (Q SWWopwek + Q SOLopwek ) 25
213 IWT-TETRA : Zongekoppelde Warmtepompsystemen Eindverslag Werkpakket 5: Meetcampagne systeemrendement Auteurs: Leen Goovaerts, Dries Van Aken, Maarten Sourbron Meetresultaten Tabel 5.1.8: De meetresultaten voor installatie Totaal Psol (kwh) 2,53 6,41 6,85 6,97 22,76 PWP-RVW (kwh) 86,80 127,05 85,45 139,88 439,18 PWP-SWW (kwh) 25,99 14,41 7,55 12,54 60,49 QRVWafgifte (kwh) 123,03 288,40 135,57 442,16 989,16 QRVWopwek(kWh) 219,93 400,07 257,79 568, ,62 QSOLopwek (kwh) 14,33 38,19 43,85 42,36 138,73 QSWWafgifte (kwh) 93,17 158,69 153,12 167,54 572,52 QSWWopwek (kwh) 72,63 38,76 20,97 33,57 165,93 SPF tot 1,87 3,02 2,89 3,83 2,99 SPF wp 2,59 3,10 3,00 3,95 3,23 SPF SWW 3,27 7,62 10,64 8,59 6,88 SPF RVW 1,42 2,27 1,59 3,16 2,25 SPF sol 5,66 5,96 6,40 6,08 6,10 Zonnefractie tot (%) 6,63 8,54 15,19 6,95 8,88 Zonnefractie tot-opwek (%) 4,67 8,01 13,59 6, Zonnefractie nuttig (%) 15,38 24,07 28,64 25,28 24,23 Zonnefractie nuttig-opwek (%) 16,47 49,63 67,65 55,79 83,61 Verlies cv vat (kwh) -96,91-111,67-122,22-126,67-457,47 Verlies sanitair vat (kwh) 6,22 81,74 88,29 91,61 267,86 Gemiddelde maandtemperatuur ( C) 6,78 8,95 12,55 13,79 10,52 Zonnestraling (kwh/m 2 ) 30,28 79,82 112,04 131,35 353,49 Graaddagen 230,1 187,8 76,8 58,7 553,4 Neerslag (l/m 2 ) 59,2 15,4 22,0 71,2 167, Bespreking Volgens bovenstaande meetresultaten (Tabel 5.1.8) wordt een positief getal bekomen voor het verlies over het sanitair warm water vat. Dit betekent dat er meer warmte wordt afgegeven aan sanitair warm water dan dat er warmte wordt opgeslagen in het SWW-vat door de warmtepomp en zonnecollectoren. Dit is echter onmogelijk Fout in de meetdata Ter controle werd het programma in de warmtepomp voor het opwarmen van het CV-vat uitgeschakeld en ook het afgifte programma voor de verwarming, zodat alle opgewekte en afgegeven warmte enkel en alleen voor sanitair warm water was. Twee maal per dag werd 330 liter sanitair warm water afgetapt zodat het volledige volume van het SWW-vat(300liter) werd vervangen zoals zichtbaar in onderstaande tabel (Tabel 5.1.9). Overdag zijn ook de zonnecollectoren ingeschakeld voor het opwarmen van het SWW-vat. De aangepaste instellingen worden allemaal weergegeven in Tabel en de warmtemeters slagen om de minuut de meetwaarden op. 26
214 IWT-TETRA : Zongekoppelde Warmtepompsystemen Eindverslag Werkpakket 5: Meetcampagne systeemrendement Auteurs: Leen Goovaerts, Dries Van Aken, Maarten Sourbron Tabel 5.1.9: De aanpassingen aan de instellingen van installatie2. Tijd [uur] Actie Afgifte programma sanitair warm water: Aftappen Aftappen stoppen Aftappen Aftappen stoppen Warmtepomp programma sanitair warm water Comfort opwarmen Stoppen Comfort opwarmen Stoppen Dit leverde onderstaande resultaten voor 1 dag (19/06/2014): Tabel 5.1.0: De meetresultaten voor 1 dag, namelijk 19/06/2014, van installatie2, met enkel SWW-productie. Warmte-opwekking: QSOLopwek (kwh) 2,0 QRVWopwek (kwh) 0,0 QSWWopwek (kwh) 6,5 Warmte-afgifte: QSWWafgifte (kwh) 12,6 QRVWafgifte (kwh) 0,0 Elektrisch verbruik: PWP-RVW (kwh) 0,0 PWP-SWW (kwh) 2,60 PSOL (kwh) 0,35 Verlies sanitair vat (kwh) 4,1 In deze situatie wordt opnieuw een positief getal bekomen voor het verlies over het sanitair vat (Tabel ). Ook deze installatie ondervond echter problemen met de warmtemeters, namelijk: De volumeteller, die cumulatief het gepasseerde volume registreert, geeft bij het uitlezen op onwillekeurige momenten een lagere waarde weer dan de voorgaande. Hierna telt de volumeteller opnieuw normaal op tot dit fenomeen zich opnieuw voordoet. Dit resulteert in een negatief debiet voor de berekening van de opgewekte warmte. Bij het uitlezen werden perioden opgemerkt waarbij geen data beschikbaar was in het geheugen van de warmtemeter of deze data niet kon worden uitgelezen. De twee warmtemeters QRVWopwek en QSWWopwek geven weer hoeveel warmte vanuit de warmtepomp wordt geleverd aan respectievelijk het vat voor de ruimteverwarming en het vat voor het sanitair warm water. PWP-SWW en PWP-RVW geven het elektrisch verbruik van de warmtepomp voor het opwarmen van beide vaten. Bij de vergelijking van QRVWopwek en QSWWopwek met het elektrisch verbruik werd opgemerkt dat vanaf april 27

215 IWT-TETRA : Zongekoppelde Warmtepompsystemen Eindverslag Werkpakket 5: Meetcampagne systeemrendement Auteurs: Leen Goovaerts, Dries Van Aken, Maarten Sourbron 2014 op regelmatige tijdstippen problemen met de meetdata ontstaan. De meetdata van QRVWopwek verschuiven in tijd waardoor de momenten, wanneer warmte wordt opgewekt, niet overeen komen met wanneer elektriciteit wordt verbruikt om deze warmte op te wekken. Het interval waarmee deze data verschuift varieert tussen 30 tot 50 minuten. Figuur toont het elektrische verbruik van de warmtepomp voor ruimteverwarming en de opgewekte warmte voor ruimteverwarming van de warmtepomp. De pieken voor het elektrisch verbruik en opgewekte warmte komen altijd overeen tot en met iets na de middag van 09/04/2014. Vanaf dit moment overlappen de pieken elkaar niet meer. De 2 temperatuursensoren voor de retourtemperatuur T2 van de twee warmtemeters QRVWopwek (T2rvw) en QSWWopwek (T2sww) bevinden zich in dezelfde retourleiding vlak achter elkaar. In de meetdata worden echter niet dezelfde meetwaarden opgemeten voor deze twee sensoren. (Zie onderstaande grafieken: Figuur 5.1.8en Figuur 5.1.9) Bij het aanpassen van het interval waarover data moet worden opgeslagen van 5 minuten naar 1minuut, werd opgemerkt niet elke minuut de correcte temperatuur werd uitgelezen (zie Figuur 5.1.8). T1 en T2 voor QSWWopwek werken correct en stijgen elke minuut tijdens de aanmaak van sanitair warm water, maar eenmaal geen sanitair warm water meer wordt aangemaakt wordt ook de temperaturen niet correct uitgelezen elke minuut. Bij het manueel controleren wordt wel elke minuut een andere temperatuur uitgelezen, maar bij het uitlezen via het optisch oog daalt en stijgen de temperaturen in stappen van 10 minuten. Figuur 5.1.7: De tijdsverschuiving van de meetwaarden voor installatie2. 28
216 IWT-TETRA : Zongekoppelde Warmtepompsystemen Eindverslag Werkpakket 5: Meetcampagne systeemrendement Auteurs: Leen Goovaerts, Dries Van Aken, Maarten Sourbron Figuur 5.1.3: Het gedrag van de temperatuursensoren. 29
217 IWT-TETRA : Zongekoppelde Warmtepompsystemen Eindverslag Werkpakket 5: Meetcampagne systeemrendement Auteurs: Leen Goovaerts, Dries Van Aken, Maarten Sourbron Figuur 5.1.9: Het verschil tussen de temperatuursensoren. De leverancier en producent van deze warmtemeters weet de oorzaak niet van deze problemen en zodus ook geen oplossing. Deze problemen met de meters of de uitlezing van de meters kan de oorzaak zijn van het bekomen van een warmtewinst in plaats van warmteverlies over het sanitair warm water vat. Dit betekent dan echter wel dat de meetwaarden voor deze installatie niet betrouwbaar zijn Circulatiepomp van de warmtepomp Bij de elektriciteitsmeters werden echter geen problemen vastgesteld. Wel werd opgemerkt dat er een zeer hoog elektrisch verbruik was van de warmtepomp voor ruimteverwarming. De oorzaak hiervan was het aansturingprogramma van de warmtepomp om het vat voor ruimteverwarming op te warmen. De warmtepomp werd geregeld aan de hand van de temperatuur in de aanvoer van de warmtepomp naar het RVW-vat. De warmtepomp heeft hiervoor continu debiet nodig in de aanvoerleiding om telkens de juiste temperatuur op te meten. De circulatiepomp in de warmtepomp stond om deze reden continu aan zodat de aanvoertemperatuur kon worden gemeten. Indien de temperatuur te laag wordt, start de compressor van de warmtepomp om het vat op te warmen. Voor de installatie in het laboratorium resulteert dit aansturingprogramma in extra verliezen over de leidingen tussen de warmtepomp en het buffervat en een hoger elektrisch verbruik. Deze leidingen zijn echter niet geïsoleerd. De warmtepomp heeft nog twee andere aansturingprogramma s, waarbij 30


218 IWT-TETRA : Zongekoppelde Warmtepompsystemen Eindverslag Werkpakket 5: Meetcampagne systeemrendement Auteurs: Leen Goovaerts, Dries Van Aken, Maarten Sourbron een aansturing via een temperatuursensor in het RVW-vat is meest aangewezen is voor deze installatie. Deze aanpassing is niet tijdig kunnen worden uitgevoerd om hier meetdata van beschikbaar te kunnen stellen. Echter wanneer het elektrisch verbruik van de warmtepomp in detail wordt bestudeerd, is een duidelijk verschil zichtbaar tussen het elektrisch verbruik tijdens de periode dat de compressor aanstaat en wanneer de compressor niet aanstaat. Hieronder wordt een vergelijking gemaakt van het elektrisch verbruik met of zonder circulatiepomp. Deze resultaten zijn geen exacte meetwaarden, maar geven een indicatie van de invloed van de circulatiepomp. De meetwaarden voor de warmtemeters worden ook weergegeven, dit enkel ter illustratie van de invloed van de circulatiepomp. In Figuur wordt in detail weergegeven hoeveel warmte (QRVWopwek) wordt opgewekt/afgegeven in de tijd en hoeveel elektriciteit (PWP-RVW) wordt verbruikt in de tijd. De piek in het elektrisch verbruik van bijna 0,3 kwh vertegenwoordigt het verbruik van de compressor en circulatiepomp en het elektrisch verbruik van ongeveer 0.01 kwh stelt enkel het verbruik van de circulatiepomp voor. Op de grafiek is zichtbaar dat nadat de compressor is gestopt, QRVWopwek een negatieve waarde krijgt. Dit betekent dat de aanvoertemperatuur kleiner is dan de retourtemperatuur. Dit heeft als gevolg dat er warmteverlies op treedt vanuit het buffervat tijdens de periode dat de circulatiepomp aanstaat. 31
219 IWT-TETRA : Zongekoppelde Warmtepompsystemen Eindverslag Werkpakket 5: Meetcampagne systeemrendement Auteurs: Leen Goovaerts, Dries Van Aken, Maarten Sourbron Figuur : De invloed van de circulatiepomp. Tijdens de perioden dat enkel de circulatiepomp aanstaat, worden retro-actief in de meetbestanden de waarden voor QRVWopwek en PWP-RVW op nul gezet. Zo wordt het elektrisch verbruik en de opgewekte/afgegeven warmte door enkel de circulatiepomp verwijderd. Dit heeft onderstaande Tabel als resultaat voor de periode 01 tot 07/04/2014: 32
220 IWT-TETRA : Zongekoppelde Warmtepompsystemen Eindverslag Werkpakket 5: Meetcampagne systeemrendement Auteurs: Leen Goovaerts, Dries Van Aken, Maarten Sourbron Tabel : De invloed van de circulatiepomp voor een periode van 01 tot 07/04/2014. Met circulatiepomp Zonder circulatiepomp PSOL (kwh) 1,42 PWP-RVW (kwh) 16,25 9,38 PWP-SWW (kwh) 2,25 QRVWafgifte (kwh) 33,88 QRVWopwek (kwh) 36,61 37,45 QSOLopwek (kwh) 8,71 QSWWafgifte (kwh) 35,98 QSWWopwek (kwh) 6,72 SPF TOT 3,51 5,35 SPF WP 2,34 3,80 SPF RVW 2,09 3,61 Gemiddelde dagtemperatuur 14,4 ( C) Zonnestraling (kwh/m 2 ) 21,48 Graaddagen 6,1 De Q- en SPF-waarden in de Tabel zijn indicatief en worden enkel getoond om aan te tonen hoe ze beïnvloed worden door de regeling van de circulatiepomp. De P-waarden met circulatiepomp voor het elektrisch verbruik zijn wel correct en de P-waarden zonder circulatiepomp zijn een indicatie van wat ongeveer elektrisch gaat verbruikt worden. Zonder de circulatiepomp halveert het elektrisch verbruik voor ruimteverwarming bijna. Dit heeft een zeer gunstig effect op de verschillende SPFwaarden. De weeromstandigheden hebben een invloed op de verbetering van de SPF. Indien het kouder is dan tijdens de periode van 01 tot 07/04/2014, moet de warmtepomp meer warmte opslagen in het buffervat voor ruimteverwarming. Hierdoor gaat de compressor meer moeten aanstaan. Dit heeft als gevolg dat de periode dat enkel de circulatiepomp aanstaat kleiner wordt. Het aansturingprogramma met een continu draaiende circulatiepomp is nuttig indien de compressor veel aanstaat, maar wanneer deze weinig aanstaat wordt veel elektrische én thermische energie verspild. Het is aangewezen een ander stuurprogramma te gebruiken met een temperatuursensor in het buffervat. Indien in de installatie geen buffervat aanwezig is voor ruimteverwarming, is het mogelijk de temperatuursensor in de te verwarming ruimte te plaatsen. 33
221 IWT-TETRA : Zongekoppelde Warmtepompsystemen Eindverslag Werkpakket 5: Meetcampagne systeemrendement Auteurs: Leen Goovaerts, Dries Van Aken, Maarten Sourbron 4.3 Besluit Vanwege de problemen met de meetapparatuur zoals hierboven beschreven, kan geen besluit gevormd worden in verband met de meetresultaten uit de installaties uit het labo. Wel kan geconcludeerd worden dat het correct instellen en regelen van de installatie een grote impact heeft op het rendement. Als voorbeeld dient installatie 2 en het kiezen van het juiste sturingsprogramma om warmte op te slaan in het buffervat voor ruimteverwarming. Deze keuze heeft een grote invloed op het elektrisch verbruik van de installatie en beperkt de warmteverliezen. Beide komen het rendement van een installatie ten goede. Voor een goede energiemonitoring van een warmtepomp installatie is het belangrijk om alle nodige warmtestromen op te meten: de warmte afkomstig van de bron, de warmte opgewekt door de warmtepomp, opgenomen en afgeven warmte van de buffervaten, afgegeven warmte van de afgiftesystemen en de warmte opgewekt door de zonnecollectoren. Ook het elektrisch verbruik van de installatie is van cruciaal belang en indien mogelijk het elektrisch verbruik van alle componenten apart. Het gebruik van de juiste meetapparatuur is belangrijk, maar ook het kiezen van een goede data-acquisitie. Deze moet kunnen voldoen aan de gewenste eisen. 34
222 IWT-TETRA : Zongekoppelde Warmtepompsystemen Eindverslag Werkpakket 5: Meetcampagne systeemrendement Auteurs: Leen Goovaerts, Dries Van Aken, Maarten Sourbron 5 WP5T2: Metingen in situ In het ZonWarmproject zijn 4 zongekoppelde warmtepompsystemen op locatie betrokken. Dit zijn installaties in Betekom, Beverlo, Lede en Noorderwijk. Hierbij vindt u een verslag met de gegevens van de installaties en woningen, de hydraulische schema s, principeschema s, flowcharts, meetresultaten en bespreking per locatie. Bij een aantal installaties zijn ook enkele problemen opgedoken. Deze problemen zijn ook gedocumenteerd in het verslag. Bij de meetresultaten die voorgesteld worden, zijn onder andere enkele weergegevens te vinden. Deze weergegevens zijn opgesplitst in enerzijds de gemeten waarden in die welbepaalde maand in 2013 of 2014 en anderzijds het langjarig gemiddelde van die maand. De gemeten waarden zijn afkomstig van een particulier weerstation in Mechelen. De weersomstandigheden zijn dus niet per locatie opgemeten, maar de voorgestelde weerdata zijn wel een indicatie voor de weersomstandigheden over heel Vlaanderen in die maand. Het langjarig gemiddelde per maand is berekend over 30 jaar, voor de periode van 1981 tot In de loop van deze periode is wel een duidelijke stijging te zien van temperatuur en zonne-instraling en overeenkomstig een daling van het aantal graaddagen. De zonne-instraling die weergegeven wordt, is gemeten op een horizontaal oppervlak. Bij de interpretatie van de metingen en berekeningen moet er ook rekening gehouden worden met de eigenschappen van de meters. De invloed van de fout van de warmtemeters wordt weergegeven in figuur Verder werken de elektriciteitsmeters met 1 puls per kwh, waardoor kleinere verbruiken soms moeilijk te detecteren zijn. De meetresultaten worden om de 30 minuten doorgestuurd, waardoor het niet te detecteren valt wanneer juist binnen dat half uur er warmte geproduceerd of verbruikt is. Wanneer het elektriciteitsverbruik opgesplitst wordt om de EER of SPF reg te berekenen (voor de formules hiervan, zie Berekeningen ), wordt hier waarschijnlijk steeds een kleine fout gemaakt aangezien het verbruik van de circulatiepompen vaak niet zichtbaar is binnen de gemeten periode van een half uur. In het algemeen kan gesteld worden dat een zongekoppeld warmtepompsysteem zeker niet ingewikkeld hoeft te zijn om goede resultaten te genereren. Een SPF van 4,5 kan gemakkelijk behaald worden met eenvoudige systemen, zoals in Beverlo. Wanneer het systeem uitgebreid wordt en de zonnewarmte ook gebruikt wordt voor vloerverwarming, zoals in Noorderwijk, kan de SPF oplopen tot 8 in sommige maanden. 35
223 IWT-TETRA : Zongekoppelde Warmtepompsystemen Eindverslag Werkpakket 5: Meetcampagne systeemrendement Auteurs: Leen Goovaerts, Dries Van Aken, Maarten Sourbron 5.1 Overzicht Betekom Gegevens Tabel 5.2.1: De technische gegevens van de installatie in Betekom Type Warmtepomp Vermogen Warmtepomp Warmtepomp Verticale bodemwarmtewisselaar (Viessmann, 300G) 6,85 kw (0 C/35 C) Zonnecollectoren Type zonnecollector Vlakkeplaatcollector Absoberoppervlakte 10 m² Hellingsgraad 35 Azimuthoek 11 Buffer Type buffer Gescheiden Volume buffervat sanitair 500 l Volume buffervat verwarming 300 l Woning K-peil 16 E-peil -18 Verwarmde oppervlakte 246 m² 36
224 IWT-TETRA : Zongekoppelde Warmtepompsystemen Eindverslag Werkpakket 5: Meetcampagne systeemrendement Auteurs: Leen Goovaerts, Dries Van Aken, Maarten Sourbron Hydraulisch schema Figuur 5.2.1: Het hydraulisch schema van de installatie in Betekom 37
225 IWT-TETRA : Zongekoppelde Warmtepompsystemen Eindverslag Werkpakket 5: Meetcampagne systeemrendement Auteurs: Leen Goovaerts, Dries Van Aken, Maarten Sourbron Principeschema Figuur 5.2.2: Het principeschema van de installatie in Betekom Flowchart Energy Flow Chart: DHW & Heating - Copyright IEA SHC-Task 44 / HPP-Annex38 Sun Ground Air Water Waste Heat Solar Collectors Ground Probes Air HX Water HX Waste HX Electricity Primary Storage Rejection Storage Energy Carrier Water Tank Cold Distrib. HP Heat Distrib. DHW Tank DHW Distrib. Secondary Storage By: AIT EURAC Fraunhofer ISE SPF Figuur 5.2.3: De flowchart van de installatie in Betekom 38
226 IWT-TETRA : Zongekoppelde Warmtepompsystemen Eindverslag Werkpakket 5: Meetcampagne systeemrendement Auteurs: Leen Goovaerts, Dries Van Aken, Maarten Sourbron Berekeningen SPF SPF TOT+ (Afgifte cv vloerverwarming (nr )) + (Koud warm water (nr )) = Totaal elek verbruik wp (nr ) SPF TOT = (Afgifte cv vloerverwarming (nr )) + (Koud warm water (nr )) Totaal elek verbruik wp (nr ) Pomp cv afgifte (nr ) SPF SWW+ = SPF RVW+ = (Koud warm water (nr )) Totaal elek verbruik wp SWW (Afgifte cv vloerverwarming (nr )) Totaal elek verbruik wp RVW SPF WP Verbruik san (nr ) + (Sec wp buffervat (nr )) = Totaal elek verbruik wp (nr ) Pomp cv afgifte (nr ) Pomp prim circ zonneboiler (nr ) SPF WP SWW+ = SPF WP RVW+ = Verbruik san (nr ) Totaal elek verbruik wp SWW (Sec wp buffervat (nr )) Totaal elek verbruik wp RVW (Prim wp (bi dir) (nr )) SPF WP grond+ = 1 + Totaal elek verbruik wp (nr ) SPF WP alg+ (Sec wp buffervat (nr )) + Verbruik san (nr ) = (Sec wp buffervat (nr )) + Verbruik san (nr ) (Prim wp (bi dir) (nr )) SPF zon = SPF Reg+ = (Prim zoncoll = totaal (nr )) Pomp prim circ zonneboiler (nr ) (Prim wp (bi dir) (nr )) Totaal elek verbruik wp (nr ) SPF Reg enkel op het moment dat de regeneratie plaatsvindt (op dat moment draaien enkel de circulatiepompen). 39
227 IWT-TETRA : Zongekoppelde Warmtepompsystemen Eindverslag Werkpakket 5: Meetcampagne systeemrendement Auteurs: Leen Goovaerts, Dries Van Aken, Maarten Sourbron Zonnefractie f zon = (Prim zoncoll = totaal (nr )) (Afgifte cv vloerverwarming (nr )) + (Koud warm water (nr )) 100% (Prim zoncoll = totaal (nr )) f zon opwek = (Prim zoncoll = totaal (nr )) + Verbruik san (nr ) + (Sec wp buffervat (nr )) 100% f zon SWW = f zon RVW = (Prim zonneboil san vat (nr )) 100% (Koud warm water (nr )) (Prim zonneboil cv vat (nr )) (Afgifte cv vloerverwarming (nr )) 100% Verliezen E RVW vat = ( Afgifte cv vloerverwarming (nr )) [(Sec wp buffervat (nr )) + (Prim zonneboil cv vat (nr ))] E SWW vat = ( Koud warm water (nr )) [Verbruik san (nr ) + (Prim zonneboil san vat (nr ))] E WP = [(Sec wp buffervat (nr )) + Verbruik san (nr )] [(Prim wp (bi dir)(nr )) + Totaal elek verbruik wp (nr )] E systeem = [Afgifte cv vloerverwarming (nr ) + Koud warm water (nr )] (Prim wp (bi dir)(nr )) + Totaal elek verbruik wp (nr ) [ ] +(Prim zoncoll = totaal (nr )) 40
228 IWT-TETRA : Zongekoppelde Warmtepompsystemen Eindverslag Werkpakket 5: Meetcampagne systeemrendement Auteurs: Leen Goovaerts, Dries Van Aken, Maarten Sourbron Meetresultaten Tabel 5.2.2: De meetresultaten voor de installatie in Betekom mrt/14 apr/14 mei/14 jun/14 totaal Afgifte cv vloerkoel. + verw. (kwh) Afgifte cv - vloerverwarming (kwh) Koud-warm water (kwh) Pomp cv afgifte (kwh) Pomp prim circ zonneboiler(kwh) Prim WP (bi-dir) (kwh) 85,3 0/24,5 0,3/308,2 1/371,2 86,6 (Verwarming/koeling) Prim zoncoll = totaal (kwh) 455,5 433,3 597,1 679,6 2165,5 Prim zonneboil cv vat (kwh) 232,8 227,6 174,2 196,7 831,3 Prim zonneboil san vat (kwh) 180,4 146, ,3 605,5 Sec WP buffervat (kwh) Totaal elek verbruik WP (kwh) Verbruik san (kwh) Zonne-instraling (kwh/m²) 79, ,35 146,36 469,53 Langjarig gemiddelde - zonneinstraling 70,99 111,14 143,29 147,05 472,47 (kwh/m²) Aantal graaddagen 187,8 76,8 58,7 4,77 328,07 Langjarig gemiddelde - aantal 259,22 168,21 71,71 26,11 525,25 graaddagen Gemiddelde temperatuur ( C) 8,85 12,55 13,79 16,73 12,98 Langjarig gemiddelde - gemiddelde temperatuur ( C) 6,31 9,35 13,49 16,15 11,33 SPF tot+ 5,05 3,45 1,76 1,93 3,03 SPF tot 5,56 3,7 1,9 1,98 3,23 SPF SWW ,00 SPF RVW+ 4,95 3,1 1,62 1,9 2,87 SPF wp+ 3,27 0,07 0,04 0 1,08 SPF wp SWW ,00 SPF wp RVW+ 2, ,63 SPF wp grond+ 2,98 1 1,01 1,02 1,56 SPF wp alg+ 7,72 1 1,43 0 7,46 SPF zon 50,61 36,11 39,81 39,98 40,86 SPF regeneratie 0 0 7,34 8,84 8,09 Zonnefractie tot (%) 209,91 433,3 806,89 839,01 458,79 Zonnefractie opwek (%) 82,29 99,77 99, ,59 Zonnefractie SWW (%) ,92 Zonnefractie RVW (%) 109,3 261,6 256,2 245,88 185,56 41
 -176,4-134,8-136 -136,3-583,50 Verlies WP (kwh) -30,3-28 -41,3-43 -142,60 Verlies systeem (kwh) -366,8-362,3-565,4-641,6-1936,10 5.1.7 Bespreking De woning in Betekom is nog niet bewoond.")

229 IWT-TETRA : Zongekoppelde Warmtepompsystemen Eindverslag Werkpakket 5: Meetcampagne systeemrendement Auteurs: Leen Goovaerts, Dries Van Aken, Maarten Sourbron Verlies cv vat (kwh) -117,8-140,6-106,2-116,7-481,30 Verlies sanitair vat (kwh) -176,4-134, ,3-583,50 Verlies WP (kwh) -30, , ,60 Verlies systeem (kwh) -366,8-362,3-565,4-641,6-1936, Bespreking De woning in Betekom is nog niet bewoond. Hierdoor staat de inhoud van de buffervaten het merendeel van de tijd stil, wat het grote verlies kan verklaren. Dit verklaart ook de lagere SPF voor de maand april. Er is te weinig afname om een realistisch beeld van de installatie te verkrijgen. In deze woning is meer dan voldoende zonne-energie voorhanden om te voorzien in energiebehoefte. Hierdoor moet de warmtepomp weinig werk leveren Verschil tussen meters In Betekom is er een duidelijk verschil in energie tussen de meter Afgifte cv vloerverwarming en Afgifte cv vloerkoel. + verw. Het verschil in energie bedraagt maandelijks ongeveer 80 kwh, of ongeveer 20% van de totaal opgewekte energie, ondanks dat beide meters op dezelfde leiding staan, enkel met een driewegkraan tussen. Door de installatie volledig onder de loep te nemen en een aantal testen uit te voeren op de installatie, is een verklaring gevonden voor het verlies in energie. Na grondig testen, blijkt namelijk dat de driewegkraan niet volledig afsluit wanneer ze in gesloten stand staat en er dus geen debiet naar de vloerverwarming mag gaan. Hierdoor ontstaat erdoor thermosyfon-werking een lekdebiet van de aanvoer- naar de retourleiding, waardoor dit deel van de leiding altijd warm is. Dit verklaart het warmteverlies Regeneratie Aangezien de woning in Betekom onbewoond is, is ook de koeling van de installatie nog niet ingesteld. Dat wil zeggen dat de koeling die te zien is in de meter Prim WP (bi-dir) enkel regeneratie is en dus rechtstreekse warmte van de zon gebruikt om te regenereren. Dit is ook duidelijk te zien aan de energiemeter Prim zoncoll = totaal, deze is namelijk ongeveer gelijk aan de som van Prim zonneboil cv vat, Prim zonneboil san vat en de koeling van Prim WP (bi-dir). Er is dus geen extra energie die in de bodem gepompt wordt afkomstig van vloerkoeling. 42
230 Maximale fout (%) IWT-TETRA : Zongekoppelde Warmtepompsystemen Eindverslag Werkpakket 5: Meetcampagne systeemrendement Auteurs: Leen Goovaerts, Dries Van Aken, Maarten Sourbron Wanneer echter de som gemaakt wordt van Prim zonneboil cv vat, Prim zonneboil san vat en de koeling van Prim WP (bi-dir) en deze vergeleken wordt met Prim zoncoll = totaal, blijkt dat er ongeveer 25 kwh meer energie in de bodem gepompt wordt, dan dat de zon naar de bodem stuurt. Dit kan verklaard worden door het grote temperatuurverschil bij de zonnecollector en het kleine temperatuurverschil bij de bodem. Het verschil bij de zonnecollector tussen de vertrekkende en de retourleiding bedraagt gemiddeld ongeveer 15K, bij de grond bedraagt dit verschil echter slechts 2K. Wanneer je hierbij dan ook nog eens figuur bekijkt, die de fout van de warmtemeter voorstelt in functie van het temperatuurverschil, is het al duidelijk dat er een groot procentueel verschil is tussen een verschil in temperatuur van 2K en 15K. In de specificaties van de warmtemeters is bovendien ook terug te vinden dat de ondergrens van de warmtemeters ligt bij een temperatuurverschil van 3K. Dus wanneer er in de bodem slechts een temperatuurverschil gemeten wordt van 2K, is er geen garantie over de correctheid van de meetdata. In figuur zijn de rode vierkantjes de voorstelling van het verschil in temperatuur van de vertrek en retour van de zonnecollectoren en de oranje driehoeken van de bodem. Zo is duidelijk te zien dat de meeste meetpunten van de bodem zich in het gebied voor de rode lijn bevinden en bijgevolg buiten het meetbereik van de meter. 3 Fout van de warmtemeters Zon Bodem Grens ΔT (K) Figuur 5.2.4: Fout op warmtemeters Lage energiewoning Het huis in Betekom wordt bestempeld als een lage energiewoning. Bijvoorbeeld wanneer de zon laag staat, zoals vaak het geval is in de winter, wordt de woning opgewarmd door de zonnestraling op het glas. Op zo n moment is er geen extra energievoorziening nodig. In het tussenseizoen, wanneer de zon voldoende warmte levert om de buffervaten op temperatuur te houden, wordt het huis verwarmd met de energieverliezen. De warmte die de leidingen en buffervaten afgeven, is voldoende voor de verwarming van het huis. 43
231 IWT-TETRA : Zongekoppelde Warmtepompsystemen Eindverslag Werkpakket 5: Meetcampagne systeemrendement Auteurs: Leen Goovaerts, Dries Van Aken, Maarten Sourbron 44
232 IWT-TETRA : Zongekoppelde Warmtepompsystemen Eindverslag Werkpakket 5: Meetcampagne systeemrendement Auteurs: Leen Goovaerts, Dries Van Aken, Maarten Sourbron 5.2 Overzicht Beverlo Gegevens Tabel 5.2.3: De technische gegevens van de installatie te Beverlo Type Warmtepomp Vermogen Warmtepomp Warmtepomp Verticale bodemwarmtewisselaar (Viessmann, 242G) 10 kw (0 C/35 C) Zonnecollectoren Type zonnecollector Vlakkeplaatcollector Absoberoppervlakte 4,76 m² Hellingsgraad 45 Azimuthoek 90 Buffer Type buffer Gescheiden Volume buffervat sanitair 220 l Volume buffervat verwarming / Woning K-peil 26 E-peil 26 Verwarmde oppervlakte 250 m² Hydraulisch schema Figuur 5.2.5: Het hydraulisch schema van de installatie in Beverlo 45
233 IWT-TETRA : Zongekoppelde Warmtepompsystemen Eindverslag Werkpakket 5: Meetcampagne systeemrendement Auteurs: Leen Goovaerts, Dries Van Aken, Maarten Sourbron Principeschema Figuur 5.2.6: Het principeschema van de installatie in Beverlo Flowchart Energy Flow Chart: DHW & Heating - Copyright IEA SHC-Task 44 / HPP-Annex38 Sun Ground Air Water Waste Heat Solar Collectors Ground Probes Air HX Water HX Waste HX Electricity Primary Storage Rejection Storage Energy Carrier Water Tank Cold Distrib. HP Heat Distrib. DHW Tank DHW Distrib. Secondary Storage By: AIT EURAC Fraunhofer ISE SPF Figuur 5.2.7: De flowchart van de installatie in Beverlo 46
234 IWT-TETRA : Zongekoppelde Warmtepompsystemen Eindverslag Werkpakket 5: Meetcampagne systeemrendement Auteurs: Leen Goovaerts, Dries Van Aken, Maarten Sourbron Berekeningen Sanitair warm water (nr ) + Vloerverwarming (nr ) SPF TOT+ = Viessmann (nr ) f zon = f zon nuttig = Zonnecollector (nr ) Sanitair warm water (nr ) + Vloerverwarming (nr ) 100% Meetresultaten Zonnecollector (nr ) Sanitair warm water (nr ) 100% Tabel 5.2.4: De meetresultaten voor de installatie in Beverlo nov/13 dec/13 jan/14 feb/14 mrt/14 apr/14 mei/14 jun/14 Totaal Sanitair warm water (kwh) Vloerverwarming (kwh) Totale warmtevraag (kwh) Zonnecollector 3,7 3,6 3,8 18,4 119,4 165,4 174,8 214,6 703,7 (kwh) Warmtepomp (kwh) Zonne-instraling 15,92 15,29 17,58 30,28 79, ,35 146,36 548,6 (kwh/m²) Langjarig 25,04 15,49 21,81 37,18 70,99 111,14 143,29 147,05 571,99 gemiddelde - zonneinstraling (kwh/m²) Aantal graaddagen 251,7 283,6 273,2 230,1 187,8 76,8 58,7 4, ,6 Langjarig gemiddelde - aantal graaddagen Gemiddelde temperatuur ( C) Langjarig gemiddelde - gemiddelde temperatuur ( C) 251,34 346,61 367,34 324,83 259,22 168,21 71,71 26, ,3 6,61 5,85 6,19 6,78 8,85 12,55 13,79 16,73 9,67 6,42 3,46 2,75 3,05 6,31 9,35 13,49 16,15 7,62 SPFtot+ 4,53 4,46 4,42 4,41 4,75 4,46 5 8,92 4,55 Zonnefractietot (%) 0,21 0,17 0,19 0,98 9,98 57,03 65,96 96,23 7,23 Zonnefractienuttig (%) 1,56 1,19 1,24 6,5 39,41 61,72 69,09 99,35 32, Bespreking Door het feit dat deze zonwarmtepomp een geïntegreerde installatie is, konden er geen interne metingen uitgevoerd worden: aparte elektriciteitsverbruik van de warmtepomp of pompen, aparte 47
235 Warmte (kwh) IWT-TETRA : Zongekoppelde Warmtepompsystemen Eindverslag Werkpakket 5: Meetcampagne systeemrendement Auteurs: Leen Goovaerts, Dries Van Aken, Maarten Sourbron warmtemeters op de circuits WP-RV en WP-SWW,... Dit beperkt de meetset van deze installatie. Niettemin kunnen er relevante conclusies getrokken worden. De zonnefractie neemt duidelijk toe bij toenemende zonne-instraling. In de zomer, wanneer de zonne-instraling het hoogst is, zou deze voldoende moeten zijn om te voorzien in de warmte voor het sanitair warm tapwater, in juni is er namelijk een nuttige zonnefractie van 99%. Deze installatie behaalt een goed rendement, dat duidelijk wordt uit de berekende SPF en. Toch mag de SPF niet als enige maatstaaf gebruikt worden om de installatie te beoordelen. Het geheel moet bekeken worden. De hoeveelheid energie die van de zon komt, zorgt namelijk voor een betere SPF van het hele systeem, maar in principe verlaagt dit de SPF van de warmtepomp op zich Warmtevraag Sanitair warm water (kwh) Vloerverwarming (kwh) Totale warmtevraag (kwh) 0 Maand Figuur 5.2.8: De warmtevraag van de installatie in Beverlo Uit bovenstaande grafiek blijkt duidelijk dat de warmtevraag voornamelijk afhangt van de vloerverwarming. Het verbruik van sanitair warm water blijft over de gemeten periode ongeveer constant. De daling van de SPF in april ten opzichte maart kan verklaard worden door bovenstaande grafiek. In april moet er nagenoeg enkel nog water geleverd worden op hoge temperatuur voor het sanitair warm water. De zon voorziet voor ongeveer 62% in de energie voor het sanitair warm water. Dit wil zeggen dat de warmtepomp nog 38% van de energie voor het sanitair warm water moet voorzien en amper energie voor vloerverwarming. Hierdoor moet de warmtepomp op hogere temperatuur presteren, wat voor een lagere SPF zorgt. Figuur toont de SPF+ en de zonnefractie voor de installatie van Beverlo. Hieruit volgt dat de SPF inderdaad niet stijgt bij stijgende zonnefractie. Dit komt omdat de stijging van de SPF door de stijging van het aandeel zon tenietgedaan wordt doordat de warmtepomp aan een lagere SPF werkt. Door de aard van de installatie (volledige installatie geïntegreerd in 1 toestel) kon dit echter niet met 48
236 IWT-TETRA : Zongekoppelde Warmtepompsystemen Eindverslag Werkpakket 5: Meetcampagne systeemrendement Auteurs: Leen Goovaerts, Dries Van Aken, Maarten Sourbron metingen aangetoond worden. Bij de installatie in Noorderwijk is dit wel bewezen aan de hand van de metingen. Uit de maanden waarin er geen warmtevraag is (april-juni 2014) blijkt dat de zonnecollectoren met een SPF van resp. 4.5, 5 en 8.9 werken. Dit is een gemiddelde van 6 voor deze drie maanden. Figuur 5.2.9: SPF+ en zonnefractie van de installatie in Beverlo Conclusies Zonwarmtepomp met zonnecollectoren enkel voor sanitair warm water Geïntegreerd toestel, dus geen interne metingen mogelijk 49
237 IWT-TETRA : Zongekoppelde Warmtepompsystemen Eindverslag Werkpakket 5: Meetcampagne systeemrendement Auteurs: Leen Goovaerts, Dries Van Aken, Maarten Sourbron 5.3 Overzicht Lede Gegevens Tabel 5.2.5: De technische gegevens van de installatie in Lede Type Warmtepomp Vermogen Warmtepomp Warmtepomp Luchtwarmtepomp (Airwell, HP AW HIGH 18-9) 18 kw (2 C/35 C) Zonnecollectoren Type zonnecollector Vlakkeplaatcollector Absoberoppervlakte 7,08 m² Hellingsgraad 50 Azimuthoek 11 Buffer Type buffer Gecombineerd Volume buffervat 400 l Woning K-peil 27 E-peil 40 Verwarmde oppervlakte 312 m² Hydraulisch schema Figuur 5.2.9: Het hydraulisch schema van de installatie in Lede 50
238 IWT-TETRA : Zongekoppelde Warmtepompsystemen Eindverslag Werkpakket 5: Meetcampagne systeemrendement Auteurs: Leen Goovaerts, Dries Van Aken, Maarten Sourbron Principeschema Figuur : Het principeschema van de installatie in Lede Flowchart Energy Flow Chart: DHW & Heating - Copyright IEA SHC-Task 44 / HPP-Annex38 Sun Ground Air Water Waste Heat Solar Collectors Ground Probes Air HX Water HX Waste HX Electricity Primary Storage Rejection Storage Energy Carrier Water Tank Cold Distrib. HP Heat Distrib. DHW Tank DHW Distrib. Secondary Storage By: AIT EURAC Fraunhofer ISE SPF Figuur : De flowchart van de installatie in Lede 51
239 IWT-TETRA : Zongekoppelde Warmtepompsystemen Eindverslag Werkpakket 5: Meetcampagne systeemrendement Auteurs: Leen Goovaerts, Dries Van Aken, Maarten Sourbron Berekeningen SPF Vloerverwarming (nr ) + Sanitair koud (nr ) SPF TOT+ = Warmtepomp(nr ) SPF WP = SPF SWW+ = SPF RVW+ = SPF WP RVW+ = SPF WP SWW+ = SPF zon = (Buffer cv (nr )) + (Buffer sanitair (nr )) Warmtepomp (nr ) Sanitair koud (nr ) Warmtepomp SWW Vloerverwarming (nr ) Warmtepomp RVW (Buffer cv (nr )) Warmtepomp RVW (Buffer sanitair (nr )) Warmtepomp SWW Zonnecollectoren (nr ) Solarpomp (nr ) Zonnefractie Zonnecollectoren (nr ) f zon = Vloerverwarming (nr ) + Sanitair koud (nr ) 100% Zonnecollectoren (nr ) f zon opwek = Zonnecollectoren (nr ) + (Buffer cv (nr )) + (Buffer sanitair (nr )) 100% Verliezen E vat = [Vloerverwarming (nr ) + Sanitair koud (nr ) + Sanitair lauw (nr ) ] [(Buffer cv (nr )) + (Buffer sanitair (nr ))] 52
240 IWT-TETRA : Zongekoppelde Warmtepompsystemen Eindverslag Werkpakket 5: Meetcampagne systeemrendement Auteurs: Leen Goovaerts, Dries Van Aken, Maarten Sourbron Meetresultaten De meetresultaten die hier voorgesteld worden, zijn geen volledige maand, maar slechts van 15 juni tot en met 19 juli. Door problemen met de opstart van de installatie en de plaatsing van de meters, is het monitoren pas op die datum is kunnen beginnen. De zonwarmtepomp werkt volledig in SWWmode. Belangrijk hierbij is dat de installatie een circulatieleiding voor warm water heeft. Tabel 5.2.6: De meetresultaten voor de installatie in Lede jun/14 jul/14 Totaal Buffer CV (kwh) Buffer sanitair (kwh) Pomp prim circ zonneboiler (kwh) Sanitair koud (kwh) Sanitair lauw (kwh) Vloerverwarming (kwh) Warmtepomp (kwh) Zonnecollector (kwh) 39,4 21,1 60,5 Zonne-instraling (kwh/m²) 71,99 78,90 150,89 Langjarig gemiddelde - zonne-instraling (kwh/m²) 73,5 91,57 165,07 Aantal graaddagen 0,68 1,04 1,72 Langjarig gemiddelde - aantal graaddagen 13,5 3,06 16,56 Gemiddelde temperatuur ( C) 16,12 18,86 17,49 Langjarig gemiddelde - gemiddelde temperatuur ( C) 16,2 18,4 17,3 SPF tot+ 0,56 0,51 0, SPF wp 2,22 2,3 2, SPF SWW+ 0,56 0,51 0, SPF RVW SPF wp RVW SPF wp SWW+ 2,22 2,3 2, SPF zon 7,88 7,03 7,5625 Zonnefractie tot (%) 157,6 68,06 108,0357 Zonnefractie opwek (%) 28,26 13,1 20,13311 Verlies vat (kwh) Verlies circulatieleiding (kwh)
241 Verbruik sanitair warm water (m³) IWT-TETRA : Zongekoppelde Warmtepompsystemen Eindverslag Werkpakket 5: Meetcampagne systeemrendement Auteurs: Leen Goovaerts, Dries Van Aken, Maarten Sourbron Bespreking Uit de meetresultaten blijkt duidelijk dat de SPF over het volledige systeem enorm laag is, namelijk slechts 0,5. Dit slechte resultaat is te wijten aan het slechte rendement van de warmtepomp en weinig inkomende energie van de zon. Het is echter niet zo dat de installatie stilstaat (zie figuur ), wat dus geen verklaring kan zijn voor het slechte rendement Verbruik water Dag van de maand Figuur : Dagverbruik aan sanitair warm water in de maand juli De weinige zonne-energie die in de installatie vloeit, is mogelijk te wijten aan een slechte sensor bij de zonnecollectoren of aan een foute instelling in de installatie waardoor er te weinig zonne-energie tot in het opslagvat geraakt. De pomp van de zonnecollector slaat namelijk vaak kortstondig op en snel weer terug af om nadien weer terug op te springen. Dit is niet rendabel voor het systeem. Het verlies van de sanitaire circulatieleiding is in verhouding zeer groot. De circulatieleiding pompt sanitair warm water rond, uit en in het vat, zodat er steeds warm water beschikbaar is voor sanitair gebruik. Op de gemeten periode zorgt deze leiding voor 99 kwh verlies, op een totale warmteproductie van 300,5 kwh, dus de circulatie leiding zorgt voor 32,95% verlies. Zoals te zien is in figuur , is er op 1 dag meer verlies in de circulatieleiding (sanitair lauw) dan dat er water verbruikt wordt (sanitair koud). Een klok- of andere sturing van de circulatiepomp lijkt dus aangewezen. 54

242 Verbruik (kwh) IWT-TETRA : Zongekoppelde Warmtepompsystemen Eindverslag Werkpakket 5: Meetcampagne systeemrendement Auteurs: Leen Goovaerts, Dries Van Aken, Maarten Sourbron Verlies circulatieleiding Uur van de dag Sanitair lauw Sanitair koud Figuur : Verlies circulatieleiding gedurende 1 dag Problemen De eigenaars van deze installatie hadden klachten omtrent de verwarming van het bovenste verdiep van hun woning bij lage buitentemperaturen. Na grondig onderzoek, is er waarschijnlijk een oorzaak van het probleem gevonden. In de installatie is onderstaand systeem voorzien om warmte te verpompen naar het gelijkvloers (rechtse kring) en naar de 2 bovenverdiepingen (linkse kring). Huidige aansluiting Figuur : Aansluiting naar de verschillende kringen 55

243 IWT-TETRA : Zongekoppelde Warmtepompsystemen Eindverslag Werkpakket 5: Meetcampagne systeemrendement Auteurs: Leen Goovaerts, Dries Van Aken, Maarten Sourbron Bij het nader bekijken van de grijze blok in het systeem, blijken de leidingen als volgt door elkaar te lopen. Figuur : Schakeling van de leidingen Als er dan onderzocht wordt hoe de warmtestroom loopt bij de huidige aansluiting, wordt volgend schema verkregen. 22 C 38 C 28 C Het is duidelijk dat de kring van de bovenste verdiepingen een groter drukverschil moet overwinnen, doordat de afstand die afgelegd moet worden door de warmtestroom groter is. Bovendien wordt de 56
244 IWT-TETRA : Zongekoppelde Warmtepompsystemen Eindverslag Werkpakket 5: Meetcampagne systeemrendement Auteurs: Leen Goovaerts, Dries Van Aken, Maarten Sourbron warme stroom die naar de bovenste verdieping moet, afgekoeld door de terugstroom van het gelijkvloers. Dit alles in combinatie met het feit dat de bovenverdieping meer warmteverliezend oppervlak per vloeroppervlak heeft (namelijk buitenmuren en dak), zorgt ervoor dat de bovenste verdieping niet op de gewenste temperatuur gebracht kan worden. Het probleem is op te lossen door de toevoer op een andere leiding aan te sluiten, zoals aangegeven wordt in onderstaande figuur. Op deze manier is het drukverschil dat overwonnen moet worden, voor beide kringen gelijk. 57
245 IWT-TETRA : Zongekoppelde Warmtepompsystemen Eindverslag Werkpakket 5: Meetcampagne systeemrendement Auteurs: Leen Goovaerts, Dries Van Aken, Maarten Sourbron 5.4 Overzicht Noorderwijk Gegevens Tabel 5.2.7: De technische gegevens van de installatie in Noorderwijk Type Warmtepomp Vermogen Warmtepomp Warmtepomp Verticale bodemwarmtewisselaar (Viessmann, 300G) 15,1 kw (0 C/35 C) Zonnecollectoren Type zonnecollector Vacuümzonnecollectoren Absoberoppervlakte 17 m² Hellingsgraad 30 Azimuthoek 15 Buffer Type buffer Gecombineerd Volume buffervat 750 l Woning K-peil 36 E-peil 67 Verwarmde oppervlakte 350 m² 58
246 IWT-TETRA : Zongekoppelde Warmtepompsystemen Eindverslag Werkpakket 5: Meetcampagne systeemrendement Auteurs: Leen Goovaerts, Dries Van Aken, Maarten Sourbron Hydraulisch schema Figuur : Het hydraulische schema van de installatie in Noorderwijk Belangrijk bij de interpretatie van de resultaten van deze installatie is dat er een gasketel voorzien is die het SWW naverwarmt indien dit onvoldoende door de zonwarmtepomp-installatie wordt opgewarmd. Er zijn echter geen warmtemeters geplaatst na de gastketel zodat de bijdrage ervan niet kon opgemeten worden. Om toch een idee van deze bijdrage te geven, toont de resultatentabel de gemiddelde T-uitgang-buffer voor elke maand. Kwantitatieve conclusies kunnen hier echter niet uit getrokken worden. Deze installatie bevat ook een bodem-koelingsfunctie. 59

247 IWT-TETRA : Zongekoppelde Warmtepompsystemen Eindverslag Werkpakket 5: Meetcampagne systeemrendement Auteurs: Leen Goovaerts, Dries Van Aken, Maarten Sourbron Principeschema Figuur : Het principeschema van de installatie in Noorderwijk Flowchart Figuur : De flowchart van de installatie in Noorderwijk 60
248 IWT-TETRA : Zongekoppelde Warmtepompsystemen Eindverslag Werkpakket 5: Meetcampagne systeemrendement Auteurs: Leen Goovaerts, Dries Van Aken, Maarten Sourbron Berekeningen SPF Koud en warm water (nr ) + (Buffer vloerverwarming (nr )) SPF TOT+ = Warmtepomp (nr ) SPF TOT = Koud en warm water (nr ) + (Buffer vloerverwarming (nr )) Warmtepomp (nr ) Pomp vloerverwarming (nr ) SPF WP (Warmtepomp buffer (nr )) = Warmtepomp (nr ) Pomp vloerverwarming (nr ) Solarpompen (nr ) (Sondes warmtepomp (nr )) SPF WP grond+ = 1 + Warmtepomp (nr ) (Warmtepomp buffer (nr )) SPF WP alg+ = (Warmtepomp buffer (nr )) (Sondes warmtepomp (nr )) SPF zon = SPF Reg = EER = (Solar buffer (nr )) Solarpompen (nr ) (Sondes regeneratie (nr )) Warmtepomp (nr ) Sondes warmtepomp(koeling) (nr ) Warmtepomp (koeling) (nr ) SPF Reg enkel op het moment dat de regeneratie plaatsvindt Zonnefractie (Solar buffer (nr )) f zon = Koud en warm water (nr ) + (Buffer vloerverwarming (nr )) 100% f zon opwek = (Solar buffer (nr )) (Solar buffer (nr )) + (Warmtepomp buffer (nr )) 100% Verliezen E vat = [Koud en warm water (nr ) + (Buffer vloerverwarming (nr ))] [(Solar buffer (nr )) + (Warmtepomp buffer (nr ))] E WP = (Warmtepomp buffer (nr )) (Sondes warmtepomp (nr )) [ Warmtepomp (nr ) Pomp vloerverwarming (nr ) + ( ) ] Solarpompen (nr ) E Systeem = [Koud en warm water (nr ) + (Buffer vloerverwarming (nr ))] (Solar buffer (nr )) + (Sondes warmtepomp (nr )) [ ] +Warmtepomp (nr ) E Regeneratie = (Sondes regeneratie (nr )) (Sondes warmtepomp (nr )) 61
249 IWT-TETRA : Zongekoppelde Warmtepompsystemen Eindverslag Werkpakket 5: Meetcampagne systeemrendement Auteurs: Leen Goovaerts, Dries Van Aken, Maarten Sourbron Meetresultaten Tabel 5.2.8: De meetresultaten voor de installatie in Noorderwijk feb/14 mrt/14 apr/14 mei/14 jun/14 Totaal Solar - buffer (kwh) 311,2 1001,1 1175,1 991,6 750,1 4229,1 Buffer vloerverwarming (kwh) Buffer warmtepomp (kwh) Koud en warm water (kwh) Pomp vloerverwarming (kwh) Sondes - regeneratie (kwh) Solarpompen (kwh) Sondes - warmtepomp 2903/ /59 600/ /284 75/ /1981 (kwh) (Verwarming/koeling) Warmtepomp (kwh) Zonne-instraling 30,28 79, ,35 146,36 499,81 (kwh/m²) Langjarig gemiddelde - 37,18 70,99 111,14 143,29 147,05 509,65 zonne-instraling (kwh/m²) Aantal graaddagen 230,1 187,8 76,8 58,7 4,77 558,17 Langjarig gemiddelde - 324,83 259,22 168,21 71,71 26,11 850,08 aantal graaddagen Gemiddelde 6,78 8,85 12,55 13,79 16,73 11,74 temperatuur ( C) Langjarig gemiddelde - gemiddelde temperatuur ( C) 3,05 6,31 9,35 13,49 16,15 9,67 SPF tot+ 4,37 5,4 7,95 7,59 5,27 5,43 SPF tot 4,7 6,13 10,55 10,53 7,17 6,27 SPF wp 4,37 4,45 4,52 4,51 0,47 4,25 SPF wp grond 4,41 4,29 3,79 3,64 3,21 4,09 SPF wp alg+ 6,36 6,71 7 7,05-0,829 6,88 SPF zon 103,7 166,9 167,9 141,7 250,03 162,66 EER ,17 16,06 16,11 16,37 Zonnefractie tot (%) 8,37 33,17 68,76 72,97 139,42 40,89 Zonnefractie opwek (%) 8,28 31,66 62,67 64,32 95,66 38,03 Verlies vat (kwh) -37,2-144,1-166,1-182,6-246,1-776,10 62
250 IWT-TETRA : Zongekoppelde Warmtepompsystemen Eindverslag Werkpakket 5: Meetcampagne systeemrendement Auteurs: Leen Goovaerts, Dries Van Aken, Maarten Sourbron Verlies WP (kwh) ,00 Verlies systeem (kwh) -346,2-381,1-281,1-283,6-389,1-1681,10 Verlies regeneratie ,00 (kwh) Gemiddelde T uitgang buffer ( C) 27,05 31,77 40,01 40,69 62,95 40,49 63
251 IWT-TETRA : Zongekoppelde Warmtepompsystemen Eindverslag Werkpakket 5: Meetcampagne systeemrendement Auteurs: Leen Goovaerts, Dries Van Aken, Maarten Sourbron Bespreking Het bekomen rendement van deze installatie ligt hoog, zeker in de maand april. De SPF is voor elke maand meer dan aanvaardbaar. De hoge SPF valt ook te verklaren doordat de uitgangstemperatuur van de buffer, niet de temperatuur is waarop het sanitair warm water geconsumeerd wordt. Achter de buffer staat nog een ketel die het water verder zal opwarmen. Ook de zonnefractie is deze installatie is hoog. De lage temperatuur aan de uitgang van de buffer kan verklaard worden door een gebrek in de warmtemeter. Deze geeft geen gemiddelde temperatuur weer, maar de temperatuur op het moment dat de meting uitgelezen wordt. Deze temperatuur is dus niet representatief voor het voorbije half uur, maar wel indicatief voor de buffertemperatuur. Hieruit blijkt dat de gasketel zeker voor de naverwarming van het sanitair warm water zorgt. Figuur : Prestatiefactoren en zonnefractie van de zonwarmtepomp in Noorderwijk Het valt op dat in de maand juni een negatieve SPF voor de warmtepomp algemeen bekomen wordt en een zeer lage SPF wp. Dit valt te verklaren doordat er steeds eerste een circulatiepomp opstart vooraleer de warmtepomp zelf opstart. Hierdoor haalt de circulatiepomp meer warmte uit de grond bij de opstart dan dat de warmtepomp gebruikt om om te zetten naar meer warmte omdat de grond eerst nog de warmte van in het huis doorgepompt krijgt. Dit fenomeen is altijd geldig, maar is enkel zichtbaar in deze maand omdat er eigenlijk te weinig verwarming is. Deze installatie is uitvoerig uitgerust met warmtemeters wat maakt dat er ook veel deelresultaten beschikbaar zijn. De SPF van de zonnecollectoren kan ook bepaald worden (zie Figuur ). Deze liggen bijzonder hoog (standaard waarden in de literatuur zijn 50-80) met een globale waarde van 163 voor de gehele meetperiode, met een uitschieter tot 250 in juni
252 IWT-TETRA : Zongekoppelde Warmtepompsystemen Eindverslag Werkpakket 5: Meetcampagne systeemrendement Auteurs: Leen Goovaerts, Dries Van Aken, Maarten Sourbron Figuur : Prestatiefactor van d e zonnecollectoren van de zonwarmtepomp in Noorderwijk Figuur : Analyse van het warmteverlies van de zonwarmtepomp in Noorderwijk Figuur toont het aandeel van het warmteverlies van de zonwarmtepomp in de totale warmtetoevoer naar de woning (SWW en RV). Ondanks het feit dat deze installatie goed en correct geïsoleerd is, blijkt dat het warmteverlies toch nog minimaal 10% van de warmtelevering is. Naar de zomer toe stijgt dit naar 20% (maand mei). In de zomermaand juni, wanneer enkel SWW moet geproduceerd worden, gaat een groot deel van de geleverde warmte (via de zonnecollectoren) verloren aan de omgeving (72% van de geleverde warmte). In totaal, voor de periode van februarijuni 2014 is het warmteverlies 16% van de totaal geleverde warmte aan RV en SWW. Deze installatie is ook voorzien van een functie voor directe koeling via de bodem. In totaal, voor de maanden april tot juni 2014 wordt er 1981kWh koeling geleverd, aan een SPF van 16,4. Dit is een normale, te verwachten waarde. 65
253 IWT-TETRA : Zongekoppelde Warmtepompsystemen Eindverslag Werkpakket 5: Meetcampagne systeemrendement Auteurs: Leen Goovaerts, Dries Van Aken, Maarten Sourbron De SPF van de regeneratie kan jammer genoeg niet berekend worden in deze installatie. Het probleem ligt hem enerzijds in het feit dat de elektriciteitsmeter slechts tot op 1 kwh nauwkeurig meten, en dit niet verbruikt wordt tijdens een moment van regeneratie. Anderzijds is er ook een probleem met het tijdsinterval van de meetwaarden. Er wordt elk half uur de stand van zaken gemeten. Binnen dat half uur kan de regeneratie een half uur opgestaan hebben of slechts 5 minuten. Deze beperkingen zorgen ervoor dat het onmogelijk is om een nauwkeurige berekening van de SPF van de regeneratie te maken. Er is echter 1 dag waar een hele dag aan regeneratie gedaan is omwille van de vervanging van het buffervat. Een analyse kan gemaakt worden aan de hand van de meters 12 en 13 uit Figuur (resp. Sondes-warmtepomp en Sondes-regeneratie ). Beide warmtemeters geven uitlezing die 1.9% verschilt, wat een aanvaardbare tolerantie is. De bronpomp werkt aan een debiet van 3.03 m³/u. Omdat de regeling op dit moment uitgeschakeld werd en de regeneratiepompen constant aan stonden, moeten deze resultaten correct geïnterpreteerd worden: enkel wanneer de aanvoertemperatuur naar de bodem (Tin uit Figuur ) stijgt, leveren de zonnecollectoren meer warmte dan de bodem kan absorberen. De bodemtemperatuur stijgt dan. Wanneer de aanvoertemperatuur naar de bodem (Tin) daalt, kan de bodem meer warmte absorberen dan de zonnecollectoren kunnen leveren. Figuur : Resultaat van regeneratie Tijdens deze dag is er 80 kwh aan warmte in de bodem gepompt. Dit heeft gezorgd voor een stijging van de uitgaande bodemtemperatuur van bijna 3 C (zie figuur ). Doordat de bodem opwarmt omwille van regeneratie, zal ook de COP van de warmtepomp stijgen. Hoeveel is moeilijk in te schatten omdat de bodemtemperatuur zonder dat er regeneratie was, uiteraard niet gekend is. 66
254 IWT-TETRA : Zongekoppelde Warmtepompsystemen Eindverslag Werkpakket 5: Meetcampagne systeemrendement Auteurs: Leen Goovaerts, Dries Van Aken, Maarten Sourbron Er is tijdens de periode van regeneratie 2 kwh aan elektrische energie verbruikt, wat maakt dat de SPF van de regeneratie 40 bedraagt. Wanneer enkel de periode van stijgende Tin wordt meegerekend (wanneer de zonnecollectoren meer vermogen leveren dan de bodem kan absorberen, van 11u-14u30) is de SPF-regeneratie=61. 67
255 IWT-TETRA : Zongekoppelde Warmtepompsystemen ZON-WARM Eindverslag: Code van Goede Praktijk, selectie- en berekeningstool en EPB WP6T1: Opstellen/aanvullen Code van Goede Praktijk WP6T2: Selectie en berekeningstool WP6T3: Verrekening in EPB Vakgroep Thermotechniek, Technologiecampus De Nayer Faculteit Industriële Ingenieurswetenschappen, KU Leuven Jan De Nayerlaan 5, 2860 Sint-Katelijne-Waver, België Tel.: + 32 (0) Maarten.Sourbron@kuleuven.be Auteurs: Redactie: Leen Goovaerts Dries Van Aken Jan Verheyen John Veeken Maarten Sourbron
256 IWT-TETRA : Zongekoppelde Warmtepompsystemen Eindverslag Werkpakket 6: Code van Goede Praktijk en selectie- en berekeningstool Auteurs: Leen Goovaerts, Dries Van Aken, Jan Verheyen, John Veeken, Maarten Sourbron Copyright KU Leuven Zonder voorafgaande schriftelijke toestemming van zowel de auteur(s) als de redacteur(s) is overnemen, kopiëren, gebruiken of realiseren van deze uitgave of gedeelten ervan verboden. Voor aanvragen tot of informatie i.v.m. het overnemen en/of gebruik en/of realisatie van gedeelten uit deze publicatie, wend u tot KU Leuven Campus De Nayer, Jan De Nayerlaan 5, B-2860 Sint-Katelijne-Waver, of via iiw.thomasmore.denayer@kuleuven.be. Voorafgaande schriftelijke toestemming van de redacteur(s) is eveneens vereist voor het aanwenden van de in dit rapport beschreven (originele) methoden, producten, schakelingen en programma s voor industrieel of commercieel nut. 1
257 IWT-TETRA : Zongekoppelde Warmtepompsystemen Eindverslag Werkpakket 6: Code van Goede Praktijk en selectie- en berekeningstool Auteurs: Leen Goovaerts, Dries Van Aken, Jan Verheyen, John Veeken, Maarten Sourbron Inhoudstafel 1 Taakbeschrijving (uit projectaanvraag) Taak 1 (WP6T1): Opstellen/aanvullen Code van Goede Praktijk Taak 2 (WP6T2): Selectie- en berekeningstool Taak 3 (WP6T3): Verrekening in EPB Code van Goede Praktijk voor systemen met warmtepomp en zonnecollectoren Selectie- en berekeningstool voor gecombineerde warmtepomp-zonnecollector-installaties Gecombineerde warmtepomp-zonnecollector-installaties in EPB Standaard warmte-opwekkinginstallaties EPB-resultaten Effect van de woningisolatiegraad in EPB en Polysun Invloed warmtevoorziening verwarming door zonnecollectoren EPB-resultaten Effect van zonnecollectoren voor SWW en RVW in EPB en Polysun Invloed van de β-factor Invloed van het zonnecollector oppervlakte EPB-resultaten Effect van het zonnecollectoroppervlak in EPB en Polysun Invloed ventilatiesysteem
258 IWT-TETRA : Zongekoppelde Warmtepompsystemen Eindverslag Werkpakket 6: Code van Goede Praktijk en selectie- en berekeningstool Auteurs: Leen Goovaerts, Dries Van Aken, Jan Verheyen, John Veeken, Maarten Sourbron 1 Taakbeschrijving (uit projectaanvraag) 1.1 Taak 1 (WP6T1): Opstellen/aanvullen Code van Goede Praktijk Type : valorisatie-activiteit De resultaten van het project vormen een mogelijke basis voor de uitbreiding van de huidige Code van Goede Praktijk voor de toepassing van warmtepompsystemen in de woningbouw of voor het opstellen van een Code van Goede Praktijk voor de koppeling van warmtepompsystemen met zonthermie in de woningbouw. Mogelijke indeling van deze code: - principeschema s - beschrijving en prestatie - ontwerprichtlijnen - installatie - opvolging - normen en wetgeving - beslissingsmatrix - stappenplan De Code van Goede Praktijk wordt stelselmatig opgebouwd door voorstelling ervan tijdens de verschillende gebruikersgroepen. De tussentijdse rapporten vormen hiervoor de leidraad. Resultaat: Code van Goede Praktijk voor de koppeling van warmtepompsystemen met zonnecollectoren in de woningbouw 1.2 Taak 2 (WP6T2): Selectie- en berekeningstool Type : valorisatie-activiteit Samen met de Code van Goede Praktijk wordt een selectie- en berekeningstool afgeleverd. De ontwerper, architect, moet na het invullen van een aantal basisgegevens een installatieconfiguratie bekomen met dimensionering van de verschillende componenten. Deze selectie- en berekeningstool koppelt dan ook de selectietool systeemconfiguratie uit WP3T2 met de dimensioneringsrichtlijnen uit WP4T2. Resultaat: selectie- en berekeningstool koppeling zonthermie/warmtepomp 1.3 Taak 3 (WP6T3): Verrekening in EPB Type : valorisatie-activiteit In WP4T1 en WP4T2 wordt een globale energetische evaluatie gemaakt. Hoewel de energieprestatieregelgeving niet als bedoeling had om te worden gebruikt als ontwerptool, toch moet de E-peil berekening de juiste signalen en tendensen geven en de verschillende technologieën en concepten maximaal correct weergeven, binnen de gestelde randvoorwaarden. In deze taak wordt nagegaan hoe de huidige E-peil rekenmethodiek omgaat met de in dit project gehanteerde technologie, en in welke mate, in vergelijking met de ontwikkelde gedetailleerde modellen en de 3
259 IWT-TETRA : Zongekoppelde Warmtepompsystemen Eindverslag Werkpakket 6: Code van Goede Praktijk en selectie- en berekeningstool Auteurs: Leen Goovaerts, Dries Van Aken, Jan Verheyen, John Veeken, Maarten Sourbron praktische dimensioneringsmethodiek, de resultaten ermee overeenstemmen. In functie van de resultaten van deze evaluatie worden - voorstellen geformuleerd tot koppeling van het zonthermisch deel met de warmtepomp - voorstellen geformuleerd tot aanpassing van vaste parameters en ontstenteniswaarden - voorstellen geformuleerd tot wijzigingen in de rekenmethodiek - voorstellen geformuleerd tot toevoegen van specifieke aanvullende methodieken Resultaat: concrete voorstellen voor aanpassen van de EPB rekenmethodiek 4
260 IWT-TETRA : Zongekoppelde Warmtepompsystemen Eindverslag Werkpakket 6: Code van Goede Praktijk en selectie- en berekeningstool Auteurs: Leen Goovaerts, Dries Van Aken, Jan Verheyen, John Veeken, Maarten Sourbron 2 Code van Goede Praktijk voor systemen met warmtepomp en zonnecollectoren Wegens de moeilijke voortgang van het project (verhuis labo en personeelswissels (zie Werkpakket 0) is ervoor gekozen om geen expliciete herwerking van de Code van Goede Praktijk voor warmtepompen 1 te maken. Anderzijds is uit de simulaties gebleken dat zonwarmtepomp-installaties waarvan enerzijds de warmtepomp gedimensioneerd wordt volgens deze Code en anderzijds het zonneboilergedeelte volgens de richtlijnen van WTCB 2 tot correct gedimensioneerde installaties leidt. 1 ANRE; 2005; Code van goede praktijk voor de toepassing van warmtepompsystemen in de woningbouw; Ministerie van de Vlaamse Gemeenschap, afdeling natuurlijke rijkdommen en energie (ANRE); 2005; 2 WTCB; 1999; TVN 212 leidraad voor de installatie van zonneboilers; Wetenschappelijk en Technisch Centrum voor het Bouwbedrijf; 2e uitgave; Brussel; juni 1999; 5
261 IWT-TETRA : Zongekoppelde Warmtepompsystemen Eindverslag Werkpakket 6: Code van Goede Praktijk en selectie- en berekeningstool Auteurs: Leen Goovaerts, Dries Van Aken, Jan Verheyen, John Veeken, Maarten Sourbron De volgende uitgangspunten worden gehanteerd bij het ontwerp van een zonwarmtepomp: WIE EERST? Zonnecollectoren genieten voorkeur bij de productie van warmte boven de warmtepomp. De SPF van zonnecollectoren (richtwaarde 50, maar waarden van 160 zijn ook opgemeten) is immers hoger dan die van de warmtepomp (richtwaarde 3 tot 5) BASISPRINCIPE DIMENSIONERING De warmtepomp wordt gedimensioneerd zonder rekening te houden met de zonnecollectoren. Bij afwezigheid van zonwarmte moet de installatie blijven draaien. De zonnecollectoren worden gedimensioneerd zonder rekening te houden met ruimteverwarming: de redenering is dat de lage temperatuurwarmte in de winter, die niet bruikbaar is voor SWW, wel kan gebruikt worden voor RV. WARMTEPOMP De warmtepomp wordt gedimensioneerd volgens de Code van Goede Praktijk 1 : Warmteverlies volgens EN12831 Opslag SWW = 1.2 x (max. dagvolume +40l) opwarmen op een gekozen tijd (bv. 4u) Q Warmtepomp = max (Q RV, Q SWW) ZONNECOLLECTOREN De zonnecollectoren + opslagvolume wordt gedimensioneerd volgens de TV212 van WTCB 2 Dagelijks warm waterverbruik bepalen (Bijlage 2 van TV212, IEA Task44, Code van Goede Praktijk voor warmtepompen: (Code) 50l/persoon.dag@40 C; (VDI2067) hoge eisen : l/persoon.dag@40 C, gemiddelde eisen : l/persoon.dag@40 C, lage eisen : l/persoon.dag@40 C. De Code rekent nog een marge voor piekverbruik en voor het niet volledig benutten van het buffervolume. 50 liter SWW-buffervolume per m² zonnecollector AANDACHTSPUNTEN Een keuze tussen systeemconcepten wordt niet gemaakt. Wel moet er met de volgende aandachtspunten rekening gehouden worden: Opslag van warmte leidt tot extra warmteverlies (opgemeten warmteverlieswaarden van 7% tot 40% van de totale warmteproductie) Een extra circulatiepomp leidt tot direct extra elektriciteitsverbruik met negatieve impact op het eindenergieverbruik Regeneratie van de bodem kan een positief effect hebben op de prestatie van de warmtepomp, maar kan ook een negatief effect hebben door het extra circulatiepompverbruik. Voorzichtig ontwerp, installatie en inregeling is noodzakelijk De hydraulische aansluiting en regeling van het buffervat is cruciaal voor een hoge SPF. Temperatuurslagen mogen niet vermengd worden 6
262 IWT-TETRA : Zongekoppelde Warmtepompsystemen Eindverslag Werkpakket 6: Code van Goede Praktijk en selectie- en berekeningstool Auteurs: Leen Goovaerts, Dries Van Aken, Jan Verheyen, John Veeken, Maarten Sourbron 3 Selectie- en berekeningstool voor gecombineerde warmtepompzonnecollector-installaties Een specifieke ontwerptool naast de bestaande is volgens de conclusies van dit project niet nodig. Een zonwarmtepomp is complexer dan een aparte warmtepomp en zonneboiler, wat een grote aandacht voor ontwerp en vooral regeling van de installatie noodzakelijk maakt. 7
263 IWT-TETRA : Zongekoppelde Warmtepompsystemen Eindverslag Werkpakket 6: Code van Goede Praktijk en selectie- en berekeningstool Auteurs: Leen Goovaerts, Dries Van Aken, Jan Verheyen, John Veeken, Maarten Sourbron 4 Gecombineerde warmtepomp-zonnecollector-installaties in EPB Voor de simulaties die werden uitgevoerd voor het ZonWarm-project, werden de drie woningen gebruikt die ook in de simulatie-oefening toegepast werden: SFH015, SFH045 en SFH100. Deze woningen hebben dezelfde binnenafmetingen, maar de dikte van de isolatie verschilt (zie Werkpakket 4). Deze drie woningen werden ingevoerd in de EPB-software 3G (versie: EPB ). Hierbij werden ook twee verschillende warmtepompen vergeleken, namelijk een bodem/water warmtepomp en een lucht/water warmtepomp. Bij het invoeren van de woningen en installaties in EPB zijn volgende extra instellingen gebruikt: De zonnecollectoren leveren enkel warmte aan het buffervat voor sanitair warm water. Geen buffervat voor verwarming. Woning SFH15 en 45 wordt vloerverwarming gebruikt en bij woning SFH100 worden radiatoren gebruikt. De warmtepomp heeft geen elektrische weerstand in woning SFH15, wel in SFH45 en 100. Lekdebiet bij 50 Pa per eenheid oppervlakte = 0.12 m³/(h.m²). Bodem/water warmtepomp: COP = 4,5 (B/W 0/35-30). Lucht/water warmtepomp: COP = 3,7 (A/W 2/35-30). -factor = 1 (geen backup) Berekeningsmethode Bouwknopen: Methode B, geen bouwknopen ingevuld. Vrijstaande nieuwbouw. Ventilatiesysteem: A natuurlijke toevoer, vrije afvoer. Hygiënische ventilatie: fictief ingesteld met minimum toevoer, doorstroming en afvoer. Inertie: type constructie = half zwaar Tappunten: een douche, een bad en twee aanrechten (geen warmtewinning) Deze EPB-basisinstallatie komt overeen met de zonwarmtepomp SYS2 uit de simulatieoefening (Werkpakket 4). Als optie worden de zonnecollectoren ook voor verwarming ingezet, zodat die EPB-installatie overeenkomst vertoont met de zonwarmtepomp SYS1. Dit is geen analyse om een procedure voor gelijkwaardigheid te bekomen, daarvoor is de vergelijkingsbasis te eng. Ze stelt daarentegen wel de relatieve verschillen vast van parametervariaties in EPB en Polysun. 8
264 IWT-TETRA : Zongekoppelde Warmtepompsystemen Eindverslag Werkpakket 6: Code van Goede Praktijk en selectie- en berekeningstool Auteurs: Leen Goovaerts, Dries Van Aken, Jan Verheyen, John Veeken, Maarten Sourbron 4.1 Standaard warmte-opwekkinginstallaties EPB-resultaten In Tabel 1 worden enkele EPB-resultaten weergegeven voor de verschillende standaard woningen met de verschillende warmtepompen. Hieronder wordt de invloed van enkele parameters en componenten in de installaties weergegeven in de EPB-software. Hierbij behaalt de bodem/water warmtepomp steeds een net iets lager E-peil. Tabel 1: Resultaten uit EPB voor de verschillende standaard woningen en installaties Woning Warmtepomp K- E-peil Q heat,net,a/a f Q heat,net,a Q water,net,a Q heat,final,a waarde [kwh/m²] [MJ] [MJ] [MJ] [MJ] SFH15 Bodem/water , ,8 4235,3 7173,1 2700,7 WP SFH15 Lucht/water , ,8 4235,3 8088,8 2700,7 WP SFH45 Bodem/water , ,6 4235, ,7 2866,4 WP SFH45 Lucht/water , ,6 4235, ,6 2866,4 WP SFH100 Bodem/water , ,5 4235, ,8 2866,4 WP SFH100 Lucht/water , ,5 4235, ,1 2866,4 WP Q water,final,a Met : Q heat,net,a = Netto energiebehoefte voor ruimteverwarming [MJ] Q water,net,a = Netto energiebehoefte voor sanitair warm water [MJ] Q heat,final,a = Eindenergie-verbruik voor ruimteverwarming [MJ] Q water,final,a = Eindenergie-verbruik voor sanitair warm water [MJ] Q heat,net,a/a f = Netto energiebehoefte voor verwarming per m² vloeroppervlakte [kwh/m²] P kar,prim,a : Karakteristiek jaarlijks primair energieverbruik [MJ] P prim,hulp,a: Primair energieverbruik hulpenergie [MJ] P prim,vent,a: Primair energieverbruik ventilatoren (hulpenergie) [kwh] Q vent,loss : Ventilatieverliezen [MJ] P prim,heat,a: Primair energieverbruik verwarming [MJ] A f = Totaal vloeroppervlakte [m²] 9
265 IWT-TETRA : Zongekoppelde Warmtepompsystemen Eindverslag Werkpakket 6: Code van Goede Praktijk en selectie- en berekeningstool Auteurs: Leen Goovaerts, Dries Van Aken, Jan Verheyen, John Veeken, Maarten Sourbron Effect van de woningisolatiegraad in EPB en Polysun Een absolute vergelijking tussen EPB en Polysun is moeilijk te maken omdat de gelijkwaardigheid tussen EPB en Polysun onvoldoende is uitgewerkt en bewezen. Een relatieve vergelijking daarentegen, geeft wel een zicht op het effect van parametervariaties op de systeemprestaties. Tabel 2 toont de prestatie van de zonwarmtepompen in de drie verschillende woningen. Waar bij EPB de verschillen relatief beperkt zijn, liggen de resultaten bij Polysun veel verder uit elkaar. Tabel 2: Effect van de woningisolatiegraad in EPB en Polysun Woning WP EPB Polysun SFH15 Bodem/water WP SFH15 Lucht/water WP -- SFH45 Bodem/water WP +54% +117% SFH45 Lucht/water WP +51% SFH100 Bodem/water WP +249% +577% SFH100 Lucht/water WP +255% Zonder een oordeel te vellen over de juistheid van EPB dan wel Polysun, toont dit aan dat de resultaten van simulaties voorzichtig moeten geïnterpreteerd worden. 4.2 Invloed warmtevoorziening verwarming door zonnecollectoren EPB-resultaten In de standaard installaties leveren de zonnecollectoren geen warmte aan de verwarming en is de verwarming rechtstreeks aangesloten aan de warmtepomp. Tabel 3: Invloed van warmtevoorziening door de zonnecollectoren voor ruimteverwarming. Standaard-installaties met verwarmingsvoorziening door zonnecollectoren Standaard-installaties zonder verwarmingsvoorziening door zonnecollectoren Woning WP E-peil Q heat,final,a Q water,final,a E-peil Q heat,final,a Q water,final,a SFH15 Bodem/water WP SFH15 Lucht/water WP SFH45 Bodem/water ,3 3504, ,7 2866,4 WP SFH45 Lucht/water ,8 3504, ,6 2866,4 WP SFH100 Bodem/water ,6 4107, ,8 2866,4 WP SFH100 Lucht/water WP ,8 4107, ,1 2866,4 10
266 IWT-TETRA : Zongekoppelde Warmtepompsystemen Eindverslag Werkpakket 6: Code van Goede Praktijk en selectie- en berekeningstool Auteurs: Leen Goovaerts, Dries Van Aken, Jan Verheyen, John Veeken, Maarten Sourbron Tabel 3 wordt vergelijking gemaakt tussen installaties waarbij de zonnecollectoren warmte leveren aan de verwarming en de standaard installaties. Hiervoor werd ook een buffervat toegevoegd en een extra circulatiepomp, die tussen het buffervat en de verwarming is geplaatst. In de resultaten van EPB stijgt het E-peil van de installatie. Het eindenergie-verbruik voor ruimteverwarming daalt omdat de warmtepomp niet alleen instaat voor de warmtevraag. Het eindenergie-verbruik voor sanitair warm water daartegen stijgt, aangezien niet meer al de warmte afkomstig van de zon wordt gebruikt voor sanitair warm water. De warmtepomp moet hierdoor meer warmte opwekken voor sanitair warm water. Hierdoor is de totale eindenergie-verbruik groter dan bij de standaard installatie. De extra circulatiepomp resulteert ook in een hoger elektrisch verbruik voor de installatie Effect van zonnecollectoren voor SWW en RVW in EPB en Polysun Tussen EPB en Polysun kan een vergelijking gemaakt worden op dit vlak, maar wel met een belangrijke kanttekening. In EPB wordt een extra buffervat en circulatiepomp toegevoegd, terwijl in Polysun SYS1 (zie Werkpakket 4) een combivat is, waarin zowel opslag voor RVW als voor SWW wordt gedaan. Niettemin geeft de vergelijking relevante informatie. In Polysun is een gelijkaardig effect waarneembaar als bij EPB: de zonwarmtepomp SYS1 (zonnecollectoren voor SWW en RVW) verbruikt meer energie dan de zonwarmtepomp SYS2. Het verschil is nog meer uitgesproken dan bij EPB. Tabel 4: Effect van zonnecollectoren voor RVW in EPB en Polysun Verschil zonnecollectoren voor RVW en SWW t.o.v. enkel voor SWW Woning WP EPB Polysun SFH15 Bodem/water WP +2% +22% SFH15 Lucht/water WP +1% SFH45 Bodem/water WP +2% +10% SFH45 Lucht/water WP +2% SFH100 Bodem/water WP +2% +8% SFH100 Lucht/water WP +2% In Polysun ligt dit verschil aan (voor de SFH045-woning, verschil tussen SYS-COMBI en SYS-REF): Het gestegen hulpverbruik van pompen: +42% Het gestegen verbruik van de warmtepomp: +7% Het gestegen warmteverlies van het buffervat: +146% 4.3 Invloed van de β-factor De invloed van de verhouding van het vermogen van de warmtepomp t.o.v. het totaal vermogen van de warmtepomp met elektrische weerstand wordt gegeven door de β-factor. In de standaard installatie wordt voor woning SFH15 geen elektrische weerstand gebruikt. De standaard installatie heeft hierdoor een β-factor van 1,0 met een totaal vermogen van kw. Voor beide warmtepompen geeft het gebruik van een elektrische weerstand veel slechtere resultaten in EPB. Voor de woning SFH15 wordt volgens EPB best geen gebruik gemaakt van een elektrische weerstand. 11
267 IWT-TETRA : Zongekoppelde Warmtepompsystemen Eindverslag Werkpakket 6: Code van Goede Praktijk en selectie- en berekeningstool Auteurs: Leen Goovaerts, Dries Van Aken, Jan Verheyen, John Veeken, Maarten Sourbron Tabel 5: Invloed van de verhouding van het vermogen van de warmtepomp t.o.v. het totaal vermogen van de warmtepomp met elektrische weerstand (β -factor) voor woning SFH15. SFH15 Bodem/water Warmtepomp Lucht/water warmtepomp β-factor Vermogen E-peil Q heat,final,a Q water,final,a E-peil Q heat,final,a Q water,final,a WP/BU [kw] 0,5 1,699 / 1, ,8 2878, ,6 2878,2 0,6 2,039 / 1, ,8 2878, ,6 2878,2 0,71 2,413 / 0, ,1 2866, ,1 2866,4 0,8 2,719 / 0, ,1 2866, ,1 2866,4 1,0 3,399 / ,1 2700, ,8 2700,7 Ook voor de woning SFH45 wordt de invloed van de β-factor weergeven in Tabel 6. In de standaard installatie van woning SFH45 wordt een β-factor van 0,71 gebruikt met een totaal vermogen van 4,780 kw. Volgens de resultaten van EPB kan voor beide warmtepompen het E-peil nog sterk dalen indien de β-factor wordt verhoogd. Het beste resultaat wordt bekomen indien geen elektrische weerstand wordt gebruikt, maar een β-factor van 0,8 geeft al een grote verbetering van het E-peil. Tabel 6: Invloed van de verhouding van het vermogen van de warmtepomp t.o.v. het totaalvermogen van de warmtepomp met elektrische weerstand (β -factor) voor woning SFH45. SFH45 Bodem/water Warmtepomp Lucht/water warmtepomp β-factor Vermogen E-peil Q heat,final,a Q water,final,a E-peil Q heat,final,a Q water,final,a WP/BU [kw] 0,5 2,390 / 2, ,1 2878, ,6 2866,4 0,6 2,868 / 1, ,9 2866, ,6 2866,4 0,71 3,399 / 1, ,7 2866, ,6 2866,4 0,8 3,824 / 0, ,5 2700, ,7 2700,7 1,0 4,780 / ,0 2700, ,7 2700,7 Tabel 7: Invloed van de verhouding van het vermogen van de warmtepomp t.o.v. het totaal vermogen van de warmtepomp met elektrische weerstand (β -factor) voor woning SFH100. SFH100 Bodem/water Warmtepomp Lucht/water warmtepomp β-factor Vermogen E-peil Q heat,final,a Q water,final,a E-peil Q heat,final,a Q water,final,a WP/BU [kw] 0,5 4,434 / 4, ,0 2878, , ,6 5,321 / 3, ,8 2866, , ,71 6,296 / 2, ,3 2866, , ,8 7,094 / 1, ,3 2866, , ,0 8,868 / ,9 2700, , Voor de woning SFH100 heeft de standaard installatie een β-factor van 0,6 met een totaal vermogen van 8,868 kw. In Tabel 7 wordt de invloed weergegeven van de β-factor voor deze woning. Voor beide warmtepompen wordt pas een duidelijke verbetering waargenomen van de resultaten, indien de 12

268 IWT-TETRA : Zongekoppelde Warmtepompsystemen Eindverslag Werkpakket 6: Code van Goede Praktijk en selectie- en berekeningstool Auteurs: Leen Goovaerts, Dries Van Aken, Jan Verheyen, John Veeken, Maarten Sourbron warmtepomp geen elektrische weerstand heeft. Indien gebruik gemaakt wordt van een elektrische weerstand daalt het E-peil slechts weinig bij het verhogen van de β-factor. Voor de beta-factor werd geen analyse in Polysun gemaakt. In EPB geeft de -factor een stijging van het eind-energieverbruik: SFH015 (β=0.5 t.o.v. =1): +30% SFH045 (β=0.5 t.o.v. =1): +30% SFH100 (β=0.5 t.o.v. =1): +23% Deze resultaten verschillen niet heel veel van wat de Code van Goede Praktijk voor warmtepompen 3 aangeeft als effect van de back-up. Het rekenblad geeft voor een voorbeeldwoning met een warmteverlies van 6kW (vergelijkbare woning met SFH045) een elektrisch verbruik van 2351kWh (100% WP-vermogen; 100% WP-verbruik; SPF-WP=4.7) 2956kWh (60% WP-vermogen; 93% WP-verbruik; SPF-WP=4.7) of een stijging van 26% Figuur 1: Bijdrage van de warmtepomp in functie van het backup-vermogen (uit Code van Goede Praktijk) 4.4 Invloed van het zonnecollector oppervlakte EPB-resultaten In de standaard installatie hebben de zonnecollectoren een oppervlakte van 5,2 m². In de onderstaande vergelijking worden installaties gebruikt waarbij de zonnecollectoren warmte leveren aan zowel de verwarming als sanitair warm water. Hierbij wordt ook een buffervat gebruikt voor de verwarming, hierdoor werd ook een extra circulatiepomp toegevoegd tussen het buffervat en de verwarming. In Tabel 8 worden de resultaten vergeleken indien het oppervlakte van de zonnecollectoren wordt gehalveerd en verdubbeld. Hoe groter het collectoroppervlakte, hoe lager het E-peil. Het verschil in E-peil is echter wel klein. 3 ANRE; 2005; Code van goede praktijk voor de toepassing van warmtepompsystemen in de woningbouw; Ministerie van de Vlaamse Gemeenschap, afdeling natuurlijke rijkdommen en energie (ANRE); 2005; 13
269 IWT-TETRA : Zongekoppelde Warmtepompsystemen Eindverslag Werkpakket 6: Code van Goede Praktijk en selectie- en berekeningstool Auteurs: Leen Goovaerts, Dries Van Aken, Jan Verheyen, John Veeken, Maarten Sourbron Tabel 8: Invloed van het oppervlakte van de zonnecollectoren op de EPB-resultaten bij warmtevoorziening voor sanitair warm water en verwarming. Woning Oppervlakte zonnecollectoren [m²] Bodem/water Warmtepomp Lucht/water warmtepomp E-peil Q heat,final,a Q water,final,a E-peil Q heat,final,a Q water,final,a SFH15 2, ,1 3695, ,8 3695,7 SFH15 5, ,6 3110, ,6 3110,4 SFH15 10, ,0 2788, ,2 2788,4 SFH45 2, ,1 4149, ,4 4149,9 SFH45 5, ,3 3504, ,8 3504,8 SFH45 10, ,8 3047, ,9 3047,3 SFH100 2, ,2 4558, ,0 4558,0 SFH100 5, ,6 4107, ,8 4107,2 SFH100 10, ,3 3729, ,6 3729, Effect van het zonnecollectoroppervlak in EPB en Polysun Polysun geeft gelijkaardige resultaten als EPB voor het varieren van de collectoroppervlakte. Dit geeft aan dat EPB deze parameter op een correcte manier inrekent. Woning Oppervlakte zonnecollectoren [m²] EPB Verschil in eindenergieverbruik t.o.v. 5,2m² Bodem/water Warmtepomp Polysun SFH15 2,6 +7% +13% SFH15 5, SFH15 10,4-5% -13% SFH45 2,6 +5% 7% SFH45 5, SFH45 10,4-4% -7% SFH100 2,6 +2% 2% SFH100 5, SFH100 10,4-2% -2% Verschil in eindenergieverbruik t.o.v. 5,2m² Belangrijk bij dit resultaat is dat het effect van de oppervlakte van de zonnecollectoren sterk afneemt voor de slecht geïsoleerde woning SFH Invloed ventilatiesysteem In voorgaande resultaten werd gebruik gemaakt van ventilatiesysteem A (natuurlijke toevoer en vrije afvoer). Tabel 9 en Tabel 10 geven de invloed weer van het ventilatiesysteem voor respectievelijk woning SFH15 en SFH45 met beide warmtepompen. Voor de woning SFH15 verandert het E-peil niet. Het karakteristiek jaarlijks primair energieverbruik van de woning verandert wel, maar te weinig om het E-peil te veranderen. Door een mechanische 14
270 IWT-TETRA : Zongekoppelde Warmtepompsystemen Eindverslag Werkpakket 6: Code van Goede Praktijk en selectie- en berekeningstool Auteurs: Leen Goovaerts, Dries Van Aken, Jan Verheyen, John Veeken, Maarten Sourbron aan- en afvoer heeft de woning minder ventilatieverliezen, hierdoor moet de warmtepomp minder warmte opwekken (daling P prim,heat,a). De mechanische ventilatie verhoogt het primair energieverbruik hulpenergie. De energie die bespaard wordt op het verbruik van de warmtepomp, wordt verbruikt voor de mechanische ventilatie. Hierdoor ondervindt het karakteristiek jaarlijks primair energieverbruik maar een kleine verandering. Voor de bodem/water warmtepomp stijgt dit energieverbruik en voor de lucht/water warmtepomp daalt dit energieverbruik. Voor de lucht/water warmtepomp kan meer energie bespaart worden, omdat minder warmte moet worden opgewekt, dan voor de bodem/water warmtepomp. Tabel 9: Invloed van het ventilatiesysteem voor woning SFH15. Bodem/water Lucht/water warmtepomp SFH15 warmtepomp Ventilatiesysteem Ventilatie- Ventilatie- Ventilatie- A systeem D systeem A systeem D K-peil E-peil Q heat,final,a [MJ] 7173,1 5406,2 8088,8 6096,4 Q water,final,a [MJ] 2700,7 2700,7 2700,7 2700,7 P kar,prim,a [MJ] 31898, , , ,6 P prim,hulp,a [MJ] 2453,5 7059,2 2453,5 7059,2 P prim,vent,a [kwh] 0,0 511,7 0,0 511,7 Q vent,loss [MJ] 20894, , , ,8 P prim,heat,a [MJ] 17932, , , ,9 Door het aanpassen van het ventilatiesysteem verandert het E-peil wel voor de installaties van de woning SFH45. Het E-peil stijgt wanneer mechanische ventilatie wordt toegepast. Voor deze woning veranderen de ventilatieverliezen niet, waardoor het verbruik van de warmtepomp ook niet wijzigt. De mechanische ventilatie verbruikt echter wel energie, waardoor het karakteristiek jaarlijks primair energieverbruik stijgt. Dit resulteert in een stijging van het E-peil. Aangezien de mechanische ventilatie evenveel verbruik voor de bodem/water warmtepomp en de lucht/water warmtepomp, stijgt het E-peil met dezelfde waarde. Tabel 10: Invloed van het ventilatiesysteem voor woning SFH45. Bodem/water Lucht/water warmtepomp SFH45 warmtepomp Ventilatiesysteem Ventilatie- Ventilatie- Ventilatie- A systeem D systeem A systeem D K-peil E-peil Q heat,final,a [MJ] 12341, , , ,6 Q water,final,a [MJ] 2866,4 2866,4 2866,4 2866,4 P kar,prim,a [MJ] 42974, , , ,3 P prim,hulp,a [MJ] 3154,5 7760,2 3154,5 7760,2 P prim,vent,a [kwh] 0,0 511,7 0,0 511,7 Q vent,loss [MJ] 20890, , , ,0 P prim,heat,a [MJ] 30854, , , ,5 15
271 IWT-TETRA : Zongekoppelde Warmtepompsystemen ZON-WARM Eindverslag: Verspreiding naar de ruimere doelgroep WP7T1: Website WP7T2: Publiceren van (wetenschappelijke) artikels WP7T3: Studiedagen/workshops Vakgroep Thermotechniek, Technologiecampus De Nayer Faculteit Industriële Ingenieurswetenschappen, KU Leuven Jan De Nayerlaan 5, 2860 Sint-Katelijne-Waver, België Tel.: + 32 (0) Maarten.Sourbron@kuleuven.be Auteurs: Redactie: Leen Goovaerts Dries Van Aken Jan Verheyen John Veeken Maarten Sourbron
272 IWT-TETRA : Zongekoppelde Warmtepompsystemen Eindverslag Werkpakket 7: Verspreiding naar de ruimere doelgroep Auteurs: Leen Goovaerts, Dries Van Aken, Jan Verheyen, John Veeken, Maarten Sourbron Copyright KU Leuven Zonder voorafgaande schriftelijke toestemming van zowel de auteur(s) als de redacteur(s) is overnemen, kopiëren, gebruiken of realiseren van deze uitgave of gedeelten ervan verboden. Voor aanvragen tot of informatie i.v.m. het overnemen en/of gebruik en/of realisatie van gedeelten uit deze publicatie, wend u tot KU Leuven Campus De Nayer, Jan De Nayerlaan 5, B-2860 Sint-Katelijne-Waver, of via iiw.thomasmore.denayer@kuleuven.be. Voorafgaande schriftelijke toestemming van de redacteur(s) is eveneens vereist voor het aanwenden van de in dit rapport beschreven (originele) methoden, producten, schakelingen en programma s voor industrieel of commercieel nut. 1
273 IWT-TETRA : Zongekoppelde Warmtepompsystemen Eindverslag Werkpakket 7: Verspreiding naar de ruimere doelgroep Auteurs: Leen Goovaerts, Dries Van Aken, Jan Verheyen, John Veeken, Maarten Sourbron Inhoudstafel 1 Taakbeschrijving (uit projectaanvraag) Taak 1 (WP7T1): Website Taak 2 (WP7T2): Publiceren van (wetenschappelijke) artikels Taak 3 (WP7T3): Studiedagen/workshops Website ZonWarm Wetenschappelijke en technische artikels over gecombineerde warmtepompzonnecollector-installaties Presentaties op nationale congressen Artikels in nationale tijdschriften Artikels in proceedings van internationale congressen Posters op internationale congressen Studiedagen en workshops over gecombineerde warmtepomp-zonnecollector-installaties Symposium: Combined solar thermal and heat pump systems for residential applications, 8 april Mede-organisator van het Warmtepomp Symposium, Warmtepompplatform, ODE- Vlaanderen, 11/09/2013 en 10/09/ Bijlagen
274 IWT-TETRA : Zongekoppelde Warmtepompsystemen Eindverslag Werkpakket 7: Verspreiding naar de ruimere doelgroep Auteurs: Leen Goovaerts, Dries Van Aken, Jan Verheyen, John Veeken, Maarten Sourbron 1 Taakbeschrijving (uit projectaanvraag) 1.1 Taak 1 (WP7T1): Website Type : valorisatie-activiteit Er zal een website over het project aangemaakt worden. Deze website zal een overzicht geven van het project, van de gerealiseerde taken, van de projectuitvoerders en de deelnemende bedrijven, Lessius Mechelen Campus De Nayer beschikt momenteel over een eigen website waarmee de projecten kunnen beheerd worden en de resultaten zowel afgeschermd kunnen worden (zodat ze enkel toegankelijk zijn voor de gebruikersgroep tijdens de uitvoering van het project) als publiek kunnen verspreid worden. Resultaat: website ZON-WARM 1.2 Taak 2 (WP7T2): Publiceren van (wetenschappelijke) artikels Type : valorisatie-activiteit Een beschrijving van de belangrijkste projectresultaten (bv. selectie- en berekeningstool, Code van Goede Praktijk, een vergelijking van de verschillende concepten) zal aan het einde van het project gepubliceerd worden in technische tijdschrijften die gericht zijn op de bedrijven uit de brede doelgroep, m.n. architecten en studiebureaus, producenten, verdelers en installateurs, putboorders,... (bv. De onderneming, Technisch Management, Verwarming en Ventilatie, Ingenieursblad, Cool & Comfort, ). Deze publicaties zullen ook een uitnodiging bevatten voor de studiedagen die tijdens het project zullen georganiseerd worden. Een beschrijving van de simulaties en een analyse van de eerste simulatieresultaten zullen in de loop van het project neergeschreven worden in een artikel voor publicatie in de proceedings van een internationaal wetenschappelijk congres. Een analyse van alle simulatieresultaten zal na afloop van het project neergeschreven worden in een artikel voor publicatie in een internationaal wetenschappelijk tijdschrift. Resultaat: (wetenschappelijke) artikels koppeling zonthermie/warmtepomp 1.3 Taak 3 (WP7T3): Studiedagen/workshops Type : valorisatie-activiteit Twee studiedagen zullen in de loop van het project georganiseerd worden: - technologievoorstelling en projectvoorstelling (na jaargang 1) - voorstelling van case studies en de projectresultaten (na jaargang 2) De workshops worden zo opgevat dat ze specifieke deelaspecten, gericht op een deel van het doelpubliek, meer toelichten. Workshops mogelijk over: - selectietool systeemconfiguraties - selectie- en berekeningstool koppeling zonneboiler/warmtepomp - Code van Goede Praktijk voor de koppeling van warmtepompsystemen met zonthermie in de - woningbouw 3
275 IWT-TETRA : Zongekoppelde Warmtepompsystemen Eindverslag Werkpakket 7: Verspreiding naar de ruimere doelgroep Auteurs: Leen Goovaerts, Dries Van Aken, Jan Verheyen, John Veeken, Maarten Sourbron - meetcampagne systeemrendement - reële systemen (eventueel te organiseren in de case studies) - verrekening EPB Deze workshops kunnen plaatsvinden tijdens studiedagen, maar worden zo uitgewerkt dat ze op zich kunnen bestaan en kunnen geëxporteerd naar vakopleidingen, hogeschool- of universiteitsopleidingen, beurzen. Resultaat: studiedagen en workshops koppeling zonthermie/warmtepomp 4
276 IWT-TETRA : Zongekoppelde Warmtepompsystemen Eindverslag Werkpakket 7: Verspreiding naar de ruimere doelgroep Auteurs: Leen Goovaerts, Dries Van Aken, Jan Verheyen, John Veeken, Maarten Sourbron 2 Website ZonWarm De website werd opgebouwd om algemene projectinformatie naar het brede publiek te verspreiden en om de leden van de gebruikersgroep te informeren over de stand van zaken en de vergaderingen van het project. Deze site blijft nog 6 maanden na het project actief. De rapporten worden nadien naar de (nog te bouwen) website van de vakgroep Thermotechniek overgebracht. De website bevat een publiek deel en een afgeschermd deel waarin de data voor de leden, verslagen van de vergaderingen,... worden verzameld (zie Figuur 1). Figuur 1: Screenshot van de projectwebsite: zon-warm.lessius.eu 2.1 Wetenschappelijke en technische artikels over gecombineerde warmtepomp-zonnecollector-installaties De resultaten van het project werden naar het grote publiek verspreid door middel van een reeks artikelen in verschillende tijdschriften. In de bijlage bij dit werkpakket zijn de presentaties en artikels opgenomen. 2.2 Presentaties op nationale congressen - Jan Verheyen (presentatie), Maarten Sourbron (2013), Solar Thermal and Heat Pump Systems & Domestic Hot Water production, 6de Warmtepompsymposium 11/09/2013, Technologiecampus De Nayer, Sint-Katelijne-Waver, Belgium - John Veeken, Leen Goovaerts, Dries Van Aken,Jan Verheyen, Maarten Sourbron(presentatie) (2014), IWT-TETRA ZonWarm: Gecombineerde zonthermie en warmtepompen in residentiële 5
277 IWT-TETRA : Zongekoppelde Warmtepompsystemen Eindverslag Werkpakket 7: Verspreiding naar de ruimere doelgroep Auteurs: Leen Goovaerts, Dries Van Aken, Jan Verheyen, John Veeken, Maarten Sourbron toepassingen, 7de Warmtepomp Symposium, 10 September 2014, Technologiecampus De Nayer, Sint-Katelijne-Waver, Belgium 2.3 Artikels in nationale tijdschriften Er zijn tijdens dit project 5 artikels gepubliceerd in nationale vakbladen of tijdschriften, waarvan 3 (Power Pro, Sanilec en de Onderneming) waarin specifieke resultaten van het project zijn opgenomen. - Benjamin Verfaillie, Maarten Sourbron (2013), Hoeveel energie bespaar je met een warmtepomp, 7 mei Maarten Sourbron (2013), Energiezuinig: warmtepomp (tekst van Leen De Moor), Gazet Van Antwerpen, oktober Leen Goovaerts, Dries Van Aken, John Veeken, Jan Verheyen, Maarten Sourbron (2014), Thermische zonnecollectoren en warmtepompen werken samen?, Power Pro Magazine september Leen Goovaerts, Dries Van Aken, John Veeken, Jan Verheyen, Maarten Sourbron (2014), Betere prestaties door combinatie warmtepomp-zonneboiler, Sanilec nr. 164 November 2014, p John Veeken, Maarten Sourbron (2014), Prestaties van een combinatie thermische zonnecollectoren en een warmtepomp: Impact van regelstrategie en hydraulische aansluiting van doorslaggevend belang, De Onderneming, November Technologieverkenning rond zongekoppelde warmtepompsystemen voor VolTa (dubbelartikel, mei 2015) 2.4 Artikels in proceedings van internationale congressen - J. Veeken*, J. Verheyen, M. Sourbron (2014), Impact of storage tank control and hydraulic configuration on solar heat pump performance, 9th International Conference on System Simulation in Buildings (SSB2014), December 10-12, 2014, Liège, Belgium - (aanvaard voor publicatie) Maarten Sourbron, Nezrin Ozalp, Determination of heat transfer characteristics of solar thermal collectors as heat source for a residental heat pump, Proceedings of the ASME 2015 International Mechanical Engineering Congress & Exposition, IMECE2015, November 13-19, 2015, Houston-TX 2.5 Posters op internationale congressen - Verheyen, J., Sourbron, M. (2014). Influence of domestic hot water demand profiles on energy performance of combined solar thermal and heat pump systems (accepted). World Sustainable Energy Days 2014, Innovative Building Technologies Conference (WSED next). Wels, Austria, February
278 IWT-TETRA : Zongekoppelde Warmtepompsystemen Eindverslag Werkpakket 7: Verspreiding naar de ruimere doelgroep Auteurs: Leen Goovaerts, Dries Van Aken, Jan Verheyen, John Veeken, Maarten Sourbron 3 Studiedagen en workshops over gecombineerde warmtepompzonnecollector-installaties 3.1 Symposium: Combined solar thermal and heat pump systems for residential applications, 8 april 2013 In het kader van het IEA-SHC task 44 / HPP annex 38-project Solar and Heat Pump systems ( Programma: - 13h20: Welcome Jan Ivens, KU Leuven-Thomas More Mechelen - 13h30: Solar and heat pumps systems - Task 44 presentation Jean-Christophe Hadorn, Base Consultants - 14h00: Belgian Heat Pump Market Jan Lhoëst, Warmtepomp Platform - 14h15: Solar thermal energy in Belgium: more than only sanitary hot water Wim Persoons, ATTB-Belsolar - 14h30: Lab test results of an actively controlled heat pump for integration of renewable electricity - Dirk Vanhoudt, VITO - 15h00: Hydraulic integration of heat pumps with combistores Michel Haller, Institut für Solartechnik - 16h00: A comparative analysis of market-available solar thermal heat pump systems Jörn Ruschenburg, Fraunhofer-ISE - 16h30: Effects of charging configuration of a hot water storage tank on stratification and storage capacity Brecht Baeten, Khlim - 17h00: Workshop Team Zon-Warm, Thomas More Mechelen 3.2 Mede-organisator van het Warmtepomp Symposium, Warmtepompplatform, ODE-Vlaanderen, 11/09/2013 en 10/09/2014 Gelet op de krappe timing voor de uitvoering van de projecttaken na de projectverlenging (heropbouw labo en personeelsverloop, zie Eindverslag: projectoverzicht ), is er voor gekozen om zelf geen eigen symposium te organiseren, maar de resultaten te verspreiden via het jaarlijkse Warmtepompsymposium van het Warmtepompplatform van ODE-Vlaanderen. Ook zonder deze timing-problemen creëert deze aansluiting de mogelijkheid om volop op de inhoud te focussen, terwijl het beoogde publiek zeker aanwezig is. - 6 de Warmtepomp Symposium, 11 september de Warmtepomp Symposium, 10 september
279 IWT-TETRA : Zongekoppelde Warmtepompsystemen Eindverslag Werkpakket 7: Verspreiding naar de ruimere doelgroep Auteurs: Leen Goovaerts, Dries Van Aken, Jan Verheyen, John Veeken, Maarten Sourbron 4 Bijlagen 8


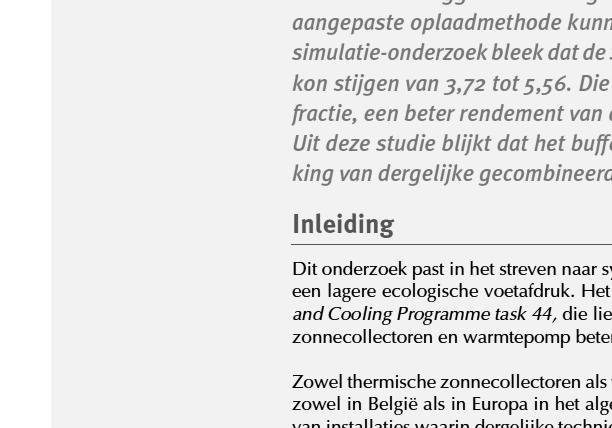


280


281


282


283


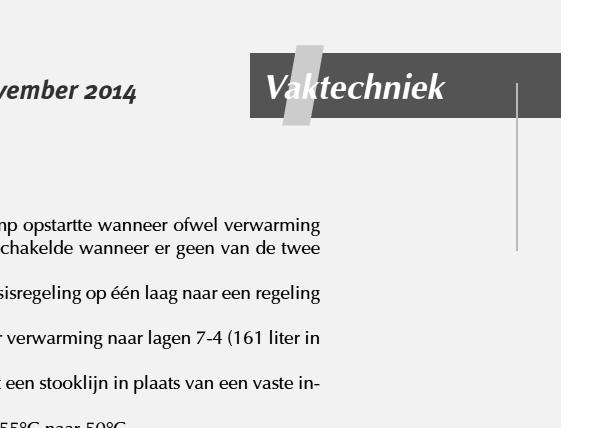


284


285


286


287


288

289 SYMPOSIUM APRIL 8TH 2013 BELGIUM K.H.Kempen and Lessius are joining up to become more. COMBINED SOLAR THERMAL AND HEAT PUMP SYSTEMS FOR RESIDENTIAL APPLICATIONS Both heat pumps and solar thermal collectors have gained high popularity in the European and Belgian market. The similarity of these trends is striking, though unfortunately, it remains unknown to what extent the components were installed in combined systems. Combinations of heat pump and solar thermal systems applied for residential heating and domestic hot water production are considered potentially interesting to contribute to the targets as set by the EPBD (energy performance of buildings directive) and RESD (directive on the promotion of energy from renewable sources). These systems are able to improve the energy performance of buildings and augment the share of energy from renewable energy sources. Combined solar thermal heat pump systems are currently further improved by research activities on optimizing control and system performance both on an international (IEA-SHC task 44 / Annex 38) as on a national level (IWT-TETRA: Zon-Warm). The potential of these combined systems is gradually confirmed and elimination of pitfalls for long-term successful commercialization is aimed at. Thomas More Mechelen and THELES research group are happy to host the symposium on combined solar thermal and heat pump systems for residential applications. The speakers from research centers, industry and engineering companies will share their experiences in enhanced design and operation of solar thermal heat pump systems for residential heating and domestic hot water production. This symposium will give insight in recent developments in design and application of solar heat pump systems for residential applications. It will focus both on the design as on practical applications including results from surveys and possibilities for performance improvements. Participation is useful for professionals employed in HVAC engineering, research and development, architects, product developers and suppliers of heat pump, solar thermal and combined systems. Join this unique event to meet international experts, researchers and leading professionals at the symposium on solar thermal heat pumps for residential applications. This symposium is organized in cooperation with IEA-SHC task 44 / Annex 38 and IWT (government agency for Innovation by Science and Technology). Organizers Contact Jan Verheyen, tel + 32 (0) , jan.verheyen@thomasmore.be Benjamin Verfaillie, tel + 32 (0) , benjamin.verfaillie@thomasmore.be

 Registration: deadline: march 25th 2013 www.thomasmore.")
: per person: 75 - per student: 25 Industry Fair: Industry and companies are given the opportunity to present their products and or services at a poster session in the vicinity of the main")

290 Programme 13h00: Coffee 13h20: Welcome Jan Ivens, KU Leuven-Thomas More Mechelen 13h30: Solar and heat pumps systems - Task 44 presentation Jean-Christophe Hadorn, Base Consultants 14h00: Belgian Heat Pump Market Jan Lhoëst, Warmtepomp Platform 14h15: Solar thermal energy in Belgium: more than only sanitary hot water Wim Persoons, ATTB-Belsolar 14h30: Lab test results of an actively controlled heat pump for integration of renewable electricity Dirk Vanhoudt, VITO 15h00: Hydraulic integration of heat pumps with combistores Michel Haller, Institut für Solartechnik Practical Date: April 8th 2013, 13h00-18h00 Location: Thomas More, Zandvoortvest 60, 2800 Mechelen, Belgium Campus De Vest (aula 2) Registration: deadline: march 25th Registration Fee (Incl. VAT): per person: 75 - per student: 25 Industry Fair: Industry and companies are given the opportunity to present their products and or services at a poster session in the vicinity of the main symposium aula. (The fee for non-members of the IWT-TETRA Zon-Warm project consortium is 500 (605 incl. VAT)). 15h30: Coffee break 16h00: A comparative analysis of market-available solar thermal heat pump systems Jörn Ruschenburg, Fraunhofer-ISE 16h30: Effects of charging configuration of a hot water storage tank on stratification and storage capacity Brecht Baeten, Khlim 17h00: Workshop Team Zon-Warm, Thomas More Mechelen 18h00: Closing reception at the vicinity of the industry fair (industry fair: to be acknowledged). Companies (both members and non-members of the IWT- TETRA Zon-Warm project consortium) can get in contact with the symposium organization at the address stated below to obtain further information. Symposium language: English
291 EnErgiEzuinig warmtepomp ll tekst: leen de moor 24 wonen zaterdag 5 en zondag 6 oktober Belgische gezinnen hebben in 2012 een warmtepomp gekocht om hun huis te verwarmen. Dat is nog steeds niet veel. Wat houdt ons tegen? De nog steeds hoge investering en het feit dat de efficiëntie van een lucht/water warmtepomp, het meest verkochte type, het laagst is in de winter, wanneer we het meest verwarming nodig hebben? Toch is het een milieuvriendelijk en energiezuinig systeem en kan het (eventueel in combinatie met een fossiele brandstof) een goede oplossing zijn. Omgevingswarmte Werkingsprincipe van de compressiewarmtepomp 1 Verdamper Compressor 4 Expansieventiel 2 3 Condensor Nuttige warmte Hoe werkt een warmtepomp? De werking is gebaseerd op drie principes uit de fysica: Bij verdamping wordt warmte opgenomen en bij condensatie komt warmte vrij. Normaal verdampt een vloeistof bij 100 C en als ze afkoelt, wordt ze opnieuw vloeibaar. Bij lage druk verdampt die vloeistof op een lagere temperatuur, als de druk wordt verhoogd, verdampt ze op een hogere temperatuur. De temperatuur van een gas stijgt als de druk verhoogt. Een warmtepomp onttrekt warmte van een bepaalde temperatuur aan een bron (afhankelijk van het type aan de aarde, grondwater of buitenlucht) en geeft die warmte bij een hogere temperatuur af aan een andere bron (het watercircuit van een verwarmingssysteem). Hoe gebeurt dat? In de warmtepomp zit een vloeistof (vaak het koelmiddel genoemd) die verdampt bij lage druk op 0 C. Bij het verdampen onttrekt de vloeistof warmte aan de bron (lucht of aarde). Met een compressor wordt de ontstane damp onder hogere druk gebracht waardoor kookpunt en temperatuur stijgen. De warme damp wordt dan in contact gebracht met het watercircuit van de verwarming, condenseert en geeft daarbij zijn warmte af, waardoor we warm water hebben in ons verwarmingssysteem. Via een expansieventiel wordt de druk vervolgens verlaagd en kan de cyclus opnieuw beginnen. De energie die bij dit proces nodig is, komt dus uit de lucht of de bodem, maar er is ook nog elektriciteit (of gas, of stookolie) nodig om de compressor aan te drijven. Maarten Sourbron, doctor-assistent aan Thomas More-Campus De Nayer en ook verbonden aan het Warmtepompplatform: Een voorwaarde voor een efficiënte werking is dat de warmtepomp verbonden is met een verwarmingssysteem op lage temperatuur, meestal vloerverwarming. Door de lage temperatuur heb je immers een groot oppervlak nodig om een ruimte op deze manier te verwarmen. Als je dat met radiatoren zou doen, zouden die heel groot moeten zijn. efficiëntie Hoe efficiënt een warmtepomp is, kan je afleiden van de COP of de coëfficiënt of performance. Hoe hoger dat cijfer is, hoe beter. De COP hangt af van het verschil tussen de temperatuur van de bron en die van het warmteafgiftesysteem (uw verwarming), want als dat verschil groot is, moet de compressor extra veel energie gebruiken om de druk en de temperatuur van de warmtedragende vloeistof te verhogen, en gaat je winst van de gratis energie uit aarde of lucht er dus aan. Een goede warmtepomp levert voor elke kwh die de compressor verbruikt tussen de 2,5 en 6 kwh nuttige warmte. De COP is dan 2,5 à 6. De SPF of Seasonal Performance Factor houdt rekening met het energieverbruik van een warmtepomp en het verbruik van randapparatuur zoals pompen over een volledig stookseizoen. types Grond/water: Als de warmtepomp de warmte onttrekt aan grondwater, vraagt dat vrij veel energie en een zware circulatiepomp om het grondwater rond te sturen. Wordt de warmte onttrokken aan de aarde, dan zijn er twee mogelijkheden. Ofwel leg je een horizontaal buizencircuit aan in de grond rond je huis, waardoor vloeistof circuleert en de aardwarmte kan opnemen. Nadeel: je hebt een grote oppervlakte nodig, ongeveer twee à drie keer zo groot als die van de oppervlakte die je moet verwarmen. Je kunt ook een verticaal circuit aanleggen en daarvoor een boring verrichten tot 50 à 100 meter diep. Dat kost vrij veel. Het voordeel is dat de aarde op die diepte het hele jaar door een constante temperatuur heeft van ongeveer 10 à 12 C. Lucht/water: Dan wordt de warmte gehaald uit de buitenlucht. Dit vergt een veel minder grote investering dan een grond/water systeem en de apparatuur neemt ook veel minder plaats in beslag. Nadeel: in de winter, wanneer het het koudst is en we dus constant verwarming nodig hebben, is de COP van dit type warmtepomp het laagst. De luchttemperatuur is dan immers laag en de compressor moet veel meer energie leveren om de druk en de temperatuur te verhogen. waarom kiezen voor een warmtepomp? Het is een milieuvriendelijk en energiezuinig systeem, zegt Maarten Sourbron. De elektriciteit die nodig is voor de compressor wordt wel gemaakt met gas of kolen, maar dat aandeel is veel kleiner dan wanneer je dat gas rechtstreeks zou gebruiken om je woning te verwarmen. Blijft natuurlijk wel de hogere investering en het feit dat de efficiëntie afhangt van het temperatuurverschil tussen de bron en de gewenste watertemperatuur voor je verwarming. De voorstanders van warmtepompen verwachten wel heil van de nieuwe EU-richtlijn ecodesign, die zopas van kracht werd. Die heeft een label voor energie-efficiëntie in het leven geroepen voor verwarmingstoestellen, vergelijkbaar met het energielabel van huishoudtoestellen. Vanaf september 2015 moet elk verwarmingstoestel verplicht zo n label dragen. Gasen stookolieketels vallen waarschijnlijk onder categorie C of D, terwijl warmtepompen A +++ kregen toegekend. We hopen dat dit een stimulans zal zijn voor de sector, want het aantal verkochte warmtepompen stijgt zeer langzaam. Als je van plan bent bij een grondige renovatie of bij een nieuwbouw een warmtepomp te installeren, breng dan je architect van bij het begin op de hoogte. Hij moet de rest van het verwarmingssysteem er helemaal op afstemmen. Elke deelnemer aan het plannings- en bouwproces moet er van op de hoogte zijn om te kunnen zorgen voor een optimale uitvoering en rendement.
292 P71, Page 1 Impact of storage tank control and hydraulic configuration on solar heat pump performance J. Veeken 1*, J. Verheyen 1, M. Sourbron 1 (1) KU Leuven (University of Leuven), Department of Mechanical Engineering, Technology Campus De Nayer, Sint-Katelijne-Waver, Belgium 1. ABSTRACT For a solar heat pump system, combining solar thermal collectors and a heat pump, with a combined storage tank, the system performance is evaluated for different hydraulic configurations and controls of the storage tank. The results show the importance of an adequate hydraulic configuration and control of the storage tank to support the process of combined heat production by the heat pump and solar thermal collectors and heat distribution to space heating and domestic hot water. Adapting demand side temperature levels and correctly inserting the produced heat from heat pump and solar thermal collectors in the storage tank increases the system efficiency substantially. The Seasonal Performance Factor (SPF) changed from 3.72 to 5.56 by changing storage tank sensor positions and set points of the heat pump control, correctly addressing the produced heat to storage tank levels and changing the positions from where the stored heat is extracted from storage. The SPF increase is caused by an augmented share of solar energy in the overall system balance, an increased heat pump efficiency and a reduced storage thermal losses. This work concludes that the storage tank is a crucial factor in these system types with two collaborating heat sources. Keywords: solar thermal, heat pump, hydraulics, control 2. INTRODUCTION This research is conducted in the framework of IEA Solar Heating and Cooling (SHC) Programme task44, investigating space heating and domestic hot water systems that have an increased renewable energy share, lower electricity demand than competitive solutions, lower primary energy demand, and lower CO2 emission depending on the electricity mix feeding the heat pump. IEA Solar Heating and Cooling (SHC) Programme task44 operated from to contribute to better understanding of S+HP (Solar and Heat Pump) systems (task44.iea-shc.org/). Both heat pumps and solar thermal collectors have gained considerable popularity in the European and Belgian market. The similarity of these trends is striking, though unfortunately, it remains unknown to what extent these components are installed in combined systems. Combinations of heat pump and solar thermal systems applied for residential heating and domestic hot water production are considered potentially interesting to contribute to the targets as set by the EPBD (energy performance of buildings directive) and RESD (directive on the promotion of energy from renewable sources). These systems are able to improve the energy performance of buildings and augment the share of energy from renewable energy sources. The potential of these combined systems is gradually confirmed and elimination of pitfalls for long-term successful commercialization is aimed at. The combined solar heat pump installation has to supply heat at the required conditions (Figure 1): (1) the correct quantity, (2) the required temperature and (3) at the right moment in time. Domestic hot water is characterised by a peaked demand, which implies a high thermal 9th International Conference on System Simulation in Buildings, Liege, December 10-12, 2014
293 P71, Page 2 power and at a relatively high temperature of C. Space heating has a more flat demand throughout the day, at a lower temperature of C. Because of the increasing insulation levels, the yearly heat demand for space heating is becoming equal to the yearly heat demand for domestic hot water. Figure 1: Two heat suppliers (solar thermal collectors and heat pumps) deliver heat at two temperature levels for Space Heating and Domestic Hot Water. Solar thermal collectors and the heat pump produce the required heat by using either the sun or a low temperature heat source such as the ground or the outside air. Compared to a boiler using fossil fuels, these renewable energy sources are, from the point of view of the installation that is, (1) limited in heat quantity, (2) limited in heat power and (3), in the case of solar energy, not always available. These properties have an important repercussion on the design and the control of solar heat pump systems. Heat for space heating and domestic hot water has to be produced and delivered by either the heat pump or the solar thermal collectors. Heat pumps can deliver heat at a performance factor (supplied heat versus required electricity use) in the range of 2.5 to 5, while solar thermal collectors do that at a performance factor of roughly , although factors above 250 are also measured (Goovaerts et al., 2014). Therefore, the solar heat pump system should be designed and controlled to give priority to the solar thermal collectors. The typically peaked domestic hot water demand and the limited availability in time and thermal power of solar energy, imposes the use of thermal buffering in the solar heat pump system. The typical system configurations depicted as concepts of various combinations of components within SHP systems in the publication by Henning et al. (2008) are used in the task44-project as reference combinations (Figure 2). 9th International Conference on System Simulation in Buildings, Liege, December 10-12, 2014
294 P71, Page 3 Figure 2: Overview of existing SHP system configurations; numbering according to original publication [Henning et al.; 2008]. This paper focusses on a variation of solar heat pump system nr. 4, with a combi-storage tank storing heat for both space heating and domestic hot water production. A version of the system was installed as a test-setup and a simulation model of this system was made in the Polysun software,as shown in Figure 3. 9th International Conference on System Simulation in Buildings, Liege, December 10-12, 2014
295 P71, Page 4 Figure 3: Solar heat pump system configuration with combi-storage tank as implemented in the Polysun software. The simulation analysis in this paper focusses on the impact of the hydraulic configuration and control settings on the overall performance of the solar heat pump systems. Starting from the reference system as it was installed in the test-setup, the position of hydraulic connections are varied, and therefore the reserved storage volume for either domestic hot water, space heating or the heat exchanger of the solar thermal collectors. Furthermore, control strategy is varied by adapting dead band parameters and applying adapted control strategies to have a better control to heat the different sections in the combi-storage tank. 3. SIMULATION MODEL The parameters of the reference system are presented in Table 1. Table 1: Parameters of the reference system. System component Parameter value Building Heated area (m²) 140 Specific heating energy demand (kwh/m²/year) 15.6 Domestic hot water use (l/day) 140 Domestic hot water draw-off temperature ( C) 45 (55, see Table 2) Ground coupled heat pump Heat pump heating power (0/35) (kw) 5 Single U ground loop length (m) 86 Solar collector Flat plat solar collector area (m²) 8.6 Combi-storage tank Volume (liter) 512 9th International Conference on System Simulation in Buildings, Liege, December 10-12, 2014
 and (FprEN 16147 2010) and is expressed as a medium tapping")
296 P71, Page Building and domestic hot water Further details on the building, of which a view is presented in Figure 4, can be found in Dott et al. (2013). The IEA SHC Task44 DHW draw-off profile is used in this paper which is based on the EU mandate M/324 tapping cycle M (CEN/TC113N380, 2003) and (FprEN ) and is expressed as a medium tapping profile (Haller et al., 2013). This can be considered as valid for a family with an average household size. N Figure 4: View of the buildings showing South and West facades [Dott et al., 2013]. Table 2: Domestic hot water profile as adopted in the simulation model (Haller et al., 2013) Legend: S=Small; Sh=Shower; FC=Floor cleaning; DW= Dish washing; HC=Household cleaning; Ba=Bath tub; Sunday only: bath tub replaces evening shower Nr. Start time (h:min) Energy Q DHW (kwh) Type Flow Rate (Litre/h) 9th International Conference on System Simulation in Buildings, Liege, December 10-12, 2014 Min. Temp. T DHW,set ( C) 1 07: S : Sh : S : S : S : S : S : S : S : FC : S
297 P71, Page : S : DW : S : S : S : S : HC : HC : S : DW : S : Sh Total Sunday only 23 21: Ba The climatic conditions used for the simulations are taken from the Polysun database for Brussels, Belgium. 3.2 Ground properties The characteristics of the ground, considered representative for the Belgian context and used as boundary condition for the simulations of SHP systems are adopted from T44 [Haller et al., 2013] and Geotrainet [McCorry et al., 2011]. Soil warming (average difference between the earth surface temperature and the air temperature): 0.8 C Axial temperature gradient: 0.03 K/m number of earth layers: 1 density of earth layer material: 2500 kg/m³ specific heat capacity of earth layer material: 800 J/(kgK) thermal conductivity of earth layer material: 2 W/(mK) thickness of earth layer 1: 400 m 3.3 Combi-storage tank The combi-storage tank volume of 512l is divided in 12 isothermal layers in the reference simulation model. Layers 1 and 12 contain the volume of the other layer added with the volume of the bulge (Figure 5). The upper part (layers 8-12) is reserved for domestic hot water production, while the lower part (layers 1-7) for space heating. The solar collector heat exchanger is located on the side of the combi-storage tank with 4 inlets so heat enters the storage volume at layers with the corresponding temperature (Figure 5). In the reference system, no separate cold volume at the bottom of the tank is foreseen for the solar collector 9th International Conference on System Simulation in Buildings, Liege, December 10-12, 2014

298 P71, Page 7 heat exchanger. The domestic hot water is heated by an internal coiled stainless steel heat exchanger of 25m and a surface area of 6.45m². 5: Combi-storage tank layout in the simulation model Figure 3.4 Reference system control parameters In the reference system the domestic hot water production is controlled by a temperature sensor located in the upper tank layer (top layer 12), working with a set point of 55 C and a dead-band of +1 C/+5 C. This means that the heat pump starts whenever the upper layer temperature is lower than 56 C and stops at a temperature of 60 C. The space heating control is equal to the domestic hot water control, with a temperature sensor located in layer 7, a set point of 35 C and a dead-band of +1 C/+5 C. The domestic hot water always has priority to space heating. In these simulations no clock is installed in the controller to limit domestic hot water operation to certain hours. Both space heating and domestic hot water controllers are always activated. 3.5 Evaluation criteria The system performance is evaluated by comparing the seasonal performance factor, taking into account all electrical users in the system (heat pump compressor, solar collector pump, heat pump circulation pump and ground loop circulation pump): 9th International Conference on System Simulation in Buildings, Liege, December 10-12, 2014
299 P71, Page 8 SPF = Q SH + Q DHW (kwh therm ) P compr + P circulators (kwh elec ) (1) Additionally, a parameter Availability checks the time the system can provide domestic hot water at the required temperature level, as an indicator for user comfort. Space heating demand is always met in the different simulation runs, which means that thermal comfort is always supplied. Therefore, this criterion is not evaluated further on. Table 3: Hydraulic connection and control parameters adaptations towards improved system performance Adaptation Lay-out of combi-storage tank Heat pump to DHW-layer Heat pump to SH-layer Tank to SH Layer in Layer out Volume (l) Layer in Layer out Volume (l) Layer in Layer out Ref Volume (l) %-59% %-30% %-59% %-30% %-71% %-30% %-78% %-30% %-25% %-25% %-25% %-25% Hydraulic connection, control and simulation parameters In different steps the system performance is increased by adapting hydraulic connections and control parameters. 1. Correcting a control error where the heat pump was set ON with an OR-function on SH and DHW requirements but was set OFF with an AND function on SH and DHW set point. The layer control was adapted from one-layer dead-band control to twolayer set point control 2. Creating a cold zone at the bottom of the storage tank by reducing and moving the space heating volume to layers 7-4 (161 l instead of 296 l) 3. Space heating storage with heating curve control instead of a fixed setpoint 4. Lowering domestic hot water set point from 55 C tot 50 C 5. Reducing the domestic hot water volume to layers 9-12 (176l instead of 216l) 9th International Conference on System Simulation in Buildings, Liege, December 10-12, 2014
. The SPF of the system increases from 3.72 to 5.")
300 P71, Page 9 6. Reducing the domestic hot water volume to layers (135l instead of 216l) Table 3 shows these steps with their impact on the buffer volumes. 4. DISCUSSION AND RESULT ANALYSIS 4.1 General overview In a general overview, the different adaptations clearly show an important increase in system seasonal performance (Figure 6). The SPF of the system increases from 3.72 to 5.56, while no changes are made to the size of the major system components, such as the solar thermal collector area or the storage volume. Only hydraulic connections and control parameters are changed. Figure 6: General overview of the simulation results, showing SPF and systems electrical energy use It is interesting to go through the different steps to explain the cause of the changes in system behaviour. 4.2 Step 1: fixing erroneous control In the reference system, the control logic had an important logical error where SH or DHW operation from the heat pump was switched on when the one of the set point values was trespassed (OR-function). However, the heat pump operation was only switched off when both SH and DHW set point values where satisfied. This means that the storage volume was always heated to DHW set point value (DWH switches off at 60 C in layer 12) even if SH operation was switched on: SH is required when layer 4 drops below 36 C and should switch off when layer 4 reaches 40 C, but due to the logical error in the control, the heat pump only swiches off when layer 12 reaches 60 C. 9th International Conference on System Simulation in Buildings, Liege, December 10-12, 2014
301 P71, Page 10 This means the the whole storage volume is heated because in SH-operation the heat pump injects in layer 4 and ejects from layer 1. Figure 7: Storage tank temperature levels with wrong control logic in the reference system Figure 7 shows that at hour 1 the SH set point is trespassed (layer 4 drops below 36 C), while the DHW set point criterion was satisfied (layer 12 is above 56 C) and that the whole storage tank is heated up afterwards until layer 12 reaches 60 C at hour 6. Together with this adaptation, in this first adaptation the heating control of either DHW- and SH-layers is changed. Where in the reference system the one-layer dead-band control was applied, now the two-layer set point control is installed. This means that two temperature sensors are installed, one in the upper layer of the specific tank volume and one in the lower layer (respectively layers 12 and 8 for DHW and layers 4 and 1 for space heating). If the upper temperature sensor reading drops below the set point, the heatpump starts heating that part of the tank volume, until the lower temperature sensor reading is higher than the lower set point temperature.this ensures that the whole reserved storage volume is heated up by the heat pump, while in the reference system the implemented dead-band was not always able to do this in all circumstances. It does however imposes the use of two temperature sensors per heat pump operation mode (SH or DHW). These measures show the importance of correct control implementation: the system SPF increases from 3.72 to 4.30, while the systems electrical consumption drops with 14.7% from 1182 kwh to 1008 kwh. 4.3 Step 2: Reducing SH volume and ensuring cold storage volume for solar heat exchanger In the reference system, the upper part is heated for domestic hot water (DHW), while the lower part of the tank is kept warm by the heat pump-to-space heating (SH) connection which 9th International Conference on System Simulation in Buildings, Liege, December 10-12, 2014
302 P71, Page 11 is located at the bottom of the tank. Therefore, the heat exchanger (HX) of the solar thermal collectors always sees warm water, hampering solar heat to be stored in the storage tank. Figure 8: The effect of reserving cold storage for the solar heat exchanger on the temperature profile in combi-storage tank on February 5-6 (Top figure-without cold volume; bottom figure-with cold volume) 9th International Conference on System Simulation in Buildings, Liege, December 10-12, 2014
303 P71, Page 12 This is solved in the second adaptation (first hydraulic adaptation), where the lower part of the tank (layers 1 to 3, 135 litre or 26% of the storage volume) is kept cold for the solar collector heat exchanger. The amount of reserved storage volume for space heating is reduced from the volume in layer 7 to 1 to the volume in layers 7 to 4 (296 l to 161 l). Figure 8 shows the effect adaptation step 2 has on the temperature profile in the combistorage tank on two typical winter days, where both days have an important amount of solar radiation. The upper part of Figure 8 shows the result for the system 1, while the lower part for the adapted hydraulic lay-out. The average tank temperature lowers, while more solar heat has been stored: 17.0 kwh instead of 15.4 kwh, or an increase of 10%. On an annual base, the solar fraction (this is the share of solar heat in the whole heat demand) increases from 45.2% to 45.7 %. Although the annual impact is rather limited, the example of Figure shows the impact on colder days with limited solar radiation. On these days, the system is able to capture more solar heat, which reflects in an SPF increase from 4.30 to 4.79, with a corresponding decrease in electrical energy consumption of 11%. Note that the increase in SPF is not only caused by an increased share of solar heat, but also by a decrease of storage losses with 2% and mostly by a more efficient heat pump operation due to the lower overall storage temperatures: the SPF(only heat pump) increases from 3.5 to 3.9. This measure does not influence the availability of domestic hot water, nor the heat supply for space heating. 4.4 Step 3: Heating curve control In the 3 rd adaptation, the temperature control for the space heating layer is adapted from fixed temperature control (at 35 C) to heating curve control. This further reduces the average temperature of the storage tank and increases the SPF to The storage tank losses reduce with another 4% and the SPF(heat pump only) increases to from 3.9 to Step 4-6: Domestic hot water temperature and volume In the last three steps, the parameters of the domestic hot water part are adapted. First, the temperature set point is reduced from 55 C tot 50 C. This increases the SPF to By reducing the storage volume for domestic hot water in the last two steps, the system-spf eventually ends up to be For this last system, the SPF(heat pump only) eventually is increases up to 4.7, the solar fraction becomes 48.7% and the storage heat losses are 6% lower than after the second adaptation, where the cold volume for the solar collectors was introduced. Two remarks should be made for this last adaptation. The temperature setting of 55 C was originally chosen in the project, to prevent the growth of legionella bacteria, although this is not specifically requested by law for residential applications (in Belgium). Reducing the set point temperature to 50 C increases the risk of bacteria growth. Furthermore, by reducing the storage volume for domestic hot water, the availability of DHW decreases to a small extent, certainly in winter months with a low solar irradiation (Figure 9). 9th International Conference on System Simulation in Buildings, Liege, December 10-12, 2014
304 P71, Page 13 Figure 9: Availability reduction by reducing the domestic hot water storage volume Therefore, this measure of reducing the domestic hot water storage volume should be introduced with care, because the comfort is also decreasing. The system performance results should not be evaluated without also evaluating the delivered comfort. 5. CONCLUSION Where typical simulation studies focus on parameter analysis and optimal design or control issues, this paper demonstrates that a huge gain is to be found in a correct control and design of the storage tank and its hydraulic connections. The simulation study clearly shows the important impact the storage tank has on the overall system performance. With equal system design parameters such as heat pump power, solar thermal collector area and storage volume, the seasonal system performance factor is increased from 3.72 in the reference system to 5.56 in the best tuned system. This is achieved merely by changing the hydraulic connections of the storage tank, by adapting the reserved storage volumes for the solar heat exchanger, for space heating and for domestic hot water and by changing the controller settings and adapting the temperature control. The design and installation guidelines that arise from these results are the importance to have a cold volume in the storage tank in order to optimally benefit from the solar thermal collectors (which have a substantially higher performance factor than the heat pump), to avoid mixing of the different storage layers at different temperatures and to reduce the high temperature storage volume as much as possible. This last measure should be implemented with care in order to avoid a decrease in delivered comfort and to avoid the growth of bacteria due to lower storage temperatures. From these results, it must be concluded that high quality and high performance of a solar heat pump system not only depends on system parameters such as the installed solar collector square metres, the COP of the heat pump or the volume of the storage tank, but also on installation related aspects, such as the hydraulic connections and controls of the storage tank. This is an important conclusion for integrated system suppliers, but evenso for quality label 9th International Conference on System Simulation in Buildings, Liege, December 10-12, 2014
305 P71, Page 14 schemes which have the ambition of increasing confidence in the performance of these kind of systems. 6. REFERENCES Dott R., Haller M.Y., Ruschenburg J., Ochs F., Bony J.; 2013; The Reference Framework for System Simulations of the IEA SHC Task 44 / HPP Annex 38 Part B: Buildings and Space Heat Load A technical Report of Subtask C Report C1 part B; Institut Energie am Bau Fachhochschule Nordwestschweiz, IEBau FHNW, Muttenz, Switzerland; September 6, 2013 Goovaerts L., Verheyen J., Van Aken D., Veeken J. and Sourbron M., 2014, Thermische zonnecollectoren en warmtepompen werken samen?, Power Pro Magazine, September 2014 Haller M., Haberl R., Mojic I. and Reber A., 2013, IEA SHC Task 44/HPP Annex 38, Hydraulic Integration of Heat Pumps with Combistores, International Symposium, Combined solar thermal and heat pump systems, for residential applications, April Henning H.-M., Miara M.; 2008; Systems using solar thermal energy in combination with heat pumps 1st concept paper; 64th ExCo meeting; Winterthur, Switzerland; November McCorry M., Jones G.Ll. (eds), 2011, Geotrainet Training Manual for Designers of Shallow Geothermal Systems, Geotrainet, European Federation of Geologists, Brussels. 7. ACKNOWLEDGEMENTS (IF APPLICABLE) This research is conducted in the framework of the IWT-TETRA project SolarHeat. The authors greatly acknowledge the financial support of IWT, the Flemish government agency for Innovation by Science and Technology, and of the collaborating companies of this research project (list is available at 9th International Conference on System Simulation in Buildings, Liege, December 10-12, 2014

306
307

308


309 sanilec.pmg.be Onderzoek CO M BIN ATIE W ARMTEPOMP ZONNEBOILER VAKBLAD VOOR DE INSTALLATEUR p.24 P2A9160 nr.164,editienovember EUR(excl.btw) Verschijntm aandelijks,nietin feb,julien aug DIRK VAN DE W YNCKEL BouwunieTechnieken p.8 "Credibiliteittechnicusverhogen doorfinanciëlestimuli" ALAIN BRACQ ZaakvoerderBracq Alain & Co. p.10 "E ficiënte w orkflow isbasis om tijd en geld te besparen" Op zoek naar een partner die zich ook in allerlei bochten wringt? zie p. 55 THOMASNOW AK Secretaris-generaalEHPA p.15 "Signalen beloven gouden toekom st voordewarmtepomp" Retouradres:ProfessionalM edia G roup,torhoutsesteenweg 226,bus Zedelgem Afgiftekantoor9099 G entx


![M et1,06 TW hneemtbelgiëiets meerdan 1% voorzijn rekening GEOTHERMIEIN OPMARS[DEEL1].28 Overzichtvansystemenvoorenergiezuinige verwarmingenkoelingviaaardwarmte MARKTOVERZICHT LUCHT-W ATERW ARMTEPOMP.](/docs-images/92/108577123/images/310-5.jpg "32 Nieuwighedenopdewarmtepompmarkt HO E GELUIDSHIN DER VENTILATIE VO O RKO M EN [DEEL2].40 Nietiedereenweet hoe hetgoed moet.")


 ISH 10/03/15 14/03/15 M e se Frankfurt Frankfurt(Duitsland)")
= 9 nummers Intekenenviasanilec.pmg.be ofmailnaarabo@pmgroup.be sanilec.pmg.be REDACTIE Directeur-uitgeverAndyNoyez Hoofdredacteurtech.")
310 SANILEC NR.164 NOVEMBER 2014 IN DIT N UM M ER Erisontegensprekelijkeendistinctietuseneenketeleneenwarmtepomp.In hoofdevanheelwatinstalateurswordtdatverschilechtergepercipieerdals eenonoverwinnelijkobstakelom zichaandeinstalatievaneenwarmtepomp te wagen.w ilmen zich wapenen voorde toekomst,dan ishetvan e sentieel belangdatmendurftteanticiperen.ondankshetrelatiefkleineaandeel actievewarmtepompinstalatiesinbelgiëgevendiversesignalen namelijkaan datookonsland zich zalmoeten schikken naar destreefdoelenvaneuropa. PhilipViane SECTORNIEUW S.4 Nieuwtjesenfeitenuitdesector CREDIBILITEITTECHN ICUS VERHO GEN DO O R FIN AN CIELE STIM ULI.8 DeVlaamseinstalatiesectorheeft vertrouwenindeenergiezuinige techniekenvoordetoekomst.m et namewarmtepompenenzonneboilerskennenhetmeestesucces, naarverwachtingvolgtereen stijging in verkoop EFFICIEN TE W O RKFLO W IS BASIS O M TIJD EN GELD TE BESPAREN.10 Kostenbesparendwerken istegenwoordigeenalom bekendestrategieinelke onderneming.hetis echternietde filosofie die AlainBracq,zaakvoerder van Bracq Alain & Co., hanteert SIGNALEN WIJZEN OPGOUDEN TOEKOMSTW ARMTEPOMPEN.15 In hetkadervan onze jaarlijkse W armtepompspecialvroegenwe secretaris-generaalehpa Thomas Nowaknaardebelangrijksteevoluties, dehaalbaarheidvandetoekomstige doelstelingen,endestrategiedie centraalstaatbinnende beleidsarenainbrusel EUROPA EN DEW ARMTEPOMP.19 Zeslandenstaanin voor± 80% van de in totaal77,8 TW h door warmtepompen geproduceerde hernieuwbareenergie in Europa.M et1,06 TW hneemtbelgiëiets meerdan 1% voorzijn rekening GEOTHERMIEIN OPMARS[DEEL1].28 Overzichtvansystemenvoorenergiezuinige verwarmingenkoelingviaaardwarmte MARKTOVERZICHT LUCHT-W ATERW ARMTEPOMP.32 Nieuwighedenopdewarmtepompmarkt HO E GELUIDSHIN DER VENTILATIE VO O RKO M EN [DEEL2].40 Nietiedereenweet hoe hetgoed moet. Enkelesimpele aanwijzingenvolgen maaktnochtansaleen wereldvanverschil EXTRA W ERK GENEREREN DO O R CAM ERA-IN SPECTIE.45 Eeninspectiecamera toontsnelde aard en de locatie van het probleem,waardoor heteficiëntenmet eenminimum aan ergernisenkan wordenopgelost BUILDUPSCHEPTVERHELDERING RO ND LUCHTDICHTBO UW EN.48 Opdonderdagnamiddag25 september verzameldenruim 200 bouw profe sionalsin hetcongres-en meetingcomplex'3 SquareVilage'in Zw ijnaarde (G ent) vooreeninspirerend eventrond luchtdichtbouwen. DeorganisatielaginhandenvanProfesional M edia G roup,uitgevervan o.a.uw vakblad PRO DUCTIN FO.57 Nieuwighedenopdemarkt IW TZONWARM BETEREPRESTATIESMETCOMBINATIE W ARMTEPOMP-ZONNEBOILER.24 Driejaargeledenwerdhetproject'ZonW arm' opgestartdooreenonderzoeksteam vanku Leuven.Hetteam zochteenantwoordopde vraag:'w atisdemeerwaardevaneen zonneboileropeeninstalatiediereedseen warmtepompbevat?' PLT-LEIDIN G EN NIEUW ETECHNOLOGIE VO O R GASLEIDIN GEN.37 Denieuwegeneratieplooibare,gegolfde metalenbuizeninroestvaststaal, pliable tube ofplt,zalhetplaatsenvangasbuizen aanzienlijkvereenvoudigen.verschilende fabrikantenbiedenvolgensdenorm goedgekeurdematerialenaan BEURZEN BATIBOUW /02/15 08/03/15 Bru selsexpo (Bru sel) ISH 10/03/15 14/03/15 M e se Frankfurt Frankfurt(Duitsland) VAKBLADSANILEC iseenuitgavevan ProfessionalMediaGroup Torhoutsesteenweg226/2-6,8210Zedelgem Tel.:050/ Fax:050/ PERIO DICITEIT Sanilecverschijnt9 xperjaar ABONNEMENTEN Tel.:050/ Fax:050/ Jaarabonnement:90 EUR(excl.btw)= 9 nummers Intekenenviasanilec.pmg.be ofmailnaarabo@pmgroup.be sanilec.pmg.be REDACTIE Directeur-uitgeverAndyNoyez Hoofdredacteurtech.magazinesBartDenys BladmanagerPhilip erer Viane KernredactieStefanAcke-BartDeM oor BartDesanghere-ZoéPhilippart-EliseRaucy NickVanderheyden-ValerieVerkain Eindredactie MikeDeCraene-NilsRauwoens MedewerkersJanDeN aeyer-bartthomas RedactieraadK.Beenaerts-K.Brems R.Debruyne-D.Degros-K.DeSouter R.O nkelinx-c.o tevaere-r.praets J.Vanaken-F.VanDeVivere REALISATIE Grafischevormgeving PascalClaeys-AxeleVereecke Publicitairmateriaal JohanTeerlinck-Eva Seurinck-AnnEverts HeidiCou sens-n ancypriem Drukkerij Geers-Oosta ker PUBLICITEITSREGIE PM RegienvLudwigHoutekeete P/A Torhoutsesteenweg226/6, 8210Zedelgem Tel.:050/ Fax:050/ Verantwoordelijkeuitgever FernandVanrie ZeewegZuid5,8211Aartrijke Versionfrançaisesursimpledemande. Ditvakblad isauteursrechtelijkbeschermd.w enstuartikelste scannen,digitaalopteslaan,tekopiëren,commercieelofdidactisch tegebruiken? Informeerueerstoverwa toegelatenisbij dhr.fernandvanrie,torhoutsesteenweg226/2, 8210Zedelgem,tel.:050/ M eerinformatieop scopyrights.be Sanilec164 November2014 3

311 BETEREPRESTATIESMETCOMBINATIE W ARMTEPOMP-ZONNEBOILER M EERW AARDE BO DEM REGENERATIE MINDER DUIDELIJK Driejaargeledenwerdhetproject'ZonW arm' opgestartdooreenonderzoeksteam vanku Leuven. Hetteam zochteen antwoord op de vraag:'w atisde meerwaardevaneenzonneboileropeeninstalatiedie reedseenwarmtepompbevat?'naafloopzijnde onderzoekersunaniem: Zonnecolectorenvormenwel degelijkeenenergiezuinigeaanvulingopwarmtepompen,zowelvoorsanitairwarm water,uiteraard,als voorruimteverwarming.regeneratievandebodem met zonnewarmte,daarentegen,heefteenminderduidelijk efect. DoorNickVanderheyden PROJECTZONWARM HetIW T-Tetra-project'ZonWarm ' werdinseptember2011 opgestart enliepafop31juli2014. Indieperiodewerden zongekoppeldewarmtepompinstalatiesdieinstaanvoorde productievansanitairwarm water (SW W )en/ofruimteverw arming (RVW ),onderdeloep genomen. Hetprojectwaseeninitiatiefvan hetonderzoeksteam van KU Leuven, FaculteitIndustriële Ingenieurswetenschappen,technologiecampusDe N ayer,vakgroep Thermotechniekenverschilende thermotechnischebedrijvenen organisaties,metfinanciële steun vaniw T(hetAgentschap voor InnovatiedoorWetenschap en Technologie). ZESVERSCHILLENDE IN STA LATIES Sindsdestartwerdenerdrie verschilendepadengevolgd. Tw ee insta latiesstonden opgesteld in hetthermotechnische labo van campusdenayerinsint-katelijne- W aver.daarnaastwerdenervier instalatiesoplocatiegeselecteerd ommetingeninrealistische omgevingenuittevoeren. Daarbovenop voerdehetteam ook thermodynamischesimulatiesuitin de simulatiesoftware Polysun van de verschilende insta laties. Doelinstalatieslabo Hetinitiële doelvan de laboopstelingen:nauwkeurigere metingenuitvoerenonder gecontroleerdeomstandigheden tenopzichtevandemetingen op locatie. M aaruiteindelijkblekende metingen in de labo'sgelijkaardig aandemetingenindegebouwen, verteltm aarten Sourbron, coördinatorvanhetproject ZonW arm. Ookwarendemogelijkheden om in hetlabo de warmte gecontroleerdaftegeven,beperkt. Aangeziendelabo-opstelingen slechtseenondersteunenderol toegediend kregen,vormdenze geenbeperking inhetonderzoek. Hetmeestebelang hechtenwe aan de resultaten in reële instalaties,hieruitlerenwe uiteindelijk ook hetm eest. Doelinsta latiesop locaties Opdeverschilendelocatieskreeg hetteam eenreëelbeeldvanhoe RafJan senswerktemeeaanhetprojectmetdewarmtepompinstalatievanzijnhuisinn oorderwijk.deomvang vandeinstalatie maaktmeteenduidelijkdatdeman,alseigenaarvaninstalatiebedrijf4technics,erggepasioneerdisdoorzijnvak VERW ARMING V.l.n.r.:JohnVeeken,DriesVanAken,LeenGoovaertsenMaartenSourbron,diehet project'zonw arm'onlangsbeëindigden,naastrafjansensuitnoorderwijk eenzongekoppeldewarmtepomp ineenwoning presteert.via partnerskwamen ze in contactmet eigenaarsvandergelijkeinstalaties. Uiteindelijkwerdenervier instalatiesgeselecteerd:betekom, Beverlo,LedeenNoorderwijk.Drie instalatiesdaarvanmakengebruik vaneengeothermischewarmtepomp,bijde vierde werd een luchtwatertypegeïntegreerd.andere verschilen liggen in de aard van de verwarming (SWW en/ofruimteverwarming),hettype zonnecolector(vlakplaatofvacuümbuis) en hetgescheiden ofgecombineerdevolumevanhetbufervat. Doelsim ulaties De simulaties,daarhielden onderzoekersjanverheyenenjohn Veekenzichinhoofdzaakmee bezig. Aandehandvandesimulatiesoftw are Polysun verifieerden ze in deeersteplaatsdebestaande instalaties,zowelin hetlabo als die op locatie.in tw eede instantie werdendesimulatiesgebruiktom uittezoekenwelkeparameters (verbruikhuis,aantalm² zonnecolectoren,vereiste temperaturen.)degrootsteinvloed hebbenopdeperformantievanhet systeem,enom deinstalatieste optimaliseren,zodatermaximaal gebruikkonwordengemaaktvan dezonneboiler.hetteam ging uit vandrietypeshuizenmeteen oppervlaktevan140 m²:eenlageenergiehuis(16 kw h/m²perjaar), een huisdatvoldoetaan EPB (50 kw h/m²perjaar),en een gerenoveerdoud huis(150 kw h/m ²perjaar).Elke insta latie werdgesimuleerdmet zonnecolectoren van 5,2 m²,2,6 m²(50%)en 10,4 m²(200%). 24 Sanilec164 November2014 sanilec.pmg.be

312 ! " # # #!! W ATW O RDTER GEM ETEN? Om opdevraagvandemeerwaardevanzonnecolectorenop instalatiesmeteenwarmtepompte kunnen antw oorden,m oesthetteam uiteraarddenodigemetingen uitvoeren.leengoovaertsendries Van Aken,die instonden voorhet opvolgenvandemetingenop locatie,leggen uit: Eigenlijkmetenweales: hetelektrische verbruik van de warmtepompplusalepompen dieermeegestuurd worden,de pompvandevloerverwarmingen depompvandezonnecolectors; therm isch:de warmte die van debodem naardewarmtepomp gaat;vandewarmtepompnaar hetbufervat;van hetbufervat naarde verwarming en het SW W ;vandezonnecolectoren naarhetbufervatennaarde bodem (oftewelderegeneratie). Voorelkeinstalatiehebbenwe duszoveelmogelijkmetingen, maarerbestaan ook standaardinstalatieswaar bijvoorbeeldeenboilervaten w arm tepom p in één toestelzijn gemonteerd.hetprobleem daaris datwegeenmetingenkunnendoen vanwatervandewarmtepomp naarhetvatgaat(zitsamen). Zonderdiemeetresultatenkunnen weuiteraard geenvergelijkingen maken,laatstaan conclusies trekken,besluitgoovaerts. Metingenregeneratie Deenergiewinstdiederegeneratie van de bodem doorzonnewarmte mogelijkmetzichmeebrengt, waseenvandebelangrijkste puntendiehetonderzoeksteam trachtenteachterhalen. W ijgingen de verhouding na tusendehoeveelheidenergie nodigom eenpomptelaten draaienvoorregeneratie,ende energiewinstdiederegeneratie opbrengtomdatdewarmtepomp eficiënterwerkt,zegtsourbron. Hetprobleem wasechterdatde periodeswaarinregeneratie optreedt,veeltekortzijnom nauwkeurigemetingentedoen. LeenGoovaertsbevestigt: Afgaand op demeetresultaten,gebeurtde regeneratieenorm snel.ineen halfuurtijd kunnen we alspreken van 10 kwh warmte die in de grondwordtgepompt.dereden ligthierbijhetbufervatdattot 90 C wordtopgewarmd.o p het dakhebbendezonnecolectoren daarnaeentemperatuurvan'maar' 100 C endaarbovenopworden zenogeenssnelafgekoeld door hetglycolw ateruitde bodem lu sen dataan C wordt aangevoerd.alsresultaatzalde regeneratiepompeigenlijkheelfel pendelen. Tekleinetemperatuurverschilen aandegrond Ervormdezichnogeenbijkomend probleem. Voordemetingenaandegrond werdenersomsonrealistische getalenweergegeven,legt G oovaertsuit. N a w at opzoekingenbleekdatonzemeter bijtemperatuurverschilen kleiner dan 3 kelvin geen nauwkeurige meetresultatenmeergarandeert.het probleem inonzesituatieisdatde temperatuurverschileninde bodemlusennooitgroterzijndan2 kelvin,datistrouwensoveralhet geval.uitdezemeetresultaten konden we bijgevolg geen accurate conclusiestrekken. ZONGEKOPPELDE IN STA LATIE N O O RDERW IJK M eestcom plete insta latie In ditstukgaan we dieperin op de resultatenvanhetonderzoekop basisvan de insta latie in Noorderwijk.Hetisdemeest uitgebreideinstalatievandevier. Zebevataledrieteonderzoeken elementen:zonnecolectorenvoor VERW ARMING O PTIM ALISEREN IN STA LATIE VERWARMING TijdenshetprojectvoerdeJohn Veekengeregeld simulatiesuit vandeinstalatiesvolgensde labo-opstelingen,w aarbijhij steedsuitging van de drie verschilendetypenhuizen.de mankreeg zoeengoed beeld vanfactorendiedeprestaties vaneenzongekoppelde warmtepompinstalatie beïnvloeden. HYDRAULISCHE AANSLUITINGEN EN POSITIES Bijhydraulischeaansluitingen entemperatuurvoelersliggende optimalisatiesvaakvoorhet rapen,begintveeken. Die zijn nietaltijd co rectofzijn foutgepositioneerd (inhet bufervat).eenfoute positioneringzorgtvooreen mengingvandeverschilende temperatuurniveaus,waardoor bv.dezonnecolectorenhogere temperaturenzieninhet bufervatendusminderenergie kunnenleveren. Alsgevolg moetdewarmtepomp aanhogereafgiftetemperaturen werken,meteenlagere performantietotgevolg.een sim ulatieanalyse van dergelijke, nietoptimale aansluitingen toontaan datditde SPF met1 kan doen dalen. BESTURINGSTECHNISCHE VERBETERINGEN BesturingstechnischwistVeeken, sam en metzijn co legaonderzoekers,deinstalaties verderteverbeteren. W e pastenonderanderehet stroomverbruikvan de pomp aan,werkteninopdepositie vandestooklijn,optimaliseerden de boven-en ondergrensvan de temperatuurinstelingen. Deuitbreidingvan6m²thermischezonnecolectorennaar17m²inNoorderwijk leverdeeendalingvanhetelektriciteitsverbruikmet35% eneendalingvanhetgasverbruikmet50% op RUIMTELATEN ONDERAAN COMBIBUFFERVATDOORSLAGGEVEND M aarde meestdoorslaggevendeaanpa sing indeze simulatiesbleekdekeuzeom onderaan in hetcombivatruimte te laten voorkoud sanitairw ater. Datgafonsruimte om zonnewarmteoptimaaloptevangen en zo te voorzien in een gedeelte van de voorverwarming voorhetwarmetapwater.op diemanierontstondereen mooiegelaagdheidinhet bufervatmetbovenaanhet sanitairwarm water(50-60 C), in hetmidden hetwatervoorde ruimteverw arming (25 C-45 C,geregeldviadestooklijnen afhankelijkvande buitentemperatuur)enonderaan debufervoorkoudsanitair w ater. sanilec.pmg.be Sanilec164 November

313 BIED HET NIEUWSTE OP HET GEBIED VAN ENERGIEBESPARING EN VEILIGHEID IN HUIS. De Nest Learning Thermostat en Nest Protect: Smoke + Carbon Monoxide werken fantastisch samen, en zijn dus ook goed samen aan te bieden. Hiermee kun je je onderscheiden van de concurrentie en niet alleen nieuwe klanten binnenhalen, maar ook bestaande klanten beter van dienst zijn. Meld je nu aan en word kosteloos een Nest Pro. Je krijgt producttraining, persoonlijke VIP-ondersteuning, verkoop-tools, klantverwijzingen en nog veel meer. Laten we samenwerken. nest.com/pro Verkrijgbaar bij Van Marcke.

314 VERW ARMING O verdim ensionering verm ijden Overdimensioneringvandebufer moetdusabsoluutvermeden wordenendeinstalateurmoet aandachtschenkenaaneen co recte isolatie van aansluitingen tusenbufervatenleidingen. Elkeextram²zonnecolector brengtsteedsminderop In principe brengtelke extra m² zonnecolectorsteedsminderop. M aardatisbijvoorbeeldookzo bijisolatie.n a 20 cm brengtdat eigenlijknietveelextrameerop. Hetdoelmoethierduszijn om de goedebalanstevindenopbasis vandewarmteverliezen.een corecteplaatsingvandeisolatieis minstenszo belangrijk. DankzijdeomvangvandeinstalatieinNoorderwijkkanhetonderzoeksteam alemetingenverichtendiehethadgepland. Enkeldemetingenbijdegrondleverdenfoutieveresultatenopdoorhettekleinetemperatuurverschil SW W enrvw,enregeneratie.ze isinhoofdzaakopgebouwduiteen geothermischewarmtepomp,17 m² aanvacuümzonnecolectoren,een gecombineerd bufervatende eerdervermelderegeneratie. Doorhetnieuweconceptvande instalatiewerdeencondenserende gasketelalsback-upgeplaatst, maardie blijktenkelin de w inter nodigomhetsww opeenhogere temperatuurtekrijgen,enals bijverwarming vooreen radiator vandebadkamer.als ondersteuningvoorde vloerverwarmingwordtdegasketel daarentegennietgebruikt.m its kleine aanpa singen kan een dergelijkeinstalatiegemakkelijk zonderdezeback-upwerken.de eigenaarvandeinstalatieblijkteen profesional. M et4technicshebikzelfeen instalatiebedrijfvoorverwarmingen koeling,verduidelijktrafjan sens. Nietverwonderlijkdusdatditde meestcompleteinstalatievande vieris. Uiteraard gaatdeze insta latie erg ver.ikzou hetmijn klanten bijgevolg nietmeteenaanraden. benuten.w einstaleerden vervolgenstwee velden van 6 m² en één veld van 5 m². Hoekan deoverto lige w arm tew orden afgevoerd? Deoplo sing:regeneratievande bodem doorzonnewarmte. Bijdezetechniekwordtde overtolige warmte van de zonnecolectorenterugnaarde grond gestuurd,w eetm aarten Sourbron. Degrondwarmtop, waardoordewarmtepomp eficiënterwerktendusminder energieverbruiktom hetwatertot opeenbepaaldetemperatuurte brengen. Alw ashetbijdeze insta latie eerderalsnoodzaakdan als energie-eficiëntetoevoeging, piktjan sensin. Energieplaatjeklopt Eengoedebeslising,dieverhoging vanhetaantalm²zonnecolectoren,bevestigtde vakman nog. Hetenergieplaatje klopt. Sindsdie aanpa singen isons elektrischeverbruikmet35% enhet gasverbruikmet50% afgenomen. bereikt.vraagthetsww geen warmte meer(wathetgevalis,als hetvateentemperatuurheeftvan 90 C),dan gaaternog zonne- w armte naarde ruimteverwarming (ofteweldevloerverwarming). Datvaltbijvoorbeeldoptemaken uitdevergelijkingvandeinstalaties in N oorderwijkmetdiegene in Beverlo. Bijdelaatstgenoemdewordt zonnew armte nietgebruiktals ondersteuningvoorde ruimteverwarming enhebbenze eengemiddeldespfvan4,5 (seizoenprestatiefactordiede verhouding weergeefttusende geleverdewarmteende hoeveelheid elektriciteitdienodig is om deinstalatietelatendraaien overeenlangetermijn). In N oorderwijk,waarzonnewarmte w elgebruiktw ordtvoorruimteverwarming,isdegemiddeldespf 5,43,metpieken tot8.de laatstgenoemdecijferszijn daarbovenop onmogelijkmeteen w arm tepomp a leen te halen. Veelwarmteverliezen doorvaten leidingen CONCLUSIES W atweweloveralzien,isdat Van 6 naar17 m ² een bufervatzo toch w elw at zonnecolectoren Bijde startvan de bouw,in 2008, besloten we om 6 m²aan vacuümbuizenophetdakte leggen,puuralsverwarmings- ondersteuning.hetbleekalsnel eenniet-rendabeleopsteling. Hetdebietdatdezonnecolectoren konleverenaanhetbufervat,was ruim onvoldoendeom,naastde productievansww,ooknog RVW teondersteunen.w ezijn daarom opzoekgegaannaar oplo singen. Tweevragenkwamennaarboven: Hoeveelm ²aan zonneco lectoren m oetop hetdak? De keuze vieluiteindelijk op 17 m². Voornamelijkomdatwe het geheledakoppervlakwilden N u hetonderzoekonlangswerd afgesloten,weethetteam enkele afgelijndeconclusiestetrekken. Hetgebruikvanthermischezonne- energieinwarmtepompinstalaties voorzowelde productie van het sanitairwarm wateralsvoorde ondersteuning vanruimte- verwarming heeftweldegelijkeen positieveimpactopdeprestatie vandetotalewarmtepompinstalatie,zobesluitsourbron. Regeneratie van de bodem met zonnewarmteheefteenminder duidelijke fect. Meerwaardezonnecolectoren bijsww énruimteverwarming W atwewildenbereiken,hebben wevolgensonzemeetresultaten warmte verliest,merktsourbron nog op. O ndermeeralsgevolg vanniet-geïsoleerdeleidingen. Vooralbijkleine of pa siefw oningen,w aarerw einig verwarmdmoetworden,heeftdat eenaanzienlijknefastefect. De verliezen van zo'n bufervatzijn daarbijwijzevansprekenbijna evengrootalswatjeefectiefaan warmte aan hetverbruiken bent. M etingenop reëleinstalatiesvan het'zonw arm'-projecthebben energieverliezenvan7% totmeer dan40% opgeleverd. Ditlaatstetreedtop wanneerde insta latie op deelastw erkten de therm ische buferop tem peratuur gehoudenwordtvoorslechtseen kleineenergievraag. Gecombineerdbufervatbeter rendementdangescheiden? Gescheidenbufervatenzoudenin principegemakkelijkereenbeter warmtepomprendementmoeten geven,omdathetsw W opeen hogeretemperatuurapartvanhet watervoorrvw opeenlagere temperatuurkanworden geproduceerd. Bijeengecombineerd bufervat moetendeconstructieende aansluitingenzozijndatergeen menging vantemperatuurniveaus optreedt. Dewarmtevandezonnecolectoren w ordtdan automatisch op de juiste temperatuuropgeslagenendus optimaalbenut. Demetingentonenaandatreële instalatiesspf-waarden van 5 en zelfsmeerdan 6 halen bij dergelijkecombisystemen,waarbij dezonnecolectoren30% tot40% vandeenergievoorsww en RVW leveren,aldussourbron. OVER IW T-TETRA- PROJECTZONWARM HetZonW arm-project (htp://zon-warm.le sius.eu)loopt insamenwerkingmetdevolgende bedrijvenenpartners:acv Belgium,Baxi,Buderus,Daikin, Eco Heating,Ecompany,Elco, Energieconcepten,IZEN Energy Systems,Lam brechts,therm oduct, M inienergietechniek,nathan, Nibe,Ra-colectoren,Sanutal, StiebelEltron,Thercon,Van RompaeyenVie smann;de Sectora sociatievoorthermische Zonne-energieenZonneboilers (Belsolar),EuropeanHeatPump A sociation (EHPA), Overlegplatform voor Energiedeskundigen(OVED), VlaamsElektroInnovatiecentrum (Tecnolec),Vlaam s Energieagentschap (VEA), VlaamseConfederatieBouw (VCB),Vlaamse Insteling voor Technologisch O nderzoek (VITO ), W armtepomp Platform (W PP)en hetw etenschappelijken TechnischCentrum voorhet Bouwbedrijf(W TCB). sanilec.pmg.be Sanilec164 November


.")


![" [ Foto: Viessmann Belgium bvba ] Welke warmtepomp je ook kiest, de energie-efficiëntie ligt altijd een stuk hoger dan bij een klassieke gasketel.](/docs-images/92/108577123/images/315-5.jpg "Sanitair, regen- en afvalwater Centrale verwarming Verwarmingstechnieken Warmtepompen Zonnepanelen Zonneboiler Ventilatie Airco Veiligheid en alarm Centraal stofzuigsysteem AFWERKING RONDOM HET HUIS")
315 Hoeveel energie bespaar je met een warmtepomp? - Warmtepompen Bouwen aan morgen NIEUWS GRATIS DIENSTEN Gratis nieuwsbrief Bestel gratis folders Vraag en antwoord Gids Verstandig Bouwen Gratis typedocumenten Verhuisplanner op maat Checklist Premielinker E-peilcalculator EERSTE STAPPEN SLEUTEL-OP-DE-DEUR BOUWRECHT GELD DUURZAAM BOUWEN RUWBOUW TECHNIEKEN Energiebronnen Elektriciteit Domotica en communicatie Hoeveel energie bespaar je met een warmtepomp? 07/05/2013 Heb je interesse in een warmtepomp, maar weet je niet welk systeem voor jou het meest geschikt is? Specialisten Benjamin Verfaillie en Maarten Sourbron van Thomas More Hogeschool helpen je op weg. Meten is weten Benjamin Verfaillie en Maarten Sourbron werken aan de Onderzoeksgroep Thermische en Elektrische Energiesystemen (Theles). Dankzij uitvoerige metingen hebben ze een grondig zicht op de energieefficiëntie van warmtepompen ten opzichte van klassieke gas- of stookolieketels. Bovendien kunnen ze de verschillende warmtepompsystemen met elkaar vergelijken. COP en SPF "Wat fabrikanten meegeven, is de COP of Coefficient of Performance", vertelt Benjamin Verfaillie. "Maar deze zegt alleen iets over de prestaties van de unit in specifieke labcondities met één bepaalde bron- en afgiftetemperatuur. Een momentopname zeg maar. Wil je een grondig beeld van de volledige installatie in reële omstandigheden, dan geeft de SPF of Seasonal Performance Factor een betere indicatie." [ Foto: Viessmann Belgium bvba ] Welke warmtepomp je ook kiest, de energie-efficiëntie ligt altijd een stuk hoger dan bij een klassieke gasketel. Sanitair, regen- en afvalwater Centrale verwarming Verwarmingstechnieken Warmtepompen Zonnepanelen Zonneboiler Ventilatie Airco Veiligheid en alarm Centraal stofzuigsysteem AFWERKING RONDOM HET HUIS INTERACTIE & INSPIRATIE ZOEK EN VIND DOSSIERS WERKEN IN DE BOUW PROFESSIONELEN Kopen en huren Bouwforum Globaal inzicht Voor je de wenkbrauwen fronst: de SPF is de verhouding van de warmte die een warmtepomp op jaarbasis afgeeft en de elektriciteit die daarvoor nodig is (voor de pompen, regelingen, ). Zo kom je tot een globaal inzicht in de energie-efficiëntie van een systeem. "Je kan de SPF inschatten, maar nooit exact op voorhand berekenen. Alles hangt af van de reële omstandigheden", benadrukt Maarten Sourbron. Drie systemen vergeleken Binnen het collectief onderzoeksproject WP Direct werden verschillende systemen uitvoerig gemeten om zo voor elk tot een gemiddelde SPF te komen. Vooral interessant voor (ver)bouwers: de geothermische modellen met horizontale en verticale captatie en de lucht-waterwarmtepompen. "Lucht-luchtsystemen hebben we buiten beschouwing gelaten, omdat bij ons CV-installaties typisch met een watercircuit in de woning werken." Primaire Energie Ratio Door de becijferde SPF van de verschillende types telkens met een factor 2.5 te vermenigvuldigen, kwamen de onderzoekers tot de PER of Primaire Energie Ratio. Dit is de hoeveelheid energie die een elektriciteitscentrale nodig heeft om de elektriciteit te maken waarmee de warmtepomp je woning verwarmt. "Op basis daarvan hebben we uiteindelijk de verschillende types vergeleken met klassieke cv-ketels", vertelt Sourbron. [ Foto: Viessmann Belgium bvba ] Een lucht-waterwarmtepomp biedt zelfs bij vrieskou een aanvaardbaar rendement. Op de foto zien we de buitenunit. [ Foto: Geotherma ] Van de verschillende systemen heeft de luchtwaterwarmtepomp de laagste energie-efficiëntie, maar ook de laagste kostprijs. Tot 90 % efficiënter Een geruststellend resultaat: welke type je ook installeert, de energie-efficiëntie ligt altijd hoger dan bij een klassieke gasketel. Zo is een luchtwaterwarmtepomp 20 tot 40 % efficiënter en een bodem-watersysteem zelfs 60 tot 90 %. "We hebben geen aparte opdeling gemaakt in verticale en horizontale captatie. Maar uit de SPF-cijfers leiden we wel af dat de verticale systemen het efficiëntst zijn, met een SPF van 4,7 tegenover 4 bij een horizontaal captatienet, voor de installaties die wij gemeten hebben." En de meeste energie-efficiënte is Qua energie-efficiëntie krijgen we dus het volgende plaatje. Op de eerste plaats komt de grondwaterwarmtepomp met verticale captatie (met putboringen), gevolgd door de grond-water met horizontale captatie. De lucht-water sluit het rijtje af. [ Foto: Geotherma ] Een grond-waterwarmtepomp met horizontale captatie behaalt met 4 een mooie gemiddelde SPF. Het nadeel van dit systeem is dat je erg veel vrije oppervlakte nodig hebt (meer dan het dubbel van de te verwarmen oppervlakte). Lucht-water afgeserveerd? Moeten we de lucht-waterwarmtepomp dan afserveren? "Zeker niet", zegt Sourbron. "Deze systemen vergen een lagere investeringskost en 1 van 3 7/05/ :04


316 Hoeveel energie bespaar je met een warmtepomp? - Warmtepompen van 3 7/05/ :04 bovendien is de bron, buitenlucht, onuitputbaar. Dat maakt het een goede keuze voor mensen die niet het budget of de ruimte hebben voor een geothermisch systeem." Lucht-water ook performant bij vrieskou En wat bij buitentemperaturen ver onder het vriespunt, horen we je denken? "Uit onze metingen blijkt dat ook dan de performantie van luchtwaterwarmtepompen overeind blijft. Kanttekening: bij een buitentemperatuur rond 0 C verliest de installatie aan efficiëntie, omdat je dan veel energie nodig hebt om de warmtewisselaar ijsvrij te houden. Bij -10 C speelt dit probleem veel minder, omdat de lucht dan veel minder vocht bevat." [ Foto: Geotherma ] Een grond-waterwarmtepomp met verticale captatie heeft de hoogste SPF. Maar dit is ook het duurste systeem en om praktische redenen niet overal toepasbaar. Horizontale captatie: maak plaats! Ben je van plan om wat meer uit te geven, dan blijft de keuze: horizontale of verticale captatie. "Horizontale captatie is goedkoper, omdat je geen putboringen moet laten uitvoeren. Aan de andere kant heb je wel een grote oppervlakte nodig. Reken op 450 m² voor een woning van 200 m². Ter vergelijking: bij verticale captatie zouden twee boringen, op zo n tien meter van elkaar, volstaan. Denk er wel aan dat je tuin voor het uitvoeren van de putboringen voldoende draagkrachtig en vlot toegankelijk moet zijn. Bij rijwoningen is dit alvast geen optie." [ Foto: Vaillant ] Voorwaarde voor de goede werking van een warmtepomp: een goed geïsoleerde en luchtdichte woning. Constantere bodemtemperatuur Verticale captatie is dus niet voor iedereen haalbaar. Het systeem is nochtans met voorsprong het energieefficiëntst. "De bodemtemperatuur blijft veel constanter omdat de grond minder snel uitgeput geraakt", weet Sourbron. "Maar daar staat tegenover dat de bodem minder vlug weer warmte opneemt, wat wij regeneratie noemen. Bij horizontale captatie wordt de bodem rondom het leidingennet sneller weer opgewarmd door de zon en door inspijpelend regenwater." Verfaillie: "We weten voorlopig nog weinig over de mogelijkheden van regeneratie. Het is daarom nog te vroeg om te zeggen welk systeem hiervoor het meest geschikt is." [ Foto: Duratherm ] Voor de putboringen bij een warmtepomp met verticale captatie heb je een voldoende draagkrachtige en vlot toegankelijke tuin nodig. Voor rijwoningen is dit meestal geen optie. Zandbodem geleidt het best Nog iets wat de prijs van je verticale captatie behoorlijk kan opdrijven: de samenstelling van de bodem. "Waterverzadigde zandgrond geleidt het best, ongeveer 50 watt per meter", vertelt Sourbron. "Klei of leem heeft een veel beperktere warmteafgifte, van slechts 30 watt per meter. Daarom moet je in kleigrond voor hetzelfde rendement bijna dubbel zo diep boren of extra putboringen laten uitvoeren." Conclusies Welk type je ook kiest, de energie-efficiëntie ligt altijd een pak hoger dan bij een klassieke gasketel. Voor de drie hierboven besproken systemen varieert dit van 20 tot zelfs 90 %. [ Foto: STIEBEL ELTRON ] De samenstelling van de bodem heeft een invloed op het prijskaartje van de verticale boring. Een grond-waterwarmtepomp met verticale captatie heeft de hoogste SPF. Maar dit is ook het duurste systeem en om praktische redenen niet overal toepasbaar. Een grond-waterwarmtepomp met horizontale captatie behaalt met 4 een mooie gemiddelde SPF. Het nadeel van dit systeem is dat je erg veel vrije oppervlakte nodig hebt (meer dan het dubbel van de te verwarmen oppervlakte). Als je op langere termijn rekening houdt met de investeringskost én met het verbruik, ben je met geen enkel systeem duurder af dan met een klassieke gas- of stookolieketel. Wel opgelet: dit geldt enkel voor nieuwbouw of voor energiezuinige renovaties, waarbij je gebruikmaakt van verwarming op lage temperatuur. Tom Mondelaers Vind je deze informatie nuttig? Deel deze dan nu. Lees meer over Warmtepompen Wat, waarom en hoeveel? Soorten warmtepompen Richtprijzen warmtepompen Recente artikels Stookkosten van 300 naar 60 euro per maand - 07/05/2013 Professioneel advies op maat! - 07/05/2013 Hernieuwbare energie - Batibouw /01/2013 Op zoek naar iets anders? Vind Wekelijkse nieuwsbrief Abonneer je op onze wekelijkse nieuwsbrief.


317 Hoeveel energie bespaar je met een warmtepomp? - Warmtepompen van 3 7/05/ :04 " euro warmtepomppremie? Voorbarig" - 19/11/2012 "Brussel mag passiefstandaard niet opdringen" - 22/10/2012 Vooruitziend bouwen: hoe plan je een luchtwaterwarmtepomp in? - 15/10/2012 De warmtepomp in vijf weetjes - 25/09/2012 Warmtepompdilemma: lucht-lucht of lucht-water? - 24/09/2012 Productinfo warmtepompen Hoofdpartners technieken Bouwen aan morgen in partnership met en Copyright 2013 Privacy policy Gebruiksvoorwaarden De redactie van Livios nv streeft steeds naar juistheid, objectiviteit en betrouwbaarheid van de door haar gepubliceerde informatie waarvoor zij echter niet aansprakelijk gesteld kan worden voor welk gebruik dan ook. Livios nv is niet verantwoordelijk voor welke beslissing of handeling dan ook die door de gebruiker zou zijn genomen op basis van de verstrekte informatie of gegevens; noch is ze verantwoordelijk voor fouten of vergissingen; en ze is evenmin verantwoordelijk t.a.v. gebruiker of derden voor mogelijk geleden directe, indirecte, incidentele schade, winstderving, verlies van opportuniteit of voor eender welke schade veroorzaakt door haar nalatigheid of vergetelheid in het verschaffen, compileren, monteren, schrijven, interpreteren, melden en verspreiden van info of data d.m.v. deze dienst, en dit zelfs indien Livios nv gewaarschuwd werd voor zulke schade.<br/>voor de volledige gebruiksvoorwaarden: zie livios.be
 in Solar Thermal and Heat Pump (SHP) systems Subject Household size T set, DHWtank Energy Performance Penalty factor electricitydhw BU heater Approach System simulations DHW")

 Non-profit or sectorial (5) Governamental organisations (1) SME")
318 25/11/2014 CONTENT IWT-TETRA: ZON-WARM Solar Thermal and Heat Pump Systems & Domestic Hot Water production Jan Verheyen Introduction Context & Project Zon-Warm Role of Domestic Hot Water (DHW) in Solar Thermal and Heat Pump (SHP) systems Subject Household size T set, DHWtank Energy Performance Penalty factor electricitydhw BU heater Approach System simulations DHW profiles System configurations & sizing Results Conclusions 1 Warmtepomp Symposium 11/09/ Warmtepomp Symposium 11/09/2013 CONTEXT IWT-TETRA PROJECT ZON-WARM Duurzaam-bouwen-affiche1.jpg 13% 40% energy use 36% CO 2 emission = building related Subject: Coupled Solar Thermal & Heat Pump Systems residential heating & domestic hot water for Objectives: Market penetration: relief of barriers augmenting quality by optimization TETRA technology transfer Team Scientific partners (3) Non-profit or sectorial (5) Governamental organisations (1) SME s (19) Project coördination: THELES, Thomas More Funding: IWT Participation in IEA-SHC task 44 / annex 38 3 Warmtepomp Symposium 11/09/ Warmtepomp Symposium 11/09/2013 1
![time Energy demand [kwh/a] 25/11/2014 IWT-TETRA PROJECT ZON-WARM IWT-TETRA PROJECT: ZON-WARM WP1: technological needs of SME s WP2: literature study workplan WP3: analysis and evaluation of existing](/docs-images/92/108577123/images/319-0.jpg "system configurations WP4: modelling of selected system configurations Web: http://zon-warm.lessius.")
319 time Energy demand [kwh/a] 25/11/2014 IWT-TETRA PROJECT ZON-WARM IWT-TETRA PROJECT: ZON-WARM WP1: technological needs of SME s WP2: literature study workplan WP3: analysis and evaluation of existing system configurations WP4: modelling of selected system configurations Web: WP5: measurement of system performance WP7: dissemination of results WP6: code of good practice & selection and dimensioning tool 5 Warmtepomp Symposium 11/09/ Warmtepomp Symposium 11/09/2013 SUBJECT: CONTEXT SOLAR THERMAL AND HEAT PUMP SYSTEMS & DOMESTIC HOT WATER PRODUCTION SUBJECT Role of DHW in energy demand and system design: Space Heating Space Heating Space Heating 15 kwh/m²a 45 kwh/m²a 100 kwh/m²a Space Heating [kwh/a] A useable=140m² DHW [kwh/a] T44 [Haller et al.; 2013]» SFH015: further savings in SH demand increasing effort» SFH015: optimization focus on DHW Influence of household size T set DHW tank on system performance Influence of penalty factor (DHW backup heater el. cons.) frequency [%] Distribution of households by household size number of persons per household Mean number= Warmtepomp Symposium 11/09/ Warmtepomp Symposium 11/09/2013 2
320 Power [kw] Power [kw] Power [kw] Power [kw] 25/11/2014 APPROACH: SYSTEM SIMULATIONS Software: Polysun v6.1 [Vela Solaris; 2013] Boundary conditions: fixed Climate: Sint Katelijne Waver (lat , long , el. 4m) Building: heating load: SFH015 (~Passive house, Strassbourg) [Dott et al.; 2012] specific heating demand = 21.1 kwh/(m².a) [B] Useable floor area: 140m² Floor heating T supply /T return = 35 C/30 C Design heat load = 1673W [B] DHW PROFILES T44 DHW reference profile T44/A38 domestic hot water weekday profile Time [s] T44/A38 domestic hot water sunday profile Time [s] Legend: S=Small; Sh=Shower; FC=Floor cleaning; DW= Dish washing; HC=Household cleaning; Ba=Bath tub [Haller et al.; 2013] Weekdays: Sunday: bath tub replaces shower: 9 Warmtepomp Symposium 11/09/ Warmtepomp Symposium 11/09/2013 DHW PROFILES T44 DHW reference profile T44/A38 domestic hot water weekday profile Time [s] T44/A38 domestic hot water sunday profile Time [s] Warmtepomp Symposium 11/09/2013 Legend: S=Small; Sh=Shower; FC=Floor cleaning; DW= Dish washing; HC=Household cleaning; Ba=Bath tub [Haller et al.; 2013] Weekdays: 82.9% 45 C 17.1% 55 C =5.845 kwh/day ~140 l/day at 45 C (T cw =10 C) Sunday: bath tub replaces shower: DHW PROFILES DHW profile name 12 daily amount [l/d] amplitude V [m³/a] Eavg,day [kwh/d]** summer/winter rate of E_T44*** (excl. BU heater) TDHW,draw-off [ C]* SHP_DHW_40_ %/+20% 100% SHP_DHW_45_ %/+20% 100% SHP_DHW_50_ %/+20% 100% SHP_DHW_55_ %/+20% 100% SHP_DHW_60_ %/+20% 100% SHP_DHW_45_ %/+20% 43% SHP_DHW_55_ %/+20% 43% SHP_DHW_45_ %/+20% 87% SHP_DHW_55_ %/+20% 87% SHP_DHW_45_ %/+20% 130% SHP_DHW_55_ %/+20% 130% SHP_DHW_45_ %/+20% 174% SHP_DHW_55_ %/+20% 174% SHP_DHW_45_ %/+20% 217% SHP_DHW_55_ %/+20% 217% Legend: Energy associated with BU heater is considered outside Polysun *T DHW,draw-off Fixed temperature of domestic hot water supply provided by the solar heat pump system [ C]. For legionella prevention, daily amount E avg, day the hot water tank additionaly is heated to 60 C once a week; thermal benefits for draw-offs and energy use are not included. Average daily volume of domestic hot water draw-off if it were supplied at the fixed temperature TDHW, draw-off, and a cold water supply temperature of 10 C [l/d]. Average daily energy of domestic hot water draw-off if it were supplied at the fixed temperature TDHW, draw-off, and a Warmtepomp Symposium 11/09/2013 cold water supply temperature of 10 C [kwh/d]. ** Part of this energy is delivered via electrical backup heater to reach the minimum temperature as set by T44/A38 [Haller et al.; 2013] for some tappings. amplitude summer/winter Amplitude of the sine-curve for the variation of the DHW energy demand [%]. 3
321 Total energy (incl. penalty) [kwh/week] Total energy (excl. penalty) [kwh/week] 25/11/2014 DHW PROFILES daily amount amplitude V [m³/a] DHW profile name TDHW,draw-off [ C]* [l/d] Eavg,day [kwh/d]** summer/winter rate of E_T44*** (excl. BU heater) SHP_DHW_40_ %/+20% 100% Influence of SHP_DHW_45_ %/+20% 100% temperature SHP_DHW_50_ %/+20% 100% SHP_DHW_55_ %/+20% 100% SHP_DHW_60_ Variation -20%/+20% 100% SHP_DHW_45_ over -20%/+20% the year 43% Influence SHP_DHW_55_ Sine-curve -20%/+20% 43% of SHP_DHW_45_ amplitude: -20%/+20% 87% household size SHP_DHW_55_ % -20%/+20% 87% SHP_DHW_45_ %/+20% 130% SHP_DHW_55_ %/+20% 130% SHP_DHW_45_ %/+20% 174% SHP_DHW_55_ %/+20% 174% SHP_DHW_45_ %/+20% 217% SHP_DHW_55_ %/+20% 217% Legend: Energy associated with BU heater is considered outside Polysun *T DHW,draw-off Fixed temperature of domestic hot water supply provided by the solar heat pump system [ C]. For legionella prevention, daily amount E avg, day 13 the hot water tank additionaly is heated to 60 C once a week; thermal benefits for draw-offs and energy use are not included. Average daily volume of domestic hot water draw-off if it were supplied at the fixed temperature TDHW, draw-off, and a cold water supply temperature of 10 C [l/d]. Average daily energy of domestic hot water draw-off if it were supplied at the fixed temperature TDHW, draw-off, and a Warmtepomp Symposium 11/09/2013 cold water supply temperature of 10 C [kwh/d]. ** Part of this energy is delivered via electrical backup heater to reach the minimum temperature as set by T44/A38 [Haller et al.; 2013] for some tappings. amplitude summer/winter Amplitude of the sine-curve for the variation of the DHW energy demand [%]. DHW PROFILES Penalty=1.5 Penalty=1 (no penalty) 14 Warmtepomp Symposium 11/09/ DHW draw-off profiles Week DHW draw-off profiles Week SHP_DHW_40_100_var20 SHP_DHW_45_100_var20 SHP_DHW_50_100_var20 SHP_DHW_55_100_var20 SHP_DHW_60_100_var20 SHP_DHW_45_43_var20 SHP_DHW_55_43_var20 SHP_DHW_45_87_var20 SHP_DHW_55_87_var20 SHP_DHW_45_130_var20 SHP_DHW_55_130_var20 SHP_DHW_45_174_var20 SHP_DHW_55_174_var20 SHP_DHW_45_217_var20 SHP_DHW_55_217_var20 SHP_DHW_40_100_var20 SHP_DHW_45_100_var20 SHP_DHW_50_100_var20 SHP_DHW_55_100_var20 SHP_DHW_60_100_var20 SHP_DHW_45_43_var20 SHP_DHW_55_43_var20 SHP_DHW_45_87_var20 SHP_DHW_55_87_var20 SHP_DHW_45_130_var20 SHP_DHW_55_130_var20 SHP_DHW_45_174_var20 SHP_DHW_55_174_var20 SHP_DHW_45_217_var20 SHP_DHW_55_217_var20 SYSTEM CONFIGURATIONS SYSTEM CONFIGURATIONS System 1 System 2 Stratified tank 512l 10cm PUR HP: B/W HP: R407C 5.6kW COP 4.3 GSHX: single 32mm U 86m depth SC flat plate: A aperture : 8.6m² On/off pumps DHW tank: 224l 10cm PUR SH tank: 288l 10cm PUR HP: A/W HP: R410A 5.5kW COP 3.4 Internal pump on return line of SH SC: Vacuüm tube (heat pipes) A aperture : 3.2m² On/off pumps 15 Warmtepomp Symposium 11/09/ Warmtepomp Symposium 11/09/2013 4
![SPF [-] SPF [-] SPF [-] SPF [-] 25/11/2014 SYSTEM SIZING *[McCorry et al.; 2011] [CEN; 2007] RESULTS 1 2 Heat Pump: Assumption: no heat delivered by SC DHW: (3.8kW) Max.](/docs-images/92/108577123/images/322-0.jpg "DHW energy for 1 day (winter, sunday, T cw=t a,24h avg. year ) 24h tank losses 3 running hours of HP (availability time of HP for DHW=3:00-6:00) SH: Design heat load of building (1.7kW) P HP =5.")
322 SPF [-] SPF [-] SPF [-] SPF [-] 25/11/2014 SYSTEM SIZING *[McCorry et al.; 2011] [CEN; 2007] RESULTS 1 2 Heat Pump: Assumption: no heat delivered by SC DHW: (3.8kW) Max. DHW energy for 1 day (winter, sunday, T cw=t a,24h avg. year ) 24h tank losses 3 running hours of HP (availability time of HP for DHW=3:00-6:00) SH: Design heat load of building (1.7kW) P HP =5.5kW (Availability time of HP for SH=allways) GSHX: BHE: depth BHE =P HP. (COP-1)/COP/(50W/m*) Tank DHW: Max DHW volume for 1 day (winter, sunday) Tank SH: (288l) Energy of design heat load during 1 hour (1h buffering of design heat load) depth BHE =86m V tank sys2, DHW =224l V tank sys2, SH =288l V tank sys1 =512l SC: area so that for 1 or 2 months: SF=100% A aperture, Sys1 =8.6m² A aperture, Sys2 =3.2m² 17 Warmtepomp Symposium 11/09/ Warmtepomp Symposium 11/09/2013 RESULTS Comparison of T set,dhwtank (T44 DHW profile) RESULTS Comparison of household size (T set,dhwtank =45 C) System 1; Rate of E_T44=100% System 2; Rate of E_T44=100% System 1; Tset min, DHWtank=45 C System 2; Tset min, DHWtank=45 C SPFexcl. BU SPFincl. BU, excl. Pen SPFincl. BU, incl. Pen SPFexcl. BU SPFincl. BU, excl. Pen SPFincl. BU, incl. Pen SPFexcl. BU SPFincl. BU, excl. Pen SPFincl. BU, incl. Pen SPFexcl. BU SPFincl. BU, excl. Pen SPFincl. BU, incl. Pen Tset min, DHW tank [ C] Tset min, DHW tank [ C] Rate of Energy of DHW profile of T44 [%] Rate of Energy of DHW profile of T44 [%] Warmtepomp Symposium 11/09/ Warmtepomp Symposium 11/09/2013 5
323 SPF [-] SPF [-] 25/11/2014 RESULTS CONCLUSIONS Comparison of household size (T set,dhwtank =55 C) System 1; Tset min, DHWtank=55 C 2.7 System 2; Tset min, DHWtank=55 C SPFexcl. BU 3.95 SPFincl. BU, excl. Pen SPFincl. BU, incl. Pen Rate of Energy of DHW profile of T44 [%] Rate of Energy of DHW profile of T44 [%] SPFexcl. BU SPFincl. BU, excl. Pen SPFincl. BU, incl. Pen Regardless of performance indicator used: Performance System 1 >> Performance System 2 (note DA SC,aperture!!) Dhousehold size DSystem Performance (less pronounced for system 2) Properly sized SHP systems lower SPF can be expected for other DHW profiles than the one it was designed for (e.g. change in household size) Best T set,dhwtank =45 C (Both systems with T44 DHW profile) Penalty factor (1.5) for electricity consumption of DHW BU heater may be decisive in disfavor of SHP systems with BU heater when comparing performance to other systems. 21 Warmtepomp Symposium 11/09/ Warmtepomp Symposium 11/09/2013 COMBINED SOLAR THERMAL AND HEAT PUMPS SYSTEMS & DHW PRODUCTION REFERENCES IWT-TETRA project ZonWarm: Zongekoppelde warmtepompsystemen ; IEA-SHC task 44 / annex 38; CEN; 2007; EN 15450: Heating systems in buildings Design of heat pump heating systems; European Committee for Standardization (CEN), Brussels; 2007; Thank you for your attention! Web: Contact: jan.verheyen@thomasmore.be Dott R., Haller M.Y., Ruschenburg J., Ochs F., Bony J.; 2012; The Reference Framework for System Simulations of the IEA SHC Task 44 / HPP Annex 38 - Part B: Buildings and Space Heat Load - A technical Report of Subtask C - Report C1; Institut Energie am Bau - Fachhochschule Nordwestschweiz, IEBau - FHNW, Muttenz, Switzerland; 25/10/2012; European Commission; 2012a; Regulations Commission delegated regulation (EU) No 244/2012 of 16 January 2012 supplementing Directive 2010/31/EU of the European Parliament and of the Council on the energy performance of buildings by establishing a comparative methodology framework for calculating cost-optimal levels of minimum energy performance requirements for buildings and building elements; Official Journal of the European Union; L 81/18-36; January 2012; pp.18-36; European Commission; 2012b; Notices from European Union institutions, bodies, offices and agencies European Commission Guidelines accompanying Commission Delegated Regulation (EU) No 244/2012 of 16 January 2012 supplementing Directive 2010/31/EU of the European Parliament and of the Council on the energy performance of buildings by establishing a comparative methodology framework for calculating cost-optimal levels of minimum energy performance requirements for buildings and building elements; Official Journal of the European Union; C 115/1-28; January 2012; pp.1-28; European Parliament and the Council of the European Union; 2010; Directive 2010/31/EU of the European Parliament and of the Council of 19 May 2010 on the energy performance of buildings (recast); Official Journal of the European Union; L 153/13-35; june 2010; pp ; European Parliament and the Council of the European Union; 2009; Directive 2009/28/EC of the European Parliament and of the Council of 23 April 2009 on the promotion of the use of energy from renewable energy sources and amending and subsequently repealing Directives 2001/77/EC and 2003/30/EC; Official Journal of the European Union; L 140/16-62; April 2009; pp ; Haller M., Dott R., Ruschenburg J., Ochs F., Bony J.; 2013; The Reference Framework for System Simulations of the IEA SHC Task 44 / HPP Annex 38 - Part A: General Boundary Conditions - A technical Report of Subtask C - Report C1; Institut für Solartechnik SPF, Hochschule für Technik HSR, Rapperswil, Switzerland; 07/03/2013; Lerch W., Heinz A.; 2012; Simulation of different HP/solar systems incl. waste water heat recovery (WHR) for low energy buildings; meeting 5 Povoa, Portugal; 05/03/2012. McCorry M., Jones G.Ll. (eds); 2011; Geotrainet Training Manual for Designers of Shallow Geothermal Systems; Geotrainet, European Federation of Geologists; Brussels; 2011; Olesen B. W.; 2010; European actions to improve the energy efficiency of buildings; IEE-CENSE; available online; [consulted 20/01/2013] 23 Warmtepomp Symposium 11/09/2013 Warmtepomp Symposium 11/09/
![PERFORMANCE EVALUATION PERFORMANCE EVALUATION 25/11/2014 DHW PROFILES TECHNOLOGY DHW profile name daily amount [l/d] amplitude V [m³/a] Eavg,day [kwh/d]** summer/winter rate of E_T44*** (excl.](/docs-images/92/108577123/images/324-1.jpg "BU heater) TDHW,draw-off [ C]* SHP_DHW_40_100 40 153.33 5.845-20%/+20% 100% 50.409 SHP_DHW_45_100 45 140.00 5.845-20%/+20% 100% 50.409 SHP_DHW_50_100 50 126.66 5.845-20%/+20% 100% 45.")
324 PERFORMANCE EVALUATION PERFORMANCE EVALUATION 25/11/2014 DHW PROFILES TECHNOLOGY DHW profile name daily amount [l/d] amplitude V [m³/a] Eavg,day [kwh/d]** summer/winter rate of E_T44*** (excl. BU heater) TDHW,draw-off [ C]* SHP_DHW_40_ %/+20% 100% SHP_DHW_45_ %/+20% 100% SHP_DHW_50_ %/+20% 100% SHP_DHW_55_ %/+20% 100% SHP_DHW_60_ %/+20% 100% SHP_DHW_45_ %/+20% 43% SHP_DHW_55_43 amplitude %/+20% V daily [m³/a] amount 43% SHP_DHW_45_ %/+20% 87% Wh/d]** SHP_DHW_55_87 DHW profile summer/winter name 55 rate T DHW,draw-off of E_T44*** [ C]* %/+20% [l/d] (excl. BU heater) 87% E avg,day [kwh/ SHP_DHW_45_ %/+20% 130% SHP_DHW_55_130 SHP_DHW_40_ %/+20% % %/+20% Heat added % SHP_DHW_45_ %/+20% by BU heater 174% SHP_DHW_55_174 SHP_DHW_45_ %/+20% % 45-20%/+20% % SHP_DHW_45_ %/+20% Cold water 217% SHP_DHW_55_217 SHP_DHW_50_ %/+20% % 50-20%/+20% mixing % Legend: *T SHP_DHW_55_100 DHW,draw-off %/+20% Fixed temperature of domestic provided 100% by 55 the solar heat pump system [ C] For legionella 5 hot water supply prevention, the hot water tank additionaly SHP_DHW_60_ %/+20% daily amount Average daily volume of a week; thermal 100% 60 if it were supplied draw-offs and energy use fixed temperature TDHW, draw-off, 5 is heated to 60 C once benefits for are not included. domestic hot water draw-off at the and a cold water supply temperature of 10 C [l/d]. SHP_DHW_45_ %/+20% 43% E avg, day Average daily energy of domestic hot water Warmtepomp Symposium 11/09/ cold water supply temperature of 10 C [kwh/d]. SHP_DHW_55_ %/+20% were supplied 43% 55 temperature TDHW, draw-off, draw-off if it at the fixed and a heater to reach the minimum as set by some tappings. ** Part of this energy is delivered via electrical backup amplitude summer/winter Amplitude of the sine-curve SHP_DHW_45_ %/+20% temperature energy demand 87% 45 T44/A38 [Haller et al.; 2013] for for the variation of the DHW [%]. IEA-SHC task 44 / annex 38: 7 system configurations 1 2 Legend: System concepts lab installed Warmtepomp Symposium 11/09/ Warmtepomp Symposium 28 Warmtepomp Symposium 11/09/2013 7
325 SPF [-] SPF [-] SPF [-] SPF [-] SPF [-] SPF [-] 25/11/2014 System 1; Rate of E_T44=100% SPFexcl. BU 4.5 SPFincl. BU, excl. Pen 4 SPFincl. BU, incl. Pen Tset min, DHW tank [ C] System 2; Rate of E_T44=100% SPFexcl. BU 3 SPFincl. BU, excl. Pen 2.5 SPFincl. BU, incl. Pen Tset min, DHW tank [ C] System 1; Tset min, DHWtank=45 C System 2; Tset min, DHWtank=45 C 4.75 SPFexcl. BU 3.25 SPFexcl. BU SPFincl. BU, excl. Pen SPFincl. BU, incl. Pen SPFincl. BU, excl. Pen SPFincl. BU, incl. Pen Rate of Energy of DHW profile of T44 [%] Rate of Energy of DHW profile of T44 [%] System 1; Tset min, DHWtank=55 C System 2; Tset min, DHWtank=55 C 4 SPFexcl. BU 2.55 SPFexcl. BU Warmtepomp Symposium 11/09/ Rate of Energy of DHW profile of T44 [%] SPFincl. BU, excl. Pen SPFincl. BU, incl. Pen Rate of Energy of DHW profile of T44 [%] SPFincl. BU, excl. Pen SPFincl. BU, incl. Pen 8
326 15/09/2014 IWT-TETRA ZonWarm: Gecombineerde zonthermie en warmtepompen in residentiële toepassingen Maarten Sourbron Leen Goovaerts, Dries Van Aken, John Veeken, Jan Verheyen, 7 de Warmtepomp Symposium, 10 September 2014 Campus De Nayer, Sint-Katelijne-Waver Project Zonwarm (SolarHeat) Goal o o o Combination of solar thermal systems and heat pumps Which system concept Reliable values of achievable performance 1
327 15/09/2014 Overview Serie-system 2
328 15/09/2014 Parallel-system Regeneration of the ground 3


329 15/09/2014 Preferably solar collectors SPF-heat pump: 2,5 5 SPF-solar collector: o Measured values up to 160 o Measured values up to 7 Measured systems Installation 1 Installation 2 4
330 15/09/2014 System performance Heat pump production (thermal) SPF HP = Heat pump consumption (electrical) DHW + Floorheating (thermal) SPF += Heat pump total incl. SH pump (electrical) Solar collector production (thermal) f zon = DHW + Floorheating (thermal) System performance 5
 Solarcollector pump")
331 15/09/2014 System performance SPF solar system SPF solar = Solarcollector production (thermal) Solarcollector pump (electrical) 6


332 15/09/2014 Heat loss system Heat loss tubing No flow heat loss tubing storage 3-way-valve 80 kwh/month 7
333 15/09/2014 Regeneration 70kWh heat 1kWh E pomp SPF = 70 COP increases o How much? Circulation pump control SH-buffer T DHW-buffer Pump Temperature sensor SH-buffer 8
334 15/09/2014 Circulation pump control SH-buffer Heat production HP + pump elec. Circulation pump control SH-buffer Measurement data air/water heat pump adapted to leave out circulation pump electricity consumption Data: 1-7/4/2014 With existing control Circ. Pump electr (kwh_el) 16,3 9,4 SPF_system (-) 3,51 5,35 With adapted control Average outdoor temp. ( C) 14,4 Solar radiation (kwh/m²) 21,5 9

335 15/09/2014 Measuring heat flows Hydraulic connections and control Simulation results 10
 o DHW-comfort lower slightly (97% 95%) Hydraulic connections and")
336 15/09/2014 Hydraulic connections and control Providing buffer volume for solar thermal heat exchanger Correct layer-control for storge volumes Decreasing storage volume for DHW Decreasing set point for DHW (55 C-50 C) o DHW-comfort lower slightly (97% 95%) Hydraulic connections and control 11


337 Temperatuur buffer ifv hoogte ( C) Met koud ZC-volume Zonder koud ZC-volume 15/09/2014 Hydraulic connections and control Energy performance index EPB With or without solar for space heating With Without 12
338 15/09/2014 Task of the installation? Bedankt voor jullie aandacht! 13
339 INFLUENCE OF DOMESTIC HOT WATER DEMAND PROFILES ON ENERGY PERFORMANCE OF COMBINED SOLAR THERMAL AND HEAT PUMP SYSTEMS. Contributors: Jan Verheyen**, Maarten Sourbron* **,* KU Leuven, Faculty Industrial Engineering Sciences, Campus De Nayer, Research Group: THELES **corresponding author: +32 (0) ABSTRACT A well designed and controlled application of combined solar thermal and heat pump (SHP) system in the residential sector can contribute to the objectives regarding energy performance of buildings and the use of renewable energy sources aimed at in the European EPBD and RESD directives. The share of energy demand for the production and distribution of domestic hot water (DHW) in the total amount of energy demand in residential applications is growing with the efforts to reduce the energy use for space heating (SH). Two SHP systems sized to cover SH and DHW demand of a single family, low energy house in Belgian climate are subjected to various DHW draw off profiles and setpoint temperatures of the DHW storage tank. System 1 uses a stratified tank for heat storage for SH and DHW distribution with a ground source heat pump and glazed solar thermal collectors whereas system 2 uses two different tanks in parallel for DHW and SH with an air source heat pump and evacuated tube solar collectors. The systems perform best for a DHW tank cut in temperature of 45 C to deliver the DHW profile taken from IEA SHC task 44/annex 38. The results indicate that lower SPF values can be expected for properly sized SHP systems when subjected to another DHW profile as a result of a change in household size. INTRODUCTION This paper presents part results of the project Zon Warm. PROJECT DESCRIPTION ZON WARM 40% of total energy consumption and 36% of total CO2 emission of Europe is building related. The application of combined SHP systems for SH and DHW in residential buildings can contribute to the objectives regarding energy performance of buildings and the use of renewable energy sources aimed at in the European EPBD and RESD directives. A well designed and controlled application of SHP system in the residential sector has various important advantages. These can briefly summarized all be framed within following 3 improvements; an augmented seasonal performance factor by reaching higher solar fractions, a reduction of primary energy consumption and related CO2 emission and an augmented share of energy from renewable energy sources. The project aims at a relief of barriers for implementation and an augmented market share of SHP systems in Flanders, Belgium. More specifically, quality improvement of SHP systems is aimed at by optimizing various existing generic system configurations. A system performance evaluation method, producing reliable and comparable system performance indicators will be used. The results will be formalized in a state of the art literature report, a uniform measurement kit and a code of good practice with guidance on the choice of a suitable system configuration, a tool for dimensioning and guidelines for installation and energy performance calculation. The project results can lead to an added value of existing system components of solar thermal systems and heat pumps that can contribute to a higher market share of SME s active in the residential sector in Flanders, Belgium. The project can also contribute to the objectives included in the European EPBD and RESD directives and can stimulate economic growth and wealth through innovation. The results will be disseminated to suppliers and producers of components of solar thermal and heat pump systems on the one hand and designers of these systems on the other hand. These include architects, engineers, geologists and installers. Various SME s, scientific, academic, non profit or sectorial and governmental organisations participate in the project consortium. The project is funded by IWT
340 (Flemish Agency for Innovation by Science and Technology) together with the participating group of SME s. It is coordinated by THELES research group of KULeuven, Campus De Nayer. THELES also participates in IEA SHC task 44 / annex 38 of the solar heating and cooling programme. It is briefly referred to as T44 in this text. More information on the project Zon Warm can be found at warm.lessius.eu/. More information on the project T44 can be found at shc.org/. SHP SYSTEMS FOR THE PRODUCTION OF DHW The share of energy demand for the production and distribution of DHW in the total amount of energy demand in residential applications is growing with the efforts to reduce the energy use for SH. For passive, low energy and near zero energy houses the energy demand for DHW is even greater than the energy demand for SH [Lerch. et al.; 2012]. Figure 1 shows the amount of energy demand for SH and DHW for single family houses with a yearly specific energy demand for SH of 15 kwh/m², 45kWh/m² and 100 kwh/m². They correspond to a passive house, a newly built house according to relatively good standards and a renovated house with a useable floor area of 140m². The energy demand for DHW is adopted from T44 [Haller et al.; 2013] for a cold water supply temperature of 10 C. Energy demand [kwh/a] Space Heating 15 kwh/m²a Space Heating 45 kwh/m²a Space Heating 100 kwh/m²a Space Heating [kwh/a] DHW [kwh/a] Figure 1: yearly energy demand for SH and for DHW according to T44 [Haller et al.; 2013]. To yield the potential for further savings in energy demand for SH, increasing effort is needed for the low energy houses. It seems appropriate to shift the attention in the energy performance optimization question towards the DHW production and distribution especially for these type of buildings. The importance of the DHW load in the system sizing also augments for the low energy houses. SYSTEM DESCRIPTION SYSTEM SIZING Both systems are sized for a design heat load of 1673W (annual specific heating demand of 21 kwh/m²). This corresponds to SFH015 reference building as defined by T44 [Dott et al.; 2012] placed in Belgian climate. The tank volume for DHW corresponds to the maximum daily draw off volume during the year (namely in winter on a Sunday; 224l). The tank volume for SH is sized to allow storing of SH peak energy demand during one hour. The volume of water is calculated from the energy of the design heat load during 1 hour, for a temperature difference of 5 C between supply and return line of the SH system. This results in 288l for SFH015 in Belgian climate. The required peak power of the heat pump is calculated as the sum of peak power needed for DHW production and peak power needed for SH. The peak power needed for SH is taken equal to the design heat load of the building. The power needed for DHW production is taken equal to the energy needed to supply the maximum daily DHW draw off added by the daily tank heat losses in a period of 3 hours; the availability period of the heat pump for DHW production. The ground source (system 2; see below) is expected to deliver a peak power of 50W/m [McCorry et al.; 2011] [CEN; 2007]. The solar collectors are sized to obtain a solar fraction of the system of 100% in at least one but no more than two summer months for the reference boundary conditions. Both systems were not subjected to optimization for better performance. Higher performance values might be possible for other dimensioning and control strategies.
)) is coupled at different heights to a stratified buffer storage tank of 512 l with 100mm insulation.")
 thermal solar collectors are also coupled to the storage buffer via an external heat exchanger as part of the storage tank.")
341 SYSTEM 1 An electrically driven scroll compressor ground source heat pump with electronic expansion valve (R407C, nominal heating capacity: 5.60 kw, COP: 4.3 (at ground source side temperature 0 C and water side temperature 35 C ( T = 10 C))) is coupled at different heights to a stratified buffer storage tank of 512 l with 100mm insulation. The ground source consists of a single 32mm U tube borehole heat exchanger, 86m deep. 8.6m² glazed (flat plate) thermal solar collectors are also coupled to the storage buffer via an external heat exchanger as part of the storage tank. Figure 2: system diagram of system 1 (Vela Solaris; 2013) SYSTEM 2 Electrically driven air/water heat pump (R410A, nominal heating capacity: 5.49 kw, COP: 3.4 (at Ta =2 C LWC=35 C ( T = 5 C)) according to EN 14511). The heat pump contains an internal circulation pump on the return line of the system (supply to the condenser heat exchanger of the heat pump). The heat pump is connected to two tanks (224l (DHW) and 288l (SH)) in parallel each with 2 heating coils. The storage tank for SH is maintained at a temperature level suitable to feed the low temperature heating system of the building. The DHW tank is maintained at a temperature level suitable to provide the DHW draw off profile temperature. The tank is primarily fed by 3 m² vacuum tube collectors according to the heat pipe principle. The switching valves between the heat pump and the tanks are controlled to give priority to DHW tank heating. Figure 3: system diagram of system 2 (Vela Solaris; 2013)
342 BOUNDARY CONDITIONS CLIMATE A climate file from the database of Polysun is used, selected based on the location Location: Belgium; Sint Katelijne Waver (latitude: , longitude: 4.501, elevation: 4m). DHW PROFILES The profile for DHW demand (DHW) is adopted from T44 [Haller et al.; 2013]. These hot water draw off profiles are based on the EU mandate M/324 tapping cycle M (CEN/TC113N ) and (FprEN ), corresponding to an average draw off of 140 l/d at 45 C (cold water 10 C) or kwh/d (2133 kwh/a). This energy corresponds with 100 l/d at 60 C for a cold water supply of 10 C. The latter draw off is suggested by the current efforts of the European Union to harmonize test methods for hot water stores with the mandate M/324 (CEN/TC113N ) as an average for a single family [Haller et al.; 2013]. The profile [Haller et al.; 2013] is translated to a suitable format for input in Polysun. The original profile is shown in table 1. Legend: S=Small; Sh=Shower; FC=Floor cleaning; DW= Dish washing; HC=Household cleaning; Ba=Bath tub. Sunday only; bath tub replaces evening shower; Table 1: DHW profile [Haller et al.; 2013]
343 Power [kw] T44/A38 domestic hot water weekday profile Time [s] Power [kw] T44/A38 domestic hot water sunday profile Time [s] Figure 4: Power profile requested for instantaneous provision of DHW weekday (above), sunday (below) profile of table 1. Note regarding figure 4; the Sunday bath does not require additional power for instantaneous provision of the draw off energy profile in comparison to the daily evening shower; the draw off requires more time at equal flow rate and temperature. Limitations to the use of Polysun in regard to DHW input include following aspects; only one value can be chosen for the temperature of the DHW draw off. Each draw off is released instantaneous at the beginning of the respective timestep. Following steps were performed: 1) The energy of the original DHW profile is recalculated to the site specific average cold water supply temperature. The site specific cold water temperature is assumed to be equal to the average ambient temperature of Belgium (the average of hourly values from the reference year file containing weather data taken from TRNSYS file BE Uccle tm2; (yearly average ambient air temperature=9.7 C). 2) The minimum temperature of the hot water draw off is set to a fixed value and taken to be the constant temperature of all the hot water draw off; a. If higher values then the value for the fixed temperature (from start of step 2) occur in the original DHW profile, the additional energy needed for these tappings to heat the water from the fixed temperature to the higher temperature is delivered by an electrical back up heater. The energy is split up accordingly. The energy provided by the back up heater is taken into account outside the Polysun simulation. This energy is considered to be delivered to the DHW draw off and does not incorporate the system losses (such as storage tank thermal losses to the environment). It is suggested in T44 [Haller et al.; 2013] to apply a penalty factor of 1.5 directly to the energy supplied by the electrical back up heater. To compensate for the lack of taking these losses into account in the simulation, the penalty factor of 1.5 is used, to be multiplied with the energy provided by the back up heater.
344 b. If lower values then the value for the fixed temperature (from start of step 2) occur in the original DHW profile, the energy remains unaltered. (The resulting time of draw off (determined in step 4) at the same flow rate will be lower.) 3) A yearly file is composed. It is assumed the first day of the year is a Monday. The variation of the hot water demand over the year (for various reasons; see T44 [Haller et al.; 2013]) is taken into account by variation of each tapping energy with the time of year using a sine curve with amplitude of 20% according to the methods used in T44 [Haller et al.; 2013]. Note that the daily average energy consumption over the year is not exactly equal to the daily average energy consumption over the week because one year consists of 52 weeks and one Monday. HOUSEHOLD COMPOSITION AND DISTRIBUTION. The average household size is 2.3 for Belgium and 2.4 for the European Union (27 countries; including new member states), 2.3 for European Union (15 countries; excluding new member states) and 2.3 for Euro area (17 countries). (All data are taken from EUROSTAT, year=2010.) The data for Belgium are retained for further analysis. It is assumed that household composition does not influence the average amount of hot water draw off per person, meaning that the average DHW profile of a one person single family household is a factor 2.3 times smaller than the average. year #persons Table 2: Evolution of distribution of households by household size in Belgium (data: EUROSTAT) Te average of the table is 2.3 assumed that for the category 6, the average number < 8.5. Distribution of households by household size frequency [%] number of persons per household Figure 5: Evolution of household size in Belgium (data: Eurostat) The average frequency of the 5 persons single family households from 2004 until 2011 is 5.4%. It can be concluded that a 5 person single family household can be considered as a boundary case of what a normal DHW heating plant should be able to manage. Starting from the original DHW profile and considering all parameters fixed except the mass flow rates for all the tappings, the average amount of energy needed per day then becomes kwh and kWh for the cases of a one person and a 5 person single family household respectively.
345 DHW CASES daily amount [l/d] Table 3: DHW draw off profile cases considered. amplitude summer/winter rate of E_T44*** V [m³/a] (excl. BU heater) DHW profile name T DHW,draw off [ C]* E avg,day [kwh/d]** SHP_DHW_40_ %/+20% 100% SHP_DHW_45_ %/+20% 100% SHP_DHW_50_ %/+20% 100% SHP_DHW_55_ %/+20% 100% SHP_DHW_60_ %/+20% 100% SHP_DHW_45_ %/+20% 43% SHP_DHW_55_ %/+20% 43% SHP_DHW_45_ %/+20% 87% SHP_DHW_55_ %/+20% 87% SHP_DHW_45_ %/+20% 130% SHP_DHW_55_ %/+20% 130% SHP_DHW_45_ %/+20% 174% SHP_DHW_55_ %/+20% 174% SHP_DHW_45_ %/+20% 217% SHP_DHW_55_ %/+20% 217% Legend: *T DHW,draw off Fixed temperature of domestic hot water supply provided by the solar heat pump system [ C]. For legionella prevention, the hot water tank additionaly is heated to 60 C once a week; thermal benefits for draw offs and energy use are not included. daily amount Average daily volume of domestic hot water draw off if it were supplied at the fixed temperature TDHW, draw off, and a cold water supply temperature of 10 C [l/d]. E avg, day Average daily energy of domestic hot water draw off if it were supplied at the fixed temperature TDHW, draw off, and a cold water supply temperature of 10 C [kwh/d]. ** Part of this energy is delivered via electrical backup heater to reach the minimum temperature as set by T44/A38 [Haller et al.; 2013] for some tappings. amplitude summer/winter Amplitude of the sine curve for the variation of the DHW energy demand [%]. ***rate of E_T44: Rate of energy of domestic hot water draw off if it were supplied at the fixed temperature TDHW, draw off, and a cold water supply temperature of 10 C, compared to the energy of DHW draw off specified by T44/A38 [%]. 43% corresponds to a one person single family household (assumption average number of persons per household=2.3). 87% corresponds to a two persons single family household (assumption average number of persons per household=2.3). 100% corresponds to an average single family household according to T44/A38 [Haller et al.; 2013]. 130% corresponds to a tree persons single family household (assumption average number of persons per household=2.3). 174% corresponds to afour persons single family household (assumption average number of persons per household=2.3). 217% corresponds to a five persons single family household (assumption average number of persons per household=2.3). green color, bold Reference profiles. red color, underlined Parameters defining the deviation of the specific DHW profile in comparison to the reference profiles. When the minimum temperature of the case (specified by column with header TDHW, draw off) is lower than the minimum temperature indicated in the T44 DHW profile, part of the energy to reach the minimum temperature indicated in the T44 DHW profile is delivered by a backup heater. A recalculation is performed so that the daily average over the year (Eavg,day) for a cold water supply of 10 C matches the total energy needed to provide the rate of E_T44. The final resulting DHW load files are however constructed for the local cold water supply of 9.7 C.
346 Figure 6 gives an overview of the weekly total energy for all the DHW cases. Total energy (incl. penalty) [kwh/week] DHW draw off profiles Week SHP_DHW_40_100_var20 SHP_DHW_45_100_var20 SHP_DHW_50_100_var20 SHP_DHW_55_100_var20 SHP_DHW_60_100_var20 SHP_DHW_45_43_var20 SHP_DHW_55_43_var20 SHP_DHW_45_87_var20 SHP_DHW_55_87_var20 SHP_DHW_45_130_var20 SHP_DHW_55_130_var20 SHP_DHW_45_174_var20 SHP_DHW_55_174_var20 SHP_DHW_45_217_var20 SHP_DHW_55_217_var20 Figure 6: DHW weekly total energy (including backup heater with the use of the penalty factor of 1.5) over the year for all DHW profile cases as described in table 3. Figure 7 gives the same information as figure 6, but excluding the use of the penalty factor for the backup heater. Total energy (excl. penalty) [kwh/week] DHW draw off profiles Week SHP_DHW_40_100_var20 SHP_DHW_45_100_var20 SHP_DHW_50_100_var20 SHP_DHW_55_100_var20 SHP_DHW_60_100_var20 SHP_DHW_45_43_var20 SHP_DHW_55_43_var20 SHP_DHW_45_87_var20 SHP_DHW_55_87_var20 SHP_DHW_45_130_var20 SHP_DHW_55_130_var20 SHP_DHW_45_174_var20 SHP_DHW_55_174_var20 SHP_DHW_45_217_var20 SHP_DHW_55_217_var20 Figure 7: DHW weekly total energy (including backup heater) excluding the penalty factor over the year for all DHW profile cases as described in table 3. BUILDING SPACE HEATING LOAD The building reference from T44 [Dott et al.; 2012] with an annual specific heating energy demand of 15kWh/m² in the Strassbourg climate is taken. It is considered in the Belgian climate, resulting in an annual specific heating energy demand of 21 kwh/m². The heating system is a floor heating system of 140m² with inlet/outlet temperature setting of 35 C/30 C. As the focus of this paper lies on domestic hot water production, the influence of household size on the building SH demand is assumed to be negligible.
347 METHOD SIMULATION Polysun Designer v.6.1 (Vela Solaris; 2013) is used for the system simulations. It is briefly referred to as Polysun in this text. Limitations to the use of Polysun in regard to the system simulation include following aspects. The heat pump is considered to operate in an on/off modus. Polysun does not enable simulation of modulating power for heat pumps. The annual volume of DHW draw off expressed in m³ is round off to the integer. As the subject of this paper focuses on the production of DHW, it is chosen to represent the building in a simplified manner, via the design heat load. PERFORMANCE EVALUATION The performance of the system and the components is calculated according to following various methods;,,,,,,, 100., 100., In which; SHP SSC Share of the heat delivered by the heat pump to the system compared to the total heat delivered by the heat pump and the solar collectors [%] Share of the heat delivered by the solar collectors to the system compared to the total heat delivered by the heat pump and the solar collectors [%] SFexcl BU: Solar fraction of the system excluding the energy of the backup heater for DHW [%]
348 SFincl BU, excl. pen SPFincl BU, incl. pen Solar fraction of the system including the energy of the backup heater for DHW without the use of a penalty factor for the electricity consumption of the backup heater [%] Solar fraction of the system including the energy of the backup heater for DHW with the use of a penalty factor for the electricity consumption of the backup heater [%] SPFexcl BU: Seasonal performance factor of the system excluding the energy of backup heater for DHW [ ] SPFincl BU, excl. pen SPFincl BU, incl. pen Seasonal performance factor of the system including the energy of backup heater for DHW without the use of a penalty factor for the electricity consumption of the backup heater [ ] Seasonal performance factor of the system including the energy delivered by the backup heater for DHW with the use of a penalty factor of 1.5 for the electricity consumption of the backup heater [ ] SPFHP Seasonal performance factor of the heat pump [ ] SPFSC Seasonal performance factor of the solar thermal system [ ] Qheat source HP Qsol Quse DHW, excl BU Qnet, heating system QBU DHW Econsumption HP Epumps EBU Epenalty Heat delivered to the system from the ground source [kwh] Solar energy delivered to the system [kwh] Heat delivered for DHW consumption by the system excluding the heat delivered by the backup heater [kwh] Heat delivered to the space heating system by the system [kwh] Heat delivered by the backup heater for DHW [kwh] Electricity consumption of the heat pump [kwh] Electricity consumption of the pumps [kwh] Electricity consumption of the backup heater (without the use of a penalty factor) [kwh] Part of electricity consumption of the backup heater on top of EBU as a result of the use of the penalty factor [kwh] (= (penalty factor. EBU) EBU)

349 RESULTS Table 4 contains an overview of all the system simulation results and performance indicators. System DHW profile Table 4: System simulation results E excl BU [kwh] E BU,excl_Pen [kwh] E BU,incl_Pen [kwh] SPF excl. BU [ ] SPF incl. BU, SPF incl. BU, SF excl. BU excl. Pen [ ] incl. Pen [ ] [%] SF incl BU, SF incl BU, excl pen [%] incl pen [%] System 2 SHP_DHW_40_ System 2 SHP_DHW_45_ System 2 SHP_DHW_50_ System 2 SHP_DHW_55_ System 2 SHP_DHW_60_ System 2 SHP_DHW_45_ System 2 SHP_DHW_55_ System 2 SHP_DHW_45_ System 2 SHP_DHW_55_ System 2 SHP_DHW_45_ System 2 SHP_DHW_55_ System 2 SHP_DHW_45_ System 2 SHP_DHW_55_ System 2 SHP_DHW_45_ System 2 SHP_DHW_55_ System 1 SHP_DHW_40_ System 1 SHP_DHW_45_ System 1 SHP_DHW_50_ System 1 SHP_DHW_55_ System 1 SHP_DHW_60_ System 1 SHP_DHW_45_ System 1 SHP_DHW_55_ System 1 SHP_DHW_45_ System 1 SHP_DHW_55_ System 1 SHP_DHW_45_ System 1 SHP_DHW_55_ System 1 SHP_DHW_45_ System 1 SHP_DHW_55_ System 1 SHP_DHW_45_ System 1 SHP_DHW_55_ Figure 8 shows results of system 1 and 2 with DHW tank setpoint temperatures of 45 C and 55 C for T44 DHW profile. SPF HP [ ] SPF SC [ ] S HP [%] S SC [%] Figure 8: Energy balance and performance of system 1 and 2 with DHW tank setpoint temperatures of 45 C and 55 C subject to the T44 DHW profile for SFH015 in Belgian climate
350 Figures 9 to 11 show the results of the influence of varying setpoint temperature of the DHW tank (Tset min, DHWtank [ C]) and household size (translated to Rate of E_T44 [%]) on the performance of both systems. Mind the difference in magnitude of the SPF values (ordinate) between system 1 and system 2. SPF [ ] System 1; Rate of E_T44=100% Tset min, DHW tank [ C] SPFexcl. BU SPFincl. BU, excl. Pen SPFincl. BU, incl. Pen SPF [ ] System 2; Rate of E_T44=100% Tset min, DHW tank [ C] SPFexcl. BU SPFincl. BU, excl. Pen SPFincl. BU, incl. Pen Figure 9: influence of DHW tank setpoint temperature on SPF of system 1 (left) and system 2 (right) System 1; Tset min, DHWtank=45 C System 2; Tset min, DHWtank=45 C SPF [ ] SPFexcl. BU SPFincl. BU, excl. Pen SPFincl. BU, incl. Pen SPF [ ] SPFexcl. BU SPFincl. BU, excl. Pen SPFincl. BU, incl. Pen Rate of Energy of DHW profile of T44 [%] Rate of Energy of DHW profile of T44 [%] Figure 10: influence of household size on SPF of system 1 (left) and system 2 (right) at DHW tank setpoint temperature of 45 C System 1; Tset min, DHWtank=55 C System 2; Tset min, DHWtank=55 C SPF [ ] SPFexcl. BU SPFincl. BU, excl. Pen SPFincl. BU, incl. Pen SPF [ ] SPFexcl. BU SPFincl. BU, excl. Pen SPFincl. BU, incl. Pen Rate of Energy of DHW profile of T44 [%] Rate of Energy of DHW profile of T44 [%] Figure 11: influence of household size on SPF of system 1 (left) and system 2 (right) at DHW tank setpoint temperature of 55 C. DISCUSSION Figure 9 shows higher SPF values for lower DHW tank temperature setpoints when no backup heater energy is considered. When backup heater energy is considered, both with and without penalty, a maximum can be found in SPF at DHW tank temperature settings of 45 C. This corresponds to the minimum draw off temperature in the DHW profile. The energy of DHW tappings at this minimum temperature accounts for 82.9% of total energy of the reference T44 DHW profile. The remaining 17.1% is delivered at a minimum of 55 C. At lower setpoint temperatures (Tset min, DHWtank <45 C), the additional heat to reach the temperature of the tappings needs to be delivered by the backup heater. The backup heater is less efficient compared to the SHP system regardless of the use of the penalty factor. The use of the penalty factor engraves the difference. At higher temperatures (Tset min, DHWtank >45 C), the thermal losses of the system are higher, resulting in reduced SHP system performance.
351 Figure 9 and figure 10 show a more pronounced difference between the various performance indicators for system 1 in comparison to system 2. This can be partly explained by the higher SPF values of system 1. Figure 10 indicates an optimum for both systems at the reference T44 DHW profile. System performance will diminish when deviating from the DHW profile, the system was designed for. Such a deviation occurs for instance when household size alters. This means that both systems are best suited to manage the T44 DHW profile (average household size) in comparison to DHW profiles of other household sizes. The effect on SPF is less pronounced for system 2 and rather small for system 2. System 1 with DHW tank setpoint temperature of 45 C is an exception; it performs best at the smallest household size when taking the backup heater energy use into consideration. Based on these results, lower SPF values can be expected for properly sized SHP systems when subjected to another DHW profile as a result of a change in household size. Compared to the SPF incl BU, incl. pen value for 100% rate of T44 DHW profile volume, SPF incl BU, incl. pen value can diminish up to 7.1% when the rate has increased to 217% (system 1 for Tset min, DHWtank =45 C). Compared to the SPF incl BU, incl. pen value for 100% rate of T44 DHW profile volume, SPF incl BU, incl. pen value can diminish up to 4.4% when the rate has decreased to 43% (system 2 for Tset min, DHWtank =45 C). Up to 10% difference was obtained for SPF incl BU, incl. pen value for altered rate of T44 DHW profile (SPF incl BU, incl. pen value 10% for system 1 rate of T44 DHW volume 43% to 217% for Tset min, DHWtank =45 C). It should be noted that the volume of draw off will most likely not increase or decrease linearly with the number of persons constituting the household size. The corresponding decrease in SPF can be considered indicatory for the trend. Figure 11 shows no difference between the various performance indicators. No backup heater energy is delivered because the tank temperature is set as to enable DHW draw off of the highest temperature in the DHW profile. Figure 8 contains a comparison of performance indicators of system 1 and system 2 for DHW tank setpoint temperatures of 45 C and 55 C for the DHW profile defined by T44 [Haller et al.; 2013]. All the performance indicators show clearly that system 1 performs much better than system 2. All SPF and SF (regardless of the subscripts) values are higher for system 1 compared to those of system 2 for both the DHW tank setpoint temperature cases for the T44 DHW profile. Looking at the whole system, SPF of system 1 is between 50% and 58% higher compared to that of system 2 for the setpoint temperatures 45 C and 55 C (depending on the performance indicator used defined by the subscript of SPF and SF indicators). System 1 utilizes the solar heat for both DHW production and SH, whereas system 2 only uses the energy delivered by the solar panels for DHW production. The total area of solar collectors installed in system 1 has better performance in comparison to the collectors of system 2 (SPFSC, system 1=1032 versus SPFSC, system 2=260 and SPFSC, system 1=1030 versus SPFSC, system 2=284 for DHW tank setpoint temperatures of 45 c and 55 C respectively). The collectors of system 1 have a higher share in the heat delivered for DHW and SH in comparison to system 2 (Ssc, system 1=43.3 versus Ssc, system 2=28.6 and Ssc, system 1= 38.5 versus Ssc, system 2=27.0 for DHW tank setpoint temperatures of 45 c and 55 C respectively). The rules used for sizing both systems are equal but the technology of the solar collectors differs, they have a larger aperture area and the heat delivered is utilized for both SH and DHW. The results given in table 4 indicate that the trends of these conclusions also hold true for all the DHW profiles considered. Looking at the whole system, SPF of system 1 is between 39% and 67% higher and SF between 30% and 75% higher compared to those of system 2. The share of the heat delivered by the solar collectors to the system compared to the total heat delivered by the heat pump and the solar collectors is between 30% and 75% higher for system 1 compared to system 2. Regarding the use of the penalty factor for the electrical energy consumption of the backup heater, it should be noted that the use of this penalty factor can be decisive in disfavor of the SHP system using an electrical backup heater in comparison to other systems. However, depending on the technology of the backup heater and the distance from the tapping locations, the use of an electrical backup heater also causes thermal losses that should be taken into account. The use of the penalty factor for the calculation of the performance indicators should roughly compensate for these losses and discourages the use of an electrical backup heater.

352 CONCLUSIONS System 1 performs much better than system 2. System 1 utilizes the solar heat for both DHW production and SH, whereas system 2 only uses the energy delivered by the solar panels for DHW production. Both systems perform best when DHW tank minimum temperature is set at 45 C. For the T44 DHW profile, including the backup heater energy with penalty factor of 1.5, SPF of system 1 and system 2 equals 4.80 and 3.19 respectively. The performance of both systems alters when household size deviates from the size for which the system was designed regardless of the performance indicator considered. This is less pronounced for system 2. For an increase of the DHW draw off volume from 100% to 217%, corresponding with an increase in household size from average 2.3 to 5 persons, the results show a decrease of the SPF value of up to 7%. Based on the results of this study, lower SPF values can be expected for properly sized SHP systems when subjected to another DHW profile as a result of a change in household size. ACKNOWLEDGEMENTS The authors greatly acknowledge the funding and support of the Zon Warm project by IWT. REFERENCES CEN; 2007; EN 15450: Heating systems in buildings Design of heat pump heating systems; European Committee for Standardization (CEN), Brussels; 2007; Dott R., Haller M.Y., Ruschenburg J., Ochs F., Bony J.; 2012; The Reference Framework for System Simulations of the IEA SHC Task 44 / HPP Annex 38 Part B: Buildings and Space Heat Load A technical Report of Subtask C Report C1; Institut Energie am Bau Fachhochschule Nordwestschweiz, IEBau FHNW, Muttenz, Switzerland; 25/10/2012; Haller M., Dott R., Ruschenburg J., Ochs F., Bony J.; 2013; The Reference Framework for System Simulations of the IEA SHC Task 44 / HPP Annex 38 Part A: General Boundary Conditions A technical Report of Subtask C Report C1; Institut für Solartechnik SPF, Hochschule für Technik HSR, Rapperswil, Switzerland; 07/03/2013; Lerch W., Heinz A.; 2012; Simulation of different HP/solar systems incl. waste water heat recovery (WHR) for low energy buildings; meeting 5 Povoa, Portugal; 05/03/2012. McCorry M., Jones G.Ll. (eds); 2011; Geotrainet Training Manual for Designers of Shallow Geothermal Systems; Geotrainet, European Federation of Geologists; Brussels; 2011;


353 DEEL 1: Zonwarmtepompen: warmtepomp en zonneboiler in e e n 'Wat is de meerwaarde van een zonneboiler op een installatie die reeds een warmtepomp bevat? Hoe ziet een dergelijke gecombineerde installatie eruit? Welke dimensioneringsregels moeten gevolgd worden voor de verschillende componenten, hoe worden ze gekoppeld met elkaar en hoe wordt de regelaar ingesteld die een goede werking in alle omstandigheden moet garanderen? In het IWT-TETRA-project ZonWarm 1 heeft de vakgroep Thermotechniek van KU Leuven, technologiecampus De Nayer enkele installaties onder de loep genomen en werd aan de hand van dynamisch-thermische simulaties het effect van installatieconcepten en parametervariaties onderzocht. Maarten Sourbron, KU Leuven, Technologiecampus De Nayer, Sint-Katelijne-Waver. BEGIN KADERSTUK 1 Een warmtepomp haalt warmte van lage temperatuur uit een beschikbare warmtebron in onze omgeving: vaak is dat de buitenlucht, horizontale of verticale lussen in de bodem of bodemwater. Afhankelijk van de warmtebron, spreken we dus over warmte aan een temperatuur van bv. -10 C tot 10 C. In de warmtpomp stroomt een koelmiddel dat in contact komt met die warmtebron en op lage druk verdampt in de verdamper. De compressor doet de druk, en ook de temperatuur van het koelmiddelgas stijgen. Dit warm gas condenseert wanneer het in de condensor in contact komt met het water van de verwarmings- of warm waterkring van een gebouw (op bv. 25 C tot 45 C). Het water warmt hierdoor op. Het expansieventiel verlaagt de druk van het koelmiddel zodat het in de verdamper opnieuw warmte kan opnemen en de cyclus herbegint. In dit artikel behandelen we elektrisceh warmtepompen, maar andere types warmtepompen bestaan ook, zoals gasgedreven of met absorptietechnologie. EINDE KADERSTUK 1 BEGIN KADERSTUK 2 1 IWT-TETRA: en projectwebsite
 stroomt.")
 een heatpipe-absorber.")
354 Transparante afdekplaat Glazen buis Collector-kast Isolatie Absorber-plaat Leiding Heat-pipe Thermische zonnecollectoren verwarmen water (of een glycolmengsel of soms ook lucht) door de zonnestraling te aborberen op een koperen plaatje met een stralingsselectieve coating. Achteraan zit een koperen buis waardoor het water (of glycolmengsel) stroomt. De zonnestraling verwarmt het koperen plaatje, en zo, via de koperen buis het water of glycolmengsel. Zonnecollectoren zijn vaak uitgevoerd als vlakke plaat-collector of als vacuümbuis met (meestal) een heatpipe-absorber. EINDE KADERSTUK 2 Het doel van een zonwarmtepomp-installatie Eerst en vooral moet bij het ontwerp van een installatie goed gekeken worden naar de taak die deze installatie moet uitvoeren: verwarming van de woning en productie van warm water. De huidige wetgeving, met de steeds strengere EPB-richtlijnen, moedigt terecht de bouw van energiezuinige woningen aan. Figuur 1 geeft aan wat dit betekent: de vraag aan ruimteverwarming (RV) daalt terwijl de vraag aan sanitair warm water (SWW) gelijk blijft. Het feit dat de warmtevraag voor verwarming gelijk wordt aan die voor sanitair warm water zal een grote rol spelen bij het ontwerp van zonwarmtepompen in nieuwe woningen.
355 Figuur 1: Netto energiebehoefte voor ruimteverwarming (RV) en sanitair warm water (SWW) voor drie referentiewoningen uit het ZonWarm-project Hoe werken zonneboiler en warmtepomp samen? Globaal kan een zonwarmtepomp voorgesteld worden als een installatie met twee warmtebronnen (zonnecollectoren en warmtepompen) en twee warmtevragers (ruimteverwarming en sanitair warm water).
356 Figuur 2: Basisschema van een zonwarmtepomp-installatie met de mogelijke schakelingen. De warmte-aanbieders thermische zonnecollectoren en warmtepomp leveren warmte op twee temperatuurniveaus aan de warmte-vragers Sanitair Warm Water en RuimteVerwarming. Voor Sanitair Warm Water (SWW) is door het gepiekte verbruik een hoog vermogen nodig en een relatief hoge temperatuur van C. Omdat de hoeveelheid zonne-energie varieert tijdens de dag en een warmtepomp vaak een beperkt vermogen heeft, is een buffervat voor SWW altijd nodig. Verwarming met warmtepompen gebeurt typisch met een lage temperatuursysteem zoals vloerverwarming (25-45 C) en kent doorheen de dag een constantere warmtevraag. Voor ruimteverwarming is een buffer dan weer niet altijd noodzakelijk omdat bijvoorbeeld een vloerverwarming op zichzelf al een grote thermische massa heeft. BEGIN KADERSTUK 3 Figuur 3: Verband tussen Coefficient of Performance (COP) en Seasonal Performance Factor (SPF) van een warmtepomp De efficiëntie van een warmtepomp wordt typisch aangeduid met de Coefficient of Performance (COP) en de Seasonal Performance Factor (SPF). De COP is de verhouding van het geproduceerde warmtevermogen tot het elektrische vermogen van de compressor. De SPF kijkt daarentegen over een langere periode (een jaar, een stookseizoen) en is de verhouding van de geproduceerde warmte tot de hoeveelheid elektrische energie die in die periode nodig was om de warmtepomp én alle hulpapparatuur (pompen, regeling, bijverwarming, ) te laten werken. Hoe lager de temperatuur van de geproduceerde warmte, hoe hoger de SPF van een warmtepomp zal zijn. Voor vloerverwarming (25 C-45 C) zal de SPF dus hoger zijn dan voor sanitair warm water (45 C-60 C). Dit is belangrijk om de werking van een warmtepompinstallatie te begrijpen. Voor zonnecollectoren is het ook mogelijk een COP en SPF te berekenen. Immers, zonnecollectoren leveren warmte, maar hiervoor is ook elektrische energie nodig om de circulatiepomp aan te drijven. EINDE KADERSTUK 3
357 De SPF van elektrische warmtepompen varieert tussen 2,5 en 5. Dit wil zeggen dat voor elke verbruikte kwh elektriciteit, de warmtepomp 2,5 tot 5 kwh warmte levert aan de woning. Zonnecollectoren hebben daarentegen een SPF van ongeveer 50 tot 80 (hoewel er bij de ZonWarmmetingen ook pieken tot 160 gemeten werden): 1 kwh elektriciteit levert 50 tot 80 kwh warmte De zonnecollectoren kunnen dus met eenzelfde hoeveelheid elektriciteit meer warmte produceren dan warmtepompen. Daarom moet het gecombineerde systeem zo ontworpen en geregeld worden dat de zonnecollectoren altijd voorrang krijgen als er zonnewarmte beschikbaar is. Parallel of serie? In de meeste installaties worden de zonnecollectoren parallel aan de warmtepomp geschakeld (Figuur 4) : ofwel leveren de zonnecollectoren warmte aan de installatie (als er voldoende zoninstraling is), ofwel neemt de warmtepomp over. Uit een enquete, uitgevoerd tijdens het Europese project IEA SHC task 44 (task44.iea-shc.org) in verschillende Europese landen, bleek dat 93% van de aangeboden installaties parallel werken. Door de steeds lagere warmtevraag voor ruimteverwarming wordt het echter ook mogelijk om de zonnecollectoren als warmtebron voor de warmtepomp te gaan inzetten (serie-schakeling). Dergelijke systemen zijn echter nog zeldzaam en bevinden zich in de ontwikkelingsfase.
358 Figuur 4: (1) Zonnecollectoren werken parallel aan de warmtepomp, (2) zonnecollectoren als bron voor de warmtepomp (in serie). Installatieontwerp In een Europese project (IEA SHC task 44) waaraan de onderzoeksgroep meewerkte, werden 7 categorieën van installatietypes naar voor geschoven als standaard zonwarmtepomp installaties. Uiteraard kan hierop nog gevarieerd worden, maar hiermee is de basis geschetst. Elke gemeten of gesimuleerde installatie in dit project kan in één van deze 7 categorieën worden ingedeeld. Figuur 5 : 7 categorieën van type-zonwarmtepompen (IEA-Task44, 1. One beside the other, 2. Active regeneration, 3. Big buffer storage, 4. Maximal integration, 5. Unglazed collector, 6. Solar heating system, 7. Ambient air heat pump In het ZonWarm-project hebben we een parameterstudie uitgevoerd met een simulatieprogramma en daaruit bleek dat, ongeacht de installatiecategorie, de onderstaande ontwerprichtlijnen een goed basisontwerp opleveren:
) is immers hoger dan die van de warmtepomp (richtwaarde 3 tot 5) BASISPRINCIPE DIMENSIONERING De warmtepomp wordt gedimensioneerd zonder rekening te")

359 WIE EERST? Zonnecollectoren genieten voorkeur bij de productie van warmte boven de warmtepomp. De SPF van zonnecollectoren (richtwaarde 50)) is immers hoger dan die van de warmtepomp (richtwaarde 3 tot 5) BASISPRINCIPE DIMENSIONERING De warmtepomp wordt gedimensioneerd zonder rekening te houden met de zonnecollectoren. Bij afwezigheid van zonwarmte moet de installatie blijven draaien. De zonnecollectoren worden gedimensioneerd zonder rekening te houden met ruimteverwarming: de redenering is dat de lage temperatuurwarmte in de winter, die niet bruikbaar is voor SWW, wel kan gebruikt worden voor RV. WARMTEPOMP De warmtepomp wordt gedimensioneerd volgens de Code van Goede Praktijk defined. : Error! Bookmark not Warmteverlies volgens EN12831 Opslag SWW = 1.2 x (max. dagvolume + 40l) opwarmen op een gekozen tijd (bv. 4u) Q Warmtepomp = max (Q RV, Q SWW) ZONNECOLLECTOREN EN BUFFERVOLUME De zonnecollectoren + opslagvolume wordt gedimensioneerd volgens de TV212 van WTCB Dagelijks warm waterverbruik bepalen (bv. Bijlage 2 van TV212, IEA Task44, Code van Goede Praktijk voor warmtepompen: (Code) 50l/persoon.dag@40 C; de Code rekent nog een marge voor piekverbruik en voor het niet volledig benutten van het buffervolume. 50 liter SWW-buffervolume per m² zonnecollector AANDACHTSPUNTEN Er is geen beste systeemconcept. Dit hangt af van de concrete situatie. Wel zijn de volgende aandachtspunten belangrijk: Opslag van warmte leidt tot extra warmteverlies (opgemeten warmteverlieswaarden van 7% tot 40% van de totale warmteproductie) Een extra circulatiepomp leidt tot direct extra elektriciteitsverbruik met negatieve impact op het eindenergieverbruik Regeneratie van de bodem kan een positief effect hebben op de prestatie van de warmtepomp, maar kan ook een negatief effect hebben door het extra circulatiepompverbruik. Voorzichtig ontwerp, installatie en inregeling is noodzakelijk De hydraulische aansluiting en regeling van het buffervat is cruciaal voor een hoge SPF. Temperatuurslagen mogen niet vermengd worden
360 DEEL 2: Lessen uit metingen van het ZonWarmproject Meten is weten : lessen uit de meetcampagne In het ZonWarm-project werden 4 installaties opgemeten in reële omstandigheden. Om op de vraag naar de meerwaarde van zonnecollectoren op installaties met een warmtepomp te kunnen beantwoorden, werden de nodige meters voor warmte en elektriciteit geïnstalleerd. Hierbij werd geprobeerd een zo volledig mogelijke energiebalans van de installatie op te maken: Het elektrisch verbruik van de warmtepomp plus alle pompen die ermee gestuurd worden, de pomp van de vloerverwarming en de pomp van de zonnecollectoren; De warmte die van de bodem naar de warmtepomp gaat; van de warmtepomp naar het buffervat; van het buffervat naar de verwarming en het SWW; van de zonnecollectoren naar het buffervat en naar de bodem (dit laatste is de regeneratie). Deze meetcampagne leverde enkele nuttige en leerzame resultaten. Zo bleek bij één installatie dat een niet perfect geïsoleerde leiding tussen het buffervat en de vloerverwarming tot 80kWh warmte per maand verliest. Bij een andere installatie veroorzaakte de circulatieleiding voor tapwater, weliswaar zonder kloksturing, een warmteverlies dat opliep tot 30% van de geproduceerde warmte. Dit betekent dat aandacht voor het leidingwerk essentieel is voor een goed werkende installatie. Het is zonde om efficiënt geproduceerde warmte verloren te laten gaan in een slecht uitgevoerde installatie. Een derde installatie was een standaard all-in-one unit met warmtepomp en sanitair buffervat in één toestel ingebouwd: een E26 woning van 250m² met een 10kW-bodem-water warmtepomp en 5m² vlakkeplaat-collectoren die enkel een sanitair buffervat van 250l opwarmen. De zonnecollectoren leveren dus geen warmte aan de verwarming in dit geval.

361 Figuur 6: Schema van warmtepomp (10kW) met geïntegreerd warm water vat van 250 liter, 5 m² vlakke plaat collectoren en 2 gesloten bodemcollectoren van elk 100m lengte. Dit heeft zeker een voordeel naar installatietijd, maar zorgt er ook voor dat de inregeling fabrieksmatig is uitgevoerd en niet gevoelig is aan installatiefouten. De SPF was 4.55 voor de volledige meetperiode (januari-juni 2014). In het tussenseizoen wordt het positieve effect van de zonnecollectoren gedeeltelijk teniet gedaan door de lagere SPF van de warmtepomp, vermits het aandeel SWW stijgt (zie hieronder). De zonnecollectoren leverden 32% van het warm water in de volledige meetperiode (en tot 99% in juni 2014). De zonnecollectoren werkten met een SPF van 6 voor de maanden april-juni De laatste installatie was een 15kW bodem-water warmtepomp met 17m² vacuümbuis-collectoren en een 750l combivat in een E67 woning van 350m². Het grote aantal zonnecollectoren was bedoeld om zoveel mogelijk zonne-energie te kunnen gebruiken voor zowel verwarming als warm water. De SPF van de volledige installatie was 5.43 voor de volledige meetperiode (februari-juni 2014), terwijl de zonnecollectoren zelf een SPF hebben van 163: om 163kWh warmte te leveren verbruikt de circulatiepomp van de zonnecollectoren maar 1kWh. Dit is een uitzonderlijk goed resultaat, wat het gevolg is van een goed ontwerp en een juiste inregeling van de installatie. 41% van de warmte voor
362 verwarming én warm water kwam van de zonnecollectoren. Deze installatie voorzag ook directe koeling, waarbij de bodemsondes via een warmtewisselaar aan de vloerverwarming worden aangesloten en de metingen gaven aan dat per 1kWh elektrisch verbruik van de circulatiepompen er 16kW koude geleverd werd. Typisch beeld van de prestatie van een zonwarmtepomp Figuur 7 toont een typisch beeld van de installatie-spf en de zonnefractie (het aandeel zonnewarmte in de totale warmteproductie) voor een zonwarmtepomp. De figuur geeft aan dat de zonnecollectoren vanaf maart een aanzienlijk deel van de warmte leveren: in april tot 60%, in mei bijna 70% en in juni net geen 100%. Toch stijgt de SPF van de volledige installatie (warmtepomp+zonnecollectoren) niet echt tot en met de maand mei. De reden is de volgende: enerzijds stijgt de installatie-spf omdat het aandeel zon stijgt, maar dit wordt tenietgedaan omdat de warmtepomp aan een lagere SPF werkt. Figuur 7: Typisch SPF- en zonnefractie- verloop van een zonwarmtepompinstallatie Aan de hand van Figuur 8 kan dit uitgelegd worden. Tot en met maart is er meer warmte nodig voor de vloerverwarming dan voor het sanitair warm water. Omdat de SPF van de warmtepomp bij vloerverwarming hoger is dan bij sanitair warm water, is de globale SPF van de installatie hoog: het relatief kleine aandeel warmte voor sanitair warm water, heeft geen grote invloed op het totaal.
363 Warmte (kwh) 2500 Warmtevraag Sanitair warm water (kwh) Vloerverwarming (kwh) Totale warmtevraag (kwh) 0 Maand Figuur 8: De warmtevraag van dezelfde zonwarmtepomp als in Figuur 7 Vanaf april verandert dit echter en moet er nagenoeg enkel nog warmte geleverd worden op hoge temperatuur voor het sanitair warm water. De zon voorziet voor ongeveer 60% in de energie voor het sanitair warm water. Dit wil zeggen dat de warmtepomp nog 40% van de energie voor het sanitair warm water moet voorzien en amper energie voor vloerverwarming. Hierdoor moet de warmtepomp het grootste deel van de tijd op hogere temperatuur presteren en werkt dus met een lage SPF. Dit doet het voordeel van de zonnecollectoren teniet. Pas vanaf juni, wanneer de zonnecollectoren quasi 100% van de warmte voor sanitair warm water leveren, stijgt de SPF van de installatie ook aanzienlijk. Regeneratie van de bodem Vaak komt ter sprake dat de zonnecollectoren de bodemsondes ook kunnen regenereren : als de zon maar zwak schijnt en de temperatuur van de zonnecollectoren te laag is voor RV of de thermische buffers opgeladen zijn, kan overwogen worden om de warmtebron (bv. bodemlussen) op te warmen (zie Figuur 9). Hierdoor stijgt de temperatuur van de bron, wat dan weer de prestatiefactor van de warmtepomp ten goede komt.
364 Figuur 9: Zonnecollectoren regenereren de warmtebron van de warmtepomp. De conclusies hierover uit de metingen van het ZonWarmproject en uit andere bronnen zijn de volgende: van één bodem/water warmtepomp werd bij een 4 uur durende regeneratieperiode een prestatiefactor van 60 gemeten (met 1kWh elektrische energie werd 60kWh warmte in de bodem gestoken). De bijhorende bodemtemperatuurstijging was ongeveer 1 C. De impact van deze energieinjectie op de prestatie van de warmtepomp is echter moeilijker te becijferen, maar zal vermoedelijk eerder beperkt zijn. In een tweede bodem/water-installatie werd echter een lage prestatiefactor van slechts 9 opgemeten. Bij deze installatie is wel geweten dat de bronpomp, met een vermogen van 400W, te zwaar gedimensioneerd is en dus de performantie van de installatie naar beneden trekt. Simulatiestudies 2 wijzen uit dat regeneratie de SPF met 0,2 kan doen stijgen. Een negatief effect is echter ook mogelijk bij een slechte inregeling van de debieten. In dat geval zal de circulatiepomp die nodig is voor de regeneratie meer verbruiken dan dat het warmtepompverbruik zal dalen door de hogere prestatiefactor. Als conclusie moeten we stellen dat regeneratie geen duidelijke meerwaarde heeft. Indien het toch gebeurt, moet de installatie met zorg gedimensioneerd en ingeregeld worden. Veel warmteverliezen door vat en leidingen Wat we overal zien is dat een buffervat toch best wel wat warmte verliest, onder meer als gevolg van niet-geïsoleerde leidingdelen. Vooral bij kleine of passief woningen, waar weinig moet verwarmd worden, haalt dit warmteverlies de SPF van de installatie behoorlijk naar beneden. De verliezen van een buffervat zijn in dergelijke laag-energie woning bij wijze van spreken bijna evenveel als wat je effectief aan warmte aan het verbruiken bent. Metingen in onze installaties in-situ hebben 2 Erik Bertram*, Peter Pärisch and Rainer Tepe, Impact of solar heat pump system concepts on seasonal performance-simulation studies, EuroSun 2006, June 2006, Glasgow, UK
365 energieverliezen van 7% tot meer dan 40% opgeleverd: dus 7-40% van de warmte die de zonnecollectoren of warmtepomp leveren, gaat verloren via de buffervaten en leidingen. Zelfs bij een secuur uitgevoerde installatie met correcte isolatieplaatsing hebben we 16% warmteverlies gemeten. Warmteverlies is vooral groot wanneer de installatie op deellast werkt en de thermische buffer op temperatuur gehouden wordt voor slechts een kleine warmtevraag. Overdimensionering van de buffer moet dus absoluut vermeden worden en de installateur moet aandacht schenken aan een correcte isolatie van aansluitingen tussen buffervat en leidingen. Besluit Zonnecollectoren inzetten voor zowel sanitair warm water productie als voor ondersteuning van de ruimteverwarming heeft een positieve impact op de prestatie van de totale warmtepompinstallatie. Regeneratie van de bodem met zonnewarmte heeft echter een minder duidelijk effect. Net zoals vaak het geval is, zijn ook deze installaties gevoelig aan fouten bij ontwerp, plaatsing en inregeling en kunnen deze fouten de systeemprestatie drastisch doen kelderen. Eenvoudige en robuuste systeemconcepten zijn duidelijk te verkiezen boven ingewikkelde installaties met complexe regelingen. De steeds verdere daling van de energievraag voor ruimteverwarming, maakt de aandacht voor warmteverlies van bijvoorbeeld buffervaten of ongeïsoleerde leidingdelen absoluut noodzakelijk.

366 Proceedings of the ASME 2015 International Mechanical Engineering Congress & Exposition IMECE2015 November 13-19, 2015, Houston-TX IMECE DETERMINATION OF HEAT TRANSFER CHARACTERISTICS OF SOLAR THERMAL COLLECTORS AS HEAT SOURCE FOR A RESIDENTAL HEAT PUMP Maarten G. Sourbron and Nesrin Ozalp KU Leuven, Faculty of Engineering Technology THELES Thermal and Electrical Systems Research Laboratory Sint-Katelijne-Waver, 2860 Belgium ABSTRACT With reducing energy demand and required installed mechanical system power of modern residences, alternate heat pump system configurations with a possible increased economic viability emerge. Against this background, this paper presents a numerically examined energy feasibility study of a solar driven heat pump system for a low energy residence, where a flat plate solar collector served as the sole low temperature heat source. A parametric study on the ambient-tosolarfluid heat transfer coefficient was conducted to determine the required solar collector heat transfer characteristics in this system setup. Moreover, solar collector area and storage tank volume were varied to investigate their impact on the system performance. A new performance indicator availability was defined to assess the contribution of the solar collector as low temperature energy source of the heat pump. Results showed that the use of a solar collector as low temperature heat source was feasible if its heat transfer rate (UA-value) was 200 W/K or higher. Achieving this value with a realistic solar collector area (A-value) required an increase of the overall ambient-tosolarfluid heat transfer coefficient (U-value) with a factor 6 to 8 compared to the base case with only natural convection heat exchange between solar collector cover and ambient. Keywords: heat pump, solar collector, low temperature heat source NOMENCLATURE Upper case symbols A [m 2 ] Area C [-] Compactness of the building (heated volume divided by heat loss area) C [J/K] Thermal capacitance C [W/K] Heat capacity flow COP [-] Coefficient of performance E [kwh] Electrical energy F [-] solar collector heat removal factor (ratio of heat removed by the fluid to heat supplied by solar radiation) G [W/m²] solar irradiance on tilted plane of the collector Nu [-] Nusselt number Pr [-] Prandtl number Q [W] Heat flux Q [kwh] Thermal energy Ra [-] Rayleigh number S [W/m 2 ] Solar flux absorbed by the solar collector plate SPF [-] Seasonal performance factor T [ C] Temperature U [W/m 2 K] Overall heat transfer coefficient V [m 3 ] Volume Lower case symbols a [W/m²] First order correction factor in solar collector efficiency equation av [-] availability of the solar collector as low temperature heat source b [(W/m²) 2 ] Second order correction factor in solar collector efficiency equation c p [J/kgK] Specific heat at constant pressure 1 Copyright 2015 by ASME
367 m [kg/s] Mass flow rate q [W/m 2 ] Specific heat flux Greek symbols α [m 2 /s] Thermal diffusivity ε [-] Heat exchanger effectiveness η [-] efficiency λ [W/mK] Thermal conductivity ν [m 2 /s] Kinematic viscosity τα [-] transmittance-absorptance product of the collector cover Subscripts add additional amb ambient bu back-up (electric) c cold side of heat exchanger H high temperature heat heated (area or volume) HP heat pump h hot side of heat exchanger in inlet of fluid l length L low temperature loss heat loss m mean max maximal min minimal occ occupation (people) out outlet of fluid sc solar collector set set point st storage tank t top of the solar collector cover tot total TYPE1 TRNSYS-TYPE1 solar collector model ws water supply INTRODUCTION Pending fossil fuel shortage and environmental consequences of energy conversion systems compulsorily facilitate more considerate and diverse use of energy not only in power generation and manufacturing, but also for heating and domestic hot water production in residential sector. Although heat pumps are one of the most energy efficient technologies for residential heating and domestic hot water production, their economic viability is often compromised. In typical heat pump installations, air, ground or ground water are being used as low temperature heat source. Although air-source heat pumps have low capital investment, their efficiency can decrease significantly when the outdoor temperature drops because compressor consumes more power to compensate the pressure loss. When the outside temperature drops close to 0 C range, frost accumulation on the evaporator coils lowers the heat transfer rate and imposes inversion of the thermodynamic cycle for defrosting. Ground loop heat exchangers (GLHE) or ground water systems avoid such decrease in heat pump efficiency, but require extra cost for bore hole drilling. Together with the bore hole space requirements, this prevents wide spread application of these systems. In multi heat source heat pump systems complex control strategies hamper achieving the theoretical energy performance. Solar thermal collectors can supply additional low temperature heat for heat pumps. There have been studies showing the benefit of coupling regenerating ground loop heat exchangers with solar thermal collectors. After all, they produce low temperature heat that can be exploited to increase the GLHE temperature, which increases the COP of heat pump. However, for example, Javed (1) shows that only GLHE with degradation of the ground loop that is substantially more than 10 K can benefit from regeneration. In cases where GLHE is undersized, regeneration can be beneficial (2). But the electricity use of circulation pumps must be controlled by lowering the flow rates (3). Otherwise, increase in heat pump performance due to an increase in source temperature would be degraded by increase in electricity consumption of circulation pump. Rad et al. (4) show that regeneration can reduce required borehole length by 10% to 25%, depending on the climate. However, for residences requiring cooling, regeneration increases the cooling energy use by increasing the GLHE temperature. Although the borehole length reduces, investment cost does not decrease at equal rate because part of the GLHE drilling costs covers fixed costs. Furthermore, local environmental regulations state that the ground temperature around GLHE s should be limited to 25 C to avoid bacteria growth (5). This reduces the potential of regeneration. Considering the fact that energy performance requirements for buildings continuously tighten up and lead to nearly zero energy buildings by 2020 per European energy performance in buildings directive, energy use for residential heating has been noticeably reducing. For passive, low energy and near zero energy houses, energy demand for domestic hot water is even greater than the energy demand for space heating (6). Moreover, required installed mechanical system power decreases. Energy efficient but complex and therefore expensive heating systems are no longer justifiable because of their low payback potential. Ground coupled heat pump systems are an example of this circumstances. Drillings for vertical ground loop heat exchangers (GLHE) represent a major part of the overall investment especially in areas where the ground has poor heat transfer parameters. Furthermore, control losses of such systems are substantially high. Therefore, a heat pump system with solar thermal collectors as the only low temperature heat source might be an alternative to GLHE for low energy consuming residences. Solar thermal collectors are often installed to partly cover the hot water demand. For larger areas, these solar collectors can 2 Copyright 2015 by ASME
368 also supply heat to heat pump. When a solar thermal collector is being used directly as the heat source of a heat pump, it is not only a solar radiation collecting device, but also an air-fluid heat exchanger. Even in the absence of solar radiation, the collector transfers heat from the surrounding air to the solar receiver fluid in the collector. Solar receiver fluid can be the refrigerant of heat pump, or a water-glycol mixture when the system has an intermediate low temperature loop. It should be noted that the collector performance is enhanced in the presence of solar radiation, but also in the presence of other atmospheric conditions, such as wind or rain. Mojic et al. (7) compared simulation results of heat pump systems with selective uncovered solar collectors as the low temperature heat source for space heating and domestic hot water with parallel air source heat pump concepts of 10 m 2 collector area. The results indicate that the seasonal performance factors for both system approaches (serial with uncovered vs. parallel with covered) were quite similar in most European climates. Using solar collectors and waste water heat recovery as source for a heat pump has been investigated by Heinz et al. (8) as well. Simulations show that the seasonal performance factor can reach values well above 4. However, the best results are achieved when ice storage is used as the heat source, which is charged by the collector field and the waste water heat exchanger. Research presented in this paper was conducted in the framework of Solar and Heat Pump Systems project within the Solar Heating and Cooling program and the Heat Pump program of the International Energy agency (IEA SHC Task 44/HPP Annex 38). In this program (9), an extensive survey of system functions (10) shows that 87% of the Solar Heat Pump systems (SHP) are used for both space heating and domestic hot water production. 66% of these systems are combined with active and/or passive cooling. However, 61% of the systems have a parallel layout, which means that the solar thermal collectors are integrated in the system parallel to the heat pump and are not used as low temperature heat source for the heat pump. In this paper, simulations were done using TRNSYS (11) to determine the required thermal characteristics of the solar thermal collector to serve as low temperature heat source for a residential low energy consuming heat pump system. Typically, for solar thermal applications, the solar collector efficiency increases by using selective absorber materials and reducing the energy loss to the environment. However, when solar thermal collector operates as an air-fluid heat exchanger its heat transfer requirements change. Therefore, a parametric study was conducted to determine the impact of solar collector heat transfer coefficient between receiver fluid and ambient air on the overall heat pump system efficiency, namely Seasonal Performance Factor or SPF. Furthermore, a new performance indicator availability was defined to assess the contribution of the solar collector in the low temperature energy delivery to the heat pump. This result determined the required thermal properties of the solar thermal collector to act as sole low temperature heat source of the heat pump. SOLAR COLLECTOR HEAT LOSS COEFFICIENT Typical approach to determine the thermal performance of a solar collector is referring to the Cooper and Dunkle formula of instantaneous solar collector efficiency (12) as a second order fit: η sc = F sc (τα) a (T in T amb ) G b [ (T in T amb ) ] 2 (1) G Equation 1 represents the temperature and solar flux dependence of the collector efficiency, where a and b are measured correction factors. This efficiency is typically used in thermal simulations to define the useful heat gain Q sc by the solar collector: η sc = Q sc A sc G Using above formula means that Q sc will be zero whenever the incident solar radiation becomes zero. However, for the approach of this article, solar collector model should also describe heat exchange in the absence of solar radiation. TRNSYS simulation results indicated that, in the absence of solar radiation, the thermal output of the solar collector model is not zero, but showed about 2.1 W/m²K of heat transfer from the surrounding air to the receiver fluid in the collector. This heat transfer coefficient is of great importance for the use of the solar thermal collector as a direct heat source of the heat pump system. It basically determines the performance of solar collector as an air-fluid heat exchanger in the absence of solar radiation. When the solar collector is used as a heat source for heat pump system, the thermal situation is different than it is in typical solar thermal applications. In latter, solar absorber of the collector is always considered to be warmer than the surroundings and heat flows from the solar collector to either receiver fluid or to the ambient. When using solar collector as a heat source for heat pump, the temperature difference is negative and heat is transferred from the ambient to the receiver fluid. HEAT TRANSFER WITHOUT SOLAR RADIATION First step was to quantify achievable heat transfer between ambient air and receiver fluid in solar collector. An uncovered solar collector can be simplified by considering natural convection between flat plate and surrounding air using the following correlation (13): (2) 3 Copyright 2015 by ASME
369 Nu l = Ra l 1/4 (Pr/( Pr)) 1/4 (3) This correlation is given for natural convection under low wind speed conditions which is applicable to the present case. The temperature difference between the ambiance and the solar collector cover temperature was assumed to be 5 C. The characteristic length of the solar collector was 2 m. Thermal properties of air were taken at 0 C (13): ν = m 2 s, α = m 2 s and λ = W mk. Using these values in Equation 3, heat exchange was found to be 9.18 W/m² or 1.84 W/m²K. This is in close approximation with the TRNSYS value of 2.1 W/m²K and indicates that the TRNSYS coefficient is only representative for natural convection heat transfer from the ambient air to the solar collector surface. However, most of the time, heat transfer from the absorber surface of the solar collector is not governed by natural convection, but by forced convection and radiation. The a and b coefficients in the solar collector efficiency formulation (Eq. 1) are wind speed dependent. Since this dependence is often unknown, this entailed a second reason for the solar collector efficiency approach (Eq. 1) not being applicable in this research and an alternative approach was required. Duffie and Beckman (12) developed an overall heat loss coefficient formula for a solar collector based on the geometry and material parameters where no measured a and b values are available. In present work, this formulation was used to assess the overall heat transfer rate in the presence of forced convection and radiation. A simplified thermal network was considered where the absorber plate temperature was lumped into 1 mean solar collector temperature T sc,m as seen in FIGURE 1. Amount of solar flux absorbed by the plate was denoted by S which is equal to the incident solar radiation reduced by the optical losses. This absorbed energy was allocated among the thermal losses through the top and the bottom of the solar collector, and the useful energy gain of the solar collector which was given by Q sc = m c p (T sc,out T sc,in ). FIGURE 1: EQUIVALENT THERMAL NETWORK FOR FLAT- PLATE SOLAR COLLECTOR WITH (LEFT) AND WITHOUT (RIGHT) SOLAR RADIATION (ADAPTED FROM (10)) The equation resulting from the thermal network in FIGURE 1 accounted for a solar collector with (S > 0; T amb < T sc,m ) and without solar radiation (S = 0; T amb < T sc,m ) as follows: Q sc = S + [U sc A sc (T amb T sc,m )] (4) Considering steady state conditions, Duffie and Beckman (12) derived an empirical correlation for the loss coefficient U t from the top of the solar collector cover to the ambient by taking both forced convection and radiation into account along with the wind speed and inclination of the solar collector. By adding losses from the bottom and edges, it was found that the global heat transfer coefficients U sc ranged between 2 and 10 W/m²K for different collector characteristics and thermal boundary conditions. This indicated that the global heat transfer might be higher than the natural convection value which was taken into account in TRNSYS solar collector model. METHODOLOGY In order to investigate the feasibility of the solar collector as a heat source for a residential heat pump, simulations were done using TRNSYS. A heat pump system was designed for a low energy consuming residence (FIGURE 2). The solar collector served as the low temperature heat source for the heat pump cycle, while an electrical back-up was placed in series with the solar collector to assist whenever the receiver fluid cannot be heated above T HP,in,min, the lower temperature threshold imposed by the heat pump operating limits (-15 C in this case). In the thermal network approach of FIGURE 1, it was assumed that U sc is independent of the direction of the heat flow between collector plate and ambient air. However, this imposes a problem because the empirical correlation, as proposed by Duffie and Beckman (12), for the convection between collector cover surface and the ambient air (this correlation is one of the factors composing U sc ) is only valid for positive (T sc,m T amb ) values, which is not the case in heat pump application without solar radiation. Therefore an alternative approach was used in the present parametric study, where a global heat transfer coefficient range of U sc = 2 10 W/m²K was adopted to determine the influence on the system performance. The physical way this heat transfer coefficient is achieved, was not specifically taken into account in this article. This resulted in design solar thermal collector heat transfer characteristics to be sought in order to be applicable as low temperature heat source for a heat pump unit. U sc = 2 W/m²K was the base case with only natural convection. In the other cases, the heat transfer from the ambient to the solar fluid was enhanced. 4 Copyright 2015 by ASME
370 The idea was to design a solar heat pump system that was able to act as sole heating system for a residence, provided the low temperature heat source could generate sufficient energy. Therefore, as shown in FIGURE 2, a 200 m² low energy residence with a normalized heat loss of 6 kw (30 W/m² heated floor area) was modeled. The residence was heated by low temperature heating system with a weather dependent water supply temperature controlled per following correlation: where maximum temperature was set at 35 C and the ambient temperature was 8 C. This ensures a high heat pump COP during operation if the low temperature heat source is sufficient. Heating was supplied by the water storage tank serving as heat storage. The heat pump kept the storage tank at set point of T st,set = T ws,set with control hysteresis of 1.5 C. (5) T ws,set = 0.59 T amb FIGURE 2: SOLAR HEAT PUMP SYSTEM COMPRISING SOLAR THERMAL COLLECTORS, ELECTRICAL BACK-UP, HEAT PUMP, HEAT STORAGE AND RESIDENCE (WITH INDICATION OF MEASUREMENT POINTS) The building and heat pump system were implemented in TRNSYS. The building was simplified by one-zone model (TYPE12) characterized by one heat loss coefficient, and a thermal capacity. The parameters used in simulations are presented in TABLE 1. TABLE 1: PARAMETERS OF THE TRNSYS RESIDENCE MODEL Parameter Symbol Value Unit Heat loss at 8 C Q loss 6000 W Compactness (beam with saddle roof) C Heated floor area A heat 200 m² Heated volume V heat 540 m³ External loss area A loss 386 m² Thermal mass C heat kj/k Internal heat gain (during occupation) q occ 7.5 W/m² The heating system was modelled as a simple heat exchanger and was characterised by its effectiveness ε as shown in TABLE 2. The water side of the heating system was designed to operate at C at minimum ambient temperature of 8 C. The average indoor air temperature set point of the residence was 19 C during the day time and 16 C at night time. TABLE 2: PARAMETERS OF THE HEATING SYSTEM MODELLED AS A SIMPLE HEAT EXCHANGER Parameter Symbol Value Unit Heat exchanger conditions at -8 C Water-side Inlet temperature T h,in 35 C Outlet temperature T h,out 30 C Heat capacity (water) c p 4186 J/kg K Water flow rate m 1032 kg/h Heat capacity flow C min 1200 W/K Air-side (residence) Inlet temperature T c,in 19 C Outlet temperature T c,out 19 C Heat capacity flow C max W/K Derived heat exchanger properties Effectiveness ε Effective heat capacity flow εc min 375 W/K 5 Copyright 2015 by ASME

371 The storage tank had a volume of 500 L and the solar collector an area of 25 m². The storage tank was capable of providing the maximal residence heat loss during 0.5 hours. In the parametric analysis, storage volume and collector area were varied according to the values given in TABLE 3 to evaluate their impact on the required heat exchange enhancement of the solar thermal collector. For the same building, this led to 9 possible combinations of solar collector area and storage tank volume, for which the effect of collector heat transfer enhancement was investigated. TABLE 3: STORAGE TANK AND COLLECTOR AREA VALUES FOR THE PARAMETRIC STUDY Solar collector area A sc Storage tank volume V st Minimal value Standard value Maximal value 12.5 m 2 25 m m L 500 L 750 L The heat pump was sized to fit 6 kw heat loss from the building. In order to obtain a simplified simulation setup, additional control was avoided by placing an electrical back-up at the evaporator side of the heat pump. The electrical back-up was controlled to keep the inlet temperature of receiver fluid above 15 C, which is the minimal operating temperature of the evaporator of the heat pump. The heat pump was modelled using a performance map model (TYPE927) in TRNSYS. This model includes evaporator and condenser thermal power together with the electrical work for compressor in a tabular format. In simulations, TRNSYS interpolates the heat pump data which was derived from a catalogue, and was extrapolated to fit the low temperature threshold of 15 C as seen in FIGURE 3. Q add = U sc A sc (T amb T sc,m ) (6) With Q TYPE1, the thermal output of the TYPE1 solar collector model, the total useful energy gain from the collector is Q sc,tot = Q TYPE1 + Q add. The U sc parameter was varied in the range of 2 10 W/m²K to investigate its effect on the performance of the heat pump system. PERFORMANCE INDICATORS Three performance indicators were defined to analyse the simulation results. First, the availability of the solar collector as the low temperature heat source was defined as follows: av = Q sc = Q sc (7) Q L,HP Q sc +E bu where FIGURE 2 shows the heat and electrical energy meter positions. It is a measure to assess the feasibility of solar collector as a low temperature heat source for the heat pump system. In addition to the availability, two other performance parameters were used. The heat pump Seasonal Performance Factor SPF1 was defined as the ratio between the condenser output to the required electrical energy from both compressor E HP and back-up heater E bu (Eq. 8). Additionally, an SPF2- factor was defined as the ratio between the heat delivered to the residence to the required electrical energy from both compressor and back-up heater (Eq. 9). The difference between Q H,HP and Q residence was the heat loss of the storage tank. SPF1 = Q H,HP E bu +E HP (8) SPF2 = Q residence E tot = Q residence E bu +E HP (9) SIMULATION RESULTS FIGURE 3: COEFFICIENT OF PERFORMANCE OF THE MODELLED HEAT PUMP The solar collector was modelled in TRNSYS using TYPE1 model. To integrate an augmented solar collector heat exchange with the surroundings, an additional heat exchange term was added to the model output. FIGURE 4: RESIDENCE MONTHLY HEATING ENERGY USE 6 Copyright 2015 by ASME

. U sc = 2 W/m²K was the base case with natural convection in TRNSYS TYPE1 simulation model. In other cases, heat transfer from the ambient to receiver fluid was enhanced.")

372 The residence had a yearly energy consumption of 36 kwh/m². FIGURE 4 shows the monthly energy use for heating. Because solar heat gains were not taken into account in the simplified TYPE12 building model, the results showed a very small heating load in June and September. The required total electrical energy E tot by the heat pump system (back-up + heat pump compressor energy) is shown in FIGURE 5 as a function of the global solar collector heat transfer coefficient U sc (in W/m²K). U sc = 2 W/m²K was the base case with natural convection in TRNSYS TYPE1 simulation model. In other cases, heat transfer from the ambient to receiver fluid was enhanced. These results clearly showed that considerable impact on the energy consumption of the system is expected. However, for U sc 6 W/m²K, the marginal energy reduction considerably decreased. FIGURE 6 shows the availability of the solar collector as low temperature heat source of the heat pump by relating the energy production of the solar collector to the total low temperature heat to the heat pump. A high value indicates that the solar collector was able to deliver large part of the energy required by the heat pump. In this case, solar collector required global heat loss coefficient of U sc = 8 W/m²K in order to achieve almost 100% coverage by the solar collector. However, only the yearly availability values present a correct view on the solar collector performance. For different U sc values, yearly availability was respectively 55%, 79%, 95%, 98% and 99%. From these results it was seen that solar collector with U sc = 6 W/m²K reached a very high availability factor. FIGURE 6: AVAILABILITY OF THE SOLAR COLLECTOR AS LOW TEMPERATURE HEAT SOURCE TO THE HEAT PUMP FIGURE 5: ELECTRICAL ENERGY USE FOR HEAT PUMP COMPRESSOR AND BACK-UP AS FUNCTION OF GLOBAL SOLAR COLLECTOR HEAT LOSS COEFFICIENT TABLE 4 provides details on the absolute values of electricity consumption by the heat pump system. It can be seen that E HP reduced for increasing U sc because the solar collector operates at higher temperature. It can also be seen that the back-up energy requirement decreases significantly because the solar collector can extract more energy from the ambient. These effects obviously impacted the heat pump seasonal performance factor SPF1 as shown by FIGURE 7. The solar collector was not able to perform well as low temperature heat source for the heat pump system without improving the heat transfer to the environment. For the different U sc values, yearly SPF1 was respectively 1.62, 2.28, 3.13, 3.59 and Using SPF = 3.5 as a limit for qualitative heat pump system, the U sc - value of the solar collector should be 8 or higher. TABLE 4: RESIDENCE THERMAL AND HEAT PUMP ELECTRICAL ENERGY USE AS FUNCTION OF U SC, WITH REDUCTION IN E TOTAL COMPARED TO U SC = 2 U sc Q residence E HP E bu E total reduction W/m²K kwh/a kwh/a kwh/a kwh/a % % % % % % FIGURE 7: HEAT PUMP SYSTEM SEASONAL PERFORMANCE FACTOR SPF1 7 Copyright 2015 by ASME


373 The SPF2 value, relating Q residence to the electrical energy use of the heat pump system incorporates the heat loss from storage tank. FIGURE 8 shows that during non-heating season, the storage tank heat loss had dramatic impact on the performance of the heat pump system. However, since the absolute values are small, the effect on the yearly SPF2 values is limited (1.54, 2.17, 2.98, 3.41, 3.65 for the considered U sc - values). Using the SPF2 performance parameter, only U sc = 10 W/m²K case performs above the threshold of 3.5. The results showed a significant influence of the solar collector area. For example, 12,5m² was not sufficient to reach an availability of 100% or SPF2-value of above 3.5. Results for 25m² and 37.5m² showed that an availability > 95% is achievable when U sc is 6 and 4 W/m²K, respectively. Larger SPF2 for larger U sc values was only caused by higher source temperature. For example, if SPF2 threshold is 3.5, U sc should have been 8 and 6 W/m²K, respectively. It should be noted that an energetically optimal collector area or U sc as function of collector area cannot be defined based on this analysis, although the curves indicate that this optimum exist. For collector areas considered, an optimum U sc value will be larger than 10. FIGURE 8: HEAT PUMP SYSTEM SEASONAL PERFORMANCE FACTOR SPF2 Parametric study by changing collector area and volume of the storage tank showed clear trends as seen in FIGURE 9 and FIGURE 10. It was observed that volume of the storage tank did not have a large influence (FIGURE 9). While SPF2 decreased for larger storage volumes because of larger heat losses, the availability was hardly affected (therefore FIGURE 10 only shows the 500L results). Based on this analysis, it was concluded that 250 L is the optimal storage volume for this system. FIGURE 10: AVAILABILITY AS A FUNCTION OF COLLECTOR AREA (STORAGE VOLUME OF 500 L) FIGURE 9: SEASONAL PERFORMANCE FACTOR SPF2 AS A FUNCTION OF COLLECTOR AREA AND STORAGE VOLUME 8 Copyright 2015 by ASME
Thermische zonnecollectoren en warmtepompen werken samen?
 Thermische zonnecollectoren en warmtepompen werken samen? Leen Goovaerts, Jan Verheyen, Dries Van Aken, John Veeken, Maarten Sourbron, KULeuven-Technologiecampus De Nayer, Faculteit Industriële Ingenieurswetenschappen,
Vaktechniek. Uittreksel van De Onderneming nr. 915 - November 2014. Inleiding
 Prestaties van een combinatie thermische zonnecollectoren en een warmtepomp Impact van regelstrategie en hydraulische aansluiting van doorslaggevend belang Door J. Veeken, J. Verheyen en M. Sourbron Dit
ROL VAN INSTALLATIETECHNIEKEN EN IMPACT OP UW ONTWERP. Dirk Saelens. Afdeling Bouwfysica, Departement Burgerlijke Bouwkunde, K.U.
 NAV STUDIENAMIDDAG MASSIEF PASSIEFBOUW IN DE PRAKTIJK: AANPAK VAN ONTWERP TOT REALISATIE NAAR EEN PASSIEVE WONING OP BASIS VAN TRADITIONELE BOUWMETHODES ROL VAN INSTALLATIETECHNIEKEN EN IMPACT OP UW ONTWERP
Inhoud. Hernieuwbare energie voor gebouwen 18/09/2012
 18/09/2012 Hernieuwbare energie voor gebouwen Meetcampagne op DX warmtepomp met verticale boringen Inhoud» VITO» met verticale boringen» DX warmtepomp» Beschrijving meetcampagne» Resultaten meetcampagne»»
Lieve Helsen(KULeuven) Jan Hoogmartens(KULeuven)
 Jan Hoogmartens(KULeuven)") IWT-WP-DIRECT Project: S-metingen op bestaande residentiële warmtepompinstallaties in Vlaanderen: vergelijking van verschillende installatieconcepten Projectleiders: Projectuitvoerders: Willy Van Passel
IWT-WP-DIRECT Project: S-metingen op bestaande residentiële warmtepompinstallaties in Vlaanderen: vergelijking van verschillende installatieconcepten Projectleiders: Projectuitvoerders: Willy Van Passel
Centrale stookplaatsen
 Centrale stookplaatsen Ludo Thijs Product Coördinator Heating TOP SECRET SECRET INTERNAL USE ONLY PUBLIC 2 Werking van warmtepomp Expansie ventiel Aangezogen buitenlucht Verdamper Condensor Watercircuit
Opleiding Duurzaam Gebouw:
 Opleiding Duurzaam Gebouw: Verwarming en sanitair warm water: ontwerp en regeling Leefmilieu Brussel Overzicht van de belangrijkste warmteopwekkers Jonathan FRONHOFFS CENERGIE Doelstelling(en) van de presentatie
DE WERKING VAN DE WARMTEPOMP
 De duurzame energiebron is onuitputtelijk, maar heeft een te laag temperatuurniveau om de CV rechtstreeks op aan te kunnen sluiten. De temperatuur zal dus eerst verhoogd moeten worden, waardoor wij onze
Publicaties. THERMAC-handboek. THERMAC-handboek. Inhoud. Handboek voor het verwarmen en natuurlijk koelen van THERMisch ACtieve gebouwen
 WTCB THERMAC-handboek THERMAC-handboek V-gids ODE-folders Syllabus studiedagen Rekenbladen met workshops Raf De Herdt Publicaties Handboek voor het verwarmen en natuurlijk koelen van THERMisch ACtieve
Echt nul op de meter. HRsolar : Robbert van Diemen Techneco : Niels van Alphen
 Echt nul op de meter HRsolar : Robbert van Diemen Techneco : Niels van Alphen Agenda Zonthermie V1.0 -> V3.0 Zonthermie V3.0 / warmtepompen Wie is HRsolar Nederlandse fabrikant van zonthermische oplossingen
Verwarmingsoplossingen in appartementsbouw
 Verwarmingsoplossingen in appartementsbouw Ludo Thijs Product Coördinator Heating All Seasons CLIMATE COMFORT Heating Air/air Heat Pumps Applied Systems Refrigeration TOP SECRET SECRET INTERNAL USE ONLY
IWT-WP-DIRECT: De impact van regelparameters op de prestatie van residentiële warmtepompinstallaties aan de hand van simulaties
 IWT-WP-DIRECT: De impact van regelparameters op de prestatie van residentiële warmtepompinstallaties aan de hand van simulaties Jan Hoogmartens (K.U.Leuven) Lieve Helsen (K.U.Leuven) Geeraart Franck (De
Overzicht. Inleiding Micro-WKK in woningen Technologieën Aandachtspunten Toekomstperspectieven Conclusies 15-11-2010
 Voor kwaliteitsvolle WarmteKrachtKoppeling in Vlaanderen WKK voor ruimteverwarming Toepassingen in de woningbouw Tine Stevens COGEN Vlaanderen Studiedag VIBE 12 november 2010 1 Overzicht Inleiding Micro-WKK
Verwarming en sanitair warm water
 1 Installatie-eisen bij renovatie Verwarming en sanitair warm water Inhoudstafel INHOUDSTAFEL... 1 INLEIDING... 2 1. TOEPASSING... 2 2. KETEL... 2 2.1 Energieverbruiksmeters... 3 3. WARMTEPOMP... 4 3.1
Casestudie: Geothermics, Lochristi
 Casestudie: Geothermics, Lochristi Auteurs: Jad Al Koussa, Koen Allaerts Datum: 16-02-2016 Deze studie werd uitgevoerd in het kader van het IWT-VIS traject Smart Geotherm (2011-2017) Geothermics-Lochristi
Warmtepompen & aardgasvrije nieuwbouw
 Warmtepompen & aardgasvrije nieuwbouw Door Willem Hooijkaas Voorzitter Nederlands Platform Warmtepompen Platform Warmtepompen Stuurgroep Stuurgroep Aandachtspunten presentatie: Duurzaam & Gasloos (bouwkundige)
echt Nul op de meter HRsolar : Robbert van Diemen Techneco : Niels van Alphen
 echt Nul op de meter HRsolar : Robbert van Diemen Techneco : Niels van Alphen Agenda Wie is HRsolar Zonnewarmte V1.0 De markt Zonnewarmte V2.0 Zonnewarmte NOM Wie is HRsolar Nederlandse fabrikant van complete
Probleemstelling. Probleemstelling. Probleemstelling. Richting zelfvoorzienende huizen? Stand der techniek voor energie-opslag in woningen
 Richting zelfvoorzienende huizen? Stand der techniek voor energie-opslag in woningen < E0? Nul-op-de-meter-woning? Energie-autark? CBBC Hernieuwbare Energie 19/10/17 Jeroen Van der Veken Labo HVAC WTCB
SPF-metingen op bestaande residentiële. Vlaanderen: vergelijking van verschillende. Jan Hoogmartens(KULeuven)
") IWT-WP-DIRECT WP Project: S-metingen op bestaande residentiële warmtepompinstallaties in Vlaanderen: vergelijking van verschillende installatieconcepten Projectleiders: Projectuitvoerders: Willy Van Passel
IWT-WP-DIRECT WP Project: S-metingen op bestaande residentiële warmtepompinstallaties in Vlaanderen: vergelijking van verschillende installatieconcepten Projectleiders: Projectuitvoerders: Willy Van Passel
Homelab 2050, serie 4: Optimaal gebruik van beschikbare energiebronnen
 Energie en exergie in de gebouwde omgeving Door Sabine Jansen (TU Delft) 7 April 2015 Homelab 2050, serie 4: Optimaal gebruik van beschikbare energiebronnen Exergie voor de gebouwde omgeving Statements
Warmtepompen en warmtebronnen. Warmtepompen
 Warmtepompen en warmtebronnen (augustus 2006) Warmtepompen Wat is een warmtepomp? Warmtepompen zijn duurzame energiesystemen die energie uit de omgeving, zoals buitenlucht, bodem of grondwater, omzetten
Installatie-eisen: Voorbeeld: verwarming en sanitair warm water
 1 1 Installatie-eisen: Voorbeeld: verwarming en sanitair warm water Inhoudstafel INHOUDSTAFEL... 1 1. ACHTERGROND... 2 2. KETEL... 2 2.1 Installatie-eisen... 2 2.2 Gegevens... 2 2.3 Formule installatierendement...
Cooling & Heating Innovations
 Cooling & Heating Innovations W A R M T E P O M P E N D e w a r m t e p o m p a l s w a r m t e b r o n i s d é o p l o s s i n g v o o r onze dagelijkse behoefte aan verwarming met een zo hoog mogelijk
Inventaris hernieuwbare energie in Vlaanderen 2016
 1 Beknopte samenvatting van de Inventaris hernieuwbare energiebronnen Vlaanderen 2005-2016, Vito, oktober 2017 1 Het aandeel hernieuwbare energie in 2016 bedraagt 6,4% Figuur 1 groene stroom uit bio-energie
Inventaris hernieuwbare energie in Vlaanderen 2014
 1 Beknopte samenvatting van de Inventaris hernieuwbare energiebronnen Vlaanderen 2005-2014, Vito, januari 2016 1 Het aandeel hernieuwbare energie in 2014 bedraagt 5,7 % Figuur 1 groene stroom uit bio-energie
Demoproject: De Wending, meetresultaten
 Demoproject: De Wending, meetresultaten Auteurs: K. Allaerts Datum: 20/01/2015 Deze studie werd uitgevoerd in het kader van het IWT-VIS traject Smart Geotherm (2011-2017) Eindverslag De Wending v2 1 1
Energieconcepten voor duurzame woningen met PV-T
 Facilitair Advies Bureau Troost Zesde Slagen 28 5233VJ 'S- Hertogenbosch Tel: 06 46 95 44 49 E. info@f-a-t.nl Energieconcepten voor duurzame woningen met PV-T U overweegt te investeren in een nieuwe verwarmingsinstallatie
Introductie. Ernst van Tongeren. Directeur Besseling Installatietechniek
 Introductie Ernst van Tongeren Directeur Besseling Installatietechniek Programma 1. Presentatie duurzame technieken (E. vantongeren) 2. Bouwkundige randvoorwaarden (H. Nieman) 3. Presentatie praktijkvoorbeeld
25/03/2013. Overzicht
 Micro-WKK: basisbegrippen en toepassingsmogelijkheden Tine Stevens, Vlaams Energieagentschap Regiovergadering Provincie West-Vlaanderen 12 en 14/03/2013 2 Warmte-krachtkoppeling (WKK) De gelijktijdige
Inhoud. Warmtepompen in EPB-software. Warmtepompplatform Symposium. EPB-software E-peil Warmtepomp E-peil. SPF in EPB EPB-voorbeeld Besluit
 Warmtepompen in EPB-sotware Warmtepompplatorm Symposium 16-09-2009 Jan Hoogmartens 1 Inhoud EPB-sotware E-peil Warmtepomp E-peil Omrekenactor primaire energie SPF warmtepompsystemen SPF in EPB EPB-voorbeeld
DE VLOEI: VAN DUURZAAM NAAR SLIM ENERGIECONCEPT
 Roel.DeConinck@3E.eu - Roel.DeConinck@mech.kuleuven.be ie-net Intelligente gebouwen voor intelligente steden 16/11/2012 DE VLOEI: VAN DUURZAAM NAAR SLIM ENERGIECONCEPT OVERZICHT Doelstelling studie Eerste
Naar de bron van de warmtepomp
 C on d e ns o r Ve r d am p e r Studienamiddag : Introductie tot alternatieve en duurzame energieopwekking voor KMO s Energik Voka Mechelen 7 juni 2007 Naar de bron van de warmtepomp H.Hoes 1 Naar de bron
M-Thermal warmtepompen
 M-Thermal warmtepompen Lucht/water warmtepompen De systemenen: M-Thermal Introductie Zonnecollectoren Lage temperatuur radiator M-Thermal Monobloc Monobloc unit Zonnecollector Toepassing Verwarmen, koelen,
Ruimteverwarming met warmtepompen:
 Ruimteverwarming met warmtepompen: principes en werking van verschillende warmtepompsystemen en toepassingen in woningbouw TRIAS ENERGETICA 2 1 Dus 1. Eerst goed isoleren en luchtdicht bouwen (de warmtebehoefte
DE MEEST EFFICIËNTE OPLOSSING OM TE GENIETEN VAN MAXIMAAL COMFORT
 DE MEEST EFFICIËNTE OPLOSSING OM TE GENIETEN VAN MAXIMAAL COMFORT VERWARMING, KOELING EN WARM WATER IN ÉÉN SYSTEEM DE RVL- l PLUS WARMTEPOMP VAN FERROLI IS ENERGIE VOOR DE TOEKOMST: Schoon Duurzaam Geen
AGENDA. Samenbrengen van kennis uit literatuur, experten en stakeholders. » Kader» Stappenplan
 AGENDA Samenbrengen van kennis uit literatuur, experten en stakeholders» Kader» Stappenplan» Inventaris warmtepompen» Hernieuwbare Energie Inventaris» Enkele karakteristieken van de technologieën» Potentieel
NIEUWE VISIE OP ZONREGELING
 NIEUWE VISIE OP ZONREGELING Zon en daglicht regeling als deel van de energieprestaties in gebouwen Peter Winters President of the European Solar Shading Organization Director Shading & Building Dickson
Hulpenergie in de EPW
 Module 3.5 Hulpenergie in de EPW Versie 2.0 1 Hoofdstukkenoverzicht EPW 8 Controle oververhitting 10.5 Verbruik voor koeling 7.7 Transmissieverliezen 7.8 Ventilatie verliezen 7.9 Interne winsten 7.10 Zonnewinsten
Voorstelling eindverslag
 Voorstelling eindverslag IWT-HOBU-project 00-02 05 12 februari 2003 Jan De Nayerlaan 5, 2860 Sint-Katelijne-Waver, Tel : +32 (0)15/31.69.44, Fax : +32 (0)15/31.74.53, Email : wvp@denayer.wenk.be Projectsamenvatting
Minder, anders en efficiënter
 De Zonne-arc vzw Energiezuinig anders De warmtepomp, de natuur als bron van verwarming. Willy Lievens, Z.O.T. (Zacht Onthechte Technoloog) N.U.L. (Niet Uitgebluste Leraar) Minder, anders en efficiënter
H e t W A d u s E P C p a k k e t
 Uw partner in duurzame energie H e t W A d u s E P C p a k k e t De ultieme oplossing voor uw woning v1.0 april 2009 Voorwoord WAdus BV is een jong en dynamisch bedrijf. Het bedrijf is opgericht in 2008
Hartelijk welkom. Referent. Workshop Verwarmen met een ijswaterbuffervat. Jef Smits Viessmann Akademie. Viessmann Werke. Titel des Vortrags
 Pagina 1 Hartelijk welkom Workshop Verwarmen met een ijswaterbuffervat Referent Jef Smits Viessmann Akademie Pagina 2 Vergeet na de les uw GSM niet terug in te schakelen AUB. Pagina 4 EPB-eisen : isoleren
Hulpenergie in de EPW
 VEA 1 Module 3.5 Hulpenergie in de EPW Versie 2.0 1 Hoofdstukkenoverzicht EPW 8 Controle oververhitting 10.5 Verbruik voor koeling 7.7 Transmissieverliezen 7.8 Ventilatie verliezen 7.9 Interne winsten
Warmtepompen : Wanneer wel of niet?
 Warmtepompen : Wanneer wel of niet? TRIAS ENERGETICA 2 Dus 1. Eerst goed isoleren en luchtdicht bouwen (de warmtebehoefte beperken) 2. Dan duurzame energietechnieken maximaal benutten 3. Als laatste fossiele
Workshop De praktijk: aandachtspunten bij de installatie van een hybride verwarmingsoplossing op mazout
 Workshop De praktijk: aandachtspunten bij de installatie van een hybride verwarmingsoplossing op mazout 26/02/2019 Jan Bral, Jan Bral Verwarming Airco & Sanitair 1 Wat is een hybride verwarmingsoplossing?
WEGWIJS IN WARMTEPOMPEN
 WEGWIJS IN WARMTEPOMPEN INSPIRATIEDAG GROENE WARMTE VVSG, BRUGGE 8 FEB 2018 PROF IR WIM BOYDENS CO-VOORZITTER WARMTEPOMPPLATFORM CSTO BOYDENS ENGINEERING, BESTUURDER STUDIEBUREAU BOYDENS GASTPROFESSOR
Inventaris hernieuwbare energie in Vlaanderen 2013
 1 Beknopte samenvatting van de Inventaris duurzame energie in Vlaanderen 2013, Deel I: hernieuwbare energie, Vito, september 2014 1 Het aandeel hernieuwbare energie in 2013 bedraagt 5,9% Figuur 1 bio-elektriciteit
Dirk Vanhoudt. Onderzoeker. VITO (Vlaamse Instelling voor Technologisch Onderzoek)
") Dirk Vanhoudt Onderzoeker VITO (Vlaamse Instelling voor Technologisch Onderzoek) De rol van groene warmtenetten in de renovatie van woningen Inhoudstafel 1. De Vlaamse huizenmarkt 2. De energieprestatieregelgeving
Dirk Vanhoudt Onderzoeker VITO (Vlaamse Instelling voor Technologisch Onderzoek) De rol van groene warmtenetten in de renovatie van woningen Inhoudstafel 1. De Vlaamse huizenmarkt 2. De energieprestatieregelgeving
Module 3.4. EPW: warm tapwater. Versie 2.0
 Module 3.4 EPW: warm tapwater Versie 2.0 1 Overzicht Algemeen Netto energiebehoefte voor warm tapwater Systeemrendement Tapleidingen Circulatieleidingen Opwekkingsrendement Invoer in het rekenprogramma
Zonthermie voor zeer energiezuinig bouwen en renoveren (Nul op de meter, energieneutraal, BENG, EPC- <0. Robbert van Diemen Beurs Energie 2015
 Zonthermie voor zeer energiezuinig bouwen en renoveren (Nul op de meter, energieneutraal, BENG, EPC-
DE EFFICIËNTE EN MILIEUVRIENDELIJKE OPLOSSING VOOR DE PRODUCTIE VAN SANITAIR WARM WATER
 EOS PLUS HP DE EFFICIËNTE EN MILIEUVRIENDELIJKE OPLOSSING VOOR DE PRODUCTIE VAN SANITAIR WARM WATER Lucht-water warmtepomp voor de productie van Sanitair Warm Water zonder gebruik van gas. Deze pomp, speciaal
http://techniline.sirris.be/s/p.exe/wservice=wo/webextra/prg/olarticleprint?vwebse...
 Page 1 of 5 Techniline v3 27-08-2010 Mechatronics Machines verbruiken minder energie door slimme keuze elektrische aandrijving (27-08-2010) Nr. 0 Ecologische en economische motieven, zoals nieuwe machinenormen
Inventaris hernieuwbare energie in Vlaanderen 2015
 1 Beknopte samenvatting van de Inventaris hernieuwbare energiebronnen Vlaanderen 2005-2015, Vito, september 2016 1 Het aandeel hernieuwbare energie in 2015 bedraagt 6,0 % Figuur 1 groene stroom uit bio-energie
Beheer en onderhoud in de praktijk. Warmtepompsystemen met verticale bodemwisselaar technieken. Peter Centen Nathan Group
 Beheer en onderhoud in de praktijk Warmtepompsystemen met verticale bodemwisselaar technieken Peter Centen Nathan Group 2 1 COLLECTIEF BRONSYSTEEM (WARMTEPOMP INDIVIDUEEL PER APPARTEMENT) VERTICALE BODEMWARMTE-
Warmte in de koudetechniek, een hot item
 Wijbenga info sheet 5: Warmte in de koudetechniek, een hot item In het ontwerp van een koelinstallatie wordt steeds meer aandacht besteed aan het energieverbruik. Dit kan bereikt worden door een zo hoog
energieprestatiecertificaat
 energieprestatiecertificaat straat Sint Lenaartseweg nummer 38C bus 01 bestemming appartement type - softwareversie 9.19.0 berekende energiescore (kwh/m²ar): 377 De energiescore laat toe om de heid van
Meestal is er geen bouwvergunning nodig om een zonne-installatie op een dak te plaatsen. Informeer altijd eerst bij uw gemeentebestuur.
 15 september 2018 Resultaat van uw opzoeking op www.energiesparen.be/zonnekaart De zonnekaart geeft een goede weergave van de zoninstraling op uw dak. De hoeveelheid zoninstraling is heel plaatsgebonden
Œrtli ŒCOSUN. Gecombineerde zonnesystemen
 Œrtli ŒCOSUN Gecombineerde zonnesystemen Zonneboilers voor de productie van sanitair warm water en de ondersteuning van verwarming ŒCOSUN Gegarand De zon is een onuitputtelijke energiebron die 1,4 kw/m
energieprestatiecertificaat
 energieprestatiecertificaat straat Walstraat nummer 40 bus 3 bestemming appartement type - softwareversie 9.19.8 berekende energiescore (kwh/m²ar): 81 De energiescore laat toe om de heid van appartementen
MINI-WKK Dimensionering en hydraulische inpassing. 27 januari 2017
 MINI-WKK Dimensionering en hydraulische inpassing 27 januari 2017 Inleiding Warmtekrachtkoppeling: potentieel Efficiënte energie-omzetting Energiekosten & primaire energie besparen Flexibele bedrijfsvoering
Toelichting Instrument 5. Onderdeel Toolbox voor energie in duurzame gebiedsontwikkeling
 Toelichting Instrument 5 Onderdeel Toolbox voor energie in duurzame gebiedsontwikkeling Instrument 5, Concepten voor energieneutrale wijken De gehanteerde definitie voor energieneutraal is als volgt: Een
ROTEX hybride gaswarmtepomp Een sterk duo.
 ROTEX hybride gaswarmtepomp Een sterk duo. De nieuwe ROTEX HPU hybrid hybride gaswarmtepomp selecteert altijd automatisch de meest voordelige verwarmingsmodus. "Lange tijd waren we ervan overtuigd dat
BELEIDSOPTIES NUL-ENERGIEWONING
 1 BELEIDSOPTIES NUL-ENERGIEWONING IN HET KADER VAN DE BELANGSTINGSAFTREK HEEFT DE FEDERALE REGERING EEN DEFINITIE GEPUBLICEERD OVER DE NULEREGIEWONING Bij nader toezien was dit een foutieve en zeer contraproductieve
Nederlands Platform Warmtepompen
 De nieuwe generatie combi-warmtepompen Oktober 2016 Energie Den Bosch 1 Kennismaken Techneco» oprichting 1995 (21 jaar), vestiging in Delft» ca. 3.500 duurzame projecten in Nederland» 30 medewerkers (verkoop,
Nulenergie in Brussel: perspectieven?
 Nulenergie in Brussel: perspectieven? Seminarie Duurzaam Gebouw 22 maart 2013 Ir. Ismaël Daoud Politiek adviseur, Duurzaam bouwen en Energie Kabinet d'evelyne Huytebroeck, Brussels Minister voor Leefmilieu,
Door Anna Gruber (FfE), Serafin von Roon (FfE) en Karin Wiesmeyer (FIW)
, Serafin von Roon (FfE) en Karin Wiesmeyer (FIW)") Energiebesparingspotentieel door isolatie Door Anna Gruber (FfE), Serafin von Roon (FfE) en Karin Wiesmeyer (FIW) Het is bekend dat de CO 2 uitstoot tegen 2020 fors naar omlaag moet. In Duitsland zijn
Energiebesparingspotentieel door isolatie Door Anna Gruber (FfE), Serafin von Roon (FfE) en Karin Wiesmeyer (FIW) Het is bekend dat de CO 2 uitstoot tegen 2020 fors naar omlaag moet. In Duitsland zijn
Lucht ARIANEXT NIEUW GAMMA WARMTEPOMPEN
 Lucht ARIANEXT NIEUW GAMMA WARMTEPOMPEN Persmap Januari 2014 ARIANEXT, EEN COMPLEET GAMMA WARMTEPOMPEN VOOR ENERGIEZUINIGE WONINGEN Chaffoteaux vergroot zijn gamma multi-energiesystemen voor de verwarming
bestaand gebouw met woonfunctie
 Energiezuinigheid van de gebouwschil energiezuinig niet energiezuinig gemiddelde U-waarde van de gebouwschil Energiezuinigheid van de verwarmingsinstallatie energiezuinig niet energiezuinig gemiddeld installatierendement
Inventaris hernieuwbare energie in Vlaanderen 2013
 1 Beknopte samenvatting van de Inventaris duurzame energie in Vlaanderen 2013, Deel I: hernieuwbare energie, Vito, februari 2015 1 1 Het aandeel hernieuwbare energie in 2013 bedraagt 5,8 % Figuur 1 zon-elektriciteit
PRO GAHP ROBUR GASABSORPTIEWARMTEPOMPEN
 PRO GAHP ROBUR GASABSORPTIEWARMTEPOMPEN ROBUR GASABSORPTIEWARMTEPOMPEN CoolingWays ontwikkelt en levert, in samenwerking met Robur, verwarmingssystemen die werken op aardgas. Hierdoor kunnen wij zeer hoge
Energietechieken voor Dummies
 Voor een rationeler energiegebruik VVSG Energiedag voor lokale besturen Energietechieken voor Dummies Joost Verschuere www.e-maze.be Congres centrum Zoo 26-okt-2011 About US E-Maze is een onafhankelijkingenieursbureau
BODEM GEKOPPELD HYBRIDE WARMTEPOMPSYSTEEM
 Koen Allaerts BODEM GEKOPPELD HYBRIDE WARMTEPOMPSYSTEEM 6/12/2013 1 Agenda Onderzoeksvraag Principe Aanpak Economisch optimum Dimensioneren drycooler Eerste resultaten Vervolg 2 Agenda Onderzoeksvraag
Warmtepompen besparen op energie, niet op comfort
 WARMTEPOMPTECHNIEK Warmtepompen besparen op energie, niet op comfort Voor verwarming en productie van sanitair warm water in nieuwbouw en renovatie Warmtepomptechniek in nieuwbouwprojecten Nieuw bouwen?
EPB in Vlaanderen en hoe te gebruiken als verkoopstool
 EPB in Vlaanderen en hoe te gebruiken als verkoopstool Inleiding EPB Wat Waarom Wanneer De 7 Eisen van EPB Huidige normen Normen 2016 E Peil als verkoopstool technieken 2 1 Wat EPB Energie Prestatie voor
PLAN VAN DE UITEENZETTING
 INADEQUE COMFORTVERHOGING VAN SANITAIR WARM WATER EN EEN LAGERE VERWARMINGSBEHOEFTE? Expert Day HVAC & Renovatie 15/06/2017 Ivan Piette Product Manager Viessmann Belgium 14/06/2017 1 PLAN VAN DE UITEENZETTING
energieprestatiecertificaat
 energieprestatiecertificaat straat Residentie Beatrijs nummer 61 bus bestemming appartement type - softwareversie 9.19.0 berekende energiescore (kwh/m²ar): 228 De energiescore laat toe om de heid van appartementen
Hernieuwbaar energie-aandeel in Vlaamse nieuwbouwprojecten Ontdek de zonnestroomoplossingen van SMA
 Hernieuwbaar energie-aandeel in Vlaamse nieuwbouwprojecten Ontdek de zonnestroomoplossingen van SMA Verplicht aandeel hernieuwbare energie in nieuwbouw Vanaf 1 januari 2014 moet elke nieuwe woning, kantoor
REG in gebouwen: Installaties met warmtepompen : een overzicht
 REG in gebouwen: Installaties met warmtepompen : een overzicht Willy Van Passel, Raf De Herdt IDEG - De Nayer Instituut Wat is er nodig? Residentieel : Verwarmen van een gebouw 10 000 20 000 kwh Productie
Project: CO 2 -neutrale nulenergiewoning, Merelbeke. CO 2 -neutraal Nulenergie. Bio-ecologisch
 CO 2 -neutraal Nulenergie Bio-ecologisch Pieter VERSTRAETE Architect & energiedeskundige - Zaakvoerder NEO-architectuur - Projectverantwoordelijke DuBo, MilieuAdviesWinkel E info@neo-architectuur.be W
Provinciaal Proefcentrum voor de Groenteteelt, Kruishoutem
 Mogelijke innovaties tot energiebesparing in de Vlaamse glastuinbouw Evert Eriksson 23 oktober, PCS Destelbergen Provinciaal Proefcentrum voor de Groenteteelt, Kruishoutem Overzicht 1. Situatie glastuinbouw
Regeling van grondgekoppelde warmtepompsystemen in kantoorgebouwen. C. Verhelst, L. Helsen KULeuven, Toegepaste Mechanica en Energieconversie
 egeling van grondgekoppelde warmtepompsystemen in kantoorgebouwen C. Verhelst, L. Helsen KULeuven, Toegepaste Mechanica en Energieconversie Inhoudstafel Situering Grondgekoppelde warmtepompsystemen Huidige
Aandeel van SWW in het totale energieverbruik
 Aandeel van SWW in het totale energieverbruik Recente onderzoeksresultaten bij centrale stookplaatsen Bart Bleys Labo Watertechnieken WTCB Slide 1 Inhoud Inleiding TETRA SWW Instal 2020 Slide 2 Belang
Kennissessie: CO 2 neutraal het echte verhaal
 Ing. Vincent Keppel Accountmanager Vabi Kennissessie: CO 2 neutraal het echte verhaal TIP: Houd pen en papier bij de hand!!!! Ir. Roy Zold Directeur PVM welke data & welk doel Vraagstelling corporaties
energieprestatiecertificaat
 energieprestatiecertificaat straat Ooievaarslaan nummer 2 bus 0201 bestemming appartement type - softwareversie 9.19.8 berekende energiescore (kwh/m²jaar): 147 De energiescore laat toe om de heid van appartementen
IWT TETRA-PROJECT NANOGRIDS IN DE PRAKTIJK. Startvergadering 25/03/2013 15u Geel
 IWT TETRA-PROJECT NANOGRIDS IN DE PRAKTIJK Startvergadering 25/03/2013 15u Geel Eestermans Bart Lector - Onderzoeker Thomas More Kempen Kenniscentrum Energie 1 Smart Grid Microgrid Nanogrid WHAT'S IN A
Voorwaarden aansluiting appartementen en woningen op WKO bron DSKII
 Voorwaarden aansluiting appartementen en woningen op WKO bron DSKII Stichting Spaarnesant 04 februari 2014 9X3803 Entrada 301 Postbus 94241 1090 GE Amsterdam +31 20 569 77 00 Telefoon 020-5697701 Fax info@amsterdam.royalhaskoning.com
energieprestatiecertificaat
 energieprestatiecertificaat bestaand gebouw met woonfunctie straat Boomsesteenweg_WI nummer 397 bus 4 bestemming appartement type - softwareversie 9.18.0 berekende energiescore (kwh/m²ar): 316 De energiescore
Is uw gemeente mee met groene warmte? 9 februari 2018 KU Leuven Brugge. Ben Segers Francies Van Gijzeghem
 Is uw gemeente mee met groene warmte? 9 februari 2018 KU Leuven Brugge Ben Segers Francies Van Gijzeghem 1 Inhoud Intro ODE en BE-p Wat is biomassa? Hele kleine installaties Medium schaal Grote schaal
Grip op je energieprestaties -wat doet de NZEB-tool?
 Grip op je energieprestaties -wat doet de NZEB-tool? Masterclass door Clarence Rose, DNA in de Bouw / Azimut Bouwbureau en Carl-peter Goossen, DNA in de Bouw / BouwNext 2 Masterclass Introductie NZEB-tool
23 september 2011, Easy Fairs HVAC 2011 WARMTEPOMPEN IN OPMARS
 23 september 2011, Easy Fairs HVAC 2011 WARMTEPOMPEN IN OPMARS Inhoud E-problematiek en EPB Belang van de warmtepomp WP versus andere systemen Premies Wat brengt de toekomst Energieproblematiek Fossiele
energieprestatiecertificaat
 energieprestatiecertificaat straat Collegelaan nummer 8 bus BU14 bestemming appartement type - softwareversie 9.16.9 berekende energiescore (kwh/m²ar): 92 De energiescore laat toe om de heid van appartementen
Omschakelen naar lage temperatuurverwarming
 15/06/2017 Omschakelen naar lage temperatuurverwarming Ivan Verhaert Inleiding (Ver)Bouwdilemma s Bron figuren: Izen, Remeha, interieurdesign, Thercon 2 1 Lage temperatuur verwarming (Hoge temperatuur
energieprestatiecertificaat
 energieprestatiecertificaat straat Jeneverbeslaan nummer 21 bus bestemming type eengezinswoning open bebouwing softwareversie 9.19.0 berekende energiescore (kwh/m²jaar): 1906 De energiescore laat toe om
Duurzame systemen. Comfortabel genieten, maximale energiebesparing. Het goede gevoel, het juiste te doen
 Duurzame systemen Comfortabel genieten, maximale energiebesparing 01-09 - 2016 Het goede gevoel, het juiste te doen. Onbezorgde luxe, duurzaam leven! Energiezuinig dankzij bodem-, lucht- en zonnewarmte
Wat moet de CV installateur met PV PV heeft de toekomst. Door: Richard Ogink
 Wat moet de CV installateur met PV PV heeft de toekomst Door: Richard Ogink Wat moet de CV installateur met PV Indeling presentatie 1. Zon als duurzame energiebron 2. Wetgeving 3. PV in de praktijk 4.
TECHNISCH FORUM. EPB kopzorgen van installateur. Hoe antwoord te bieden? Henderyckx Tom W15
 TECHNISCH FORUM EPB kopzorgen van installateur. Hoe antwoord te bieden? Henderyckx Tom W15 Overzicht Inhoud - Overzicht eisen als achtergrond - EPB startverklaring wat nodig van installateur / aannemer?
Meer wooncomfort. en minder energieverbruik door een warmtepomp. voltalimburg.nl/warmtepomp
 Meer wooncomfort en minder energieverbruik door een warmtepomp voltalimburg.nl/warmtepomp Tip! Vraag subsidie aan bij de aanschaf van een warmtepomp. Het subsidiebedrag voor een warmtepomp van 5 kw is