In de strijd tegen de krapte op de arbeidsmarkt! JEROEN VAN DEN BERG YVES PILET
|
|
|
- Christiaan de Koning
- 5 jaren geleden
- Aantal bezoeken:
Transcriptie

1 In de strijd tegen de krapte op de arbeidsmarkt! JEROEN VAN DEN BERG YVES PILET
2

3 Transparantie van de arbeidsmarkt Arbeidsmarktadviseur bij UWV Arbeidsmarktvraagstukken dr. Jeroen van den Berg Als arbeidsmarktadviseur voor de regio s Noord-Limburg en Midden- Limburg voorziet Jeroen beleidsmakers, onderwijsinstellingen, ondernemers en recruiters van data en advies over de ontwikkelingen op de arbeidsmarkt. Met zijn econometrische achtergrond is Jeroen hoofdverantwoordelijke voor de methodische ontwikkeling van arbeidsmarktindicatoren. Daarnaast is hij trainer bij de academie van UWV. Methoden en onderzoek Opleiden en ontwikkelen
4 Banen in Limburg 2018 zorg en welzijn ov. zak. dienst. industrie Ruim banen detailhandel horeca onderwijs Zorg en welzijn het grootst openbaar bestuur groothandel vervoer Ook industrie en detailhandel zijn groot spec. zak. diensten ov. diensten bouwnijverheid landbouw Uitzendwezen speelt belangrijke rol fin. diensten ICT Bron: UWV
5 Van banenkrimp ,0 4,0 2,0 0,0-2,0-4,0-6,0 ov.zak.dienst. horeca detailhandel ov. diensten vervoer spec. zak. diensten industrie ICT onderwijs openbaar best. landbouw zorg en welzijn groothandel fin. diensten bouwnijverheid Totaal Limburg Bron: UWV
6 naar banengroei ,0 4,0 2,0 0,0-2,0-4,0-6,0 ov.zak.dienst. ICT bouwnijverheid groothandel spec.zak.dienst. landbouw vervoer horeca ov. diensten detailhandel industrie zorg en welzijn onderwijs openbaar best. fin. diensten Totaal Limburg Bron: UWV
7 Vraag op de arbeidsmarkt neemt toe Nederland vacatures in 2017 ontstaan in 2013 (+69%) - Bijna evenveel als absolute top in Gemiddeld openstaande vacatures Limburg vacatures in 2017 ontstaan - Gemiddeld openstaande vacatures
8 Beschikbare aanbod neemt af April 2016: WW-uitkeringen Limburg April 2018: Limburg: -37% Nederland: -32% j f m a m j j a s o n d j f m a m j j a s o n d j f m a Bron: UWV
9 Spanning op de arbeidsmarkt neemt toe 2,5 2,0 Krap 1,5 1,0 Gemiddeld 0,5 0,0 Ruim Zeer ruim Q1 Q2 Q3 Q4 Q1 Q2 Q3 Q4 Q1 Q2 Q3 Q4 Q1 Q2 Q3 Q4 Q1 Q2 Q3 Q4 Q1 Q2 Q3 Q4 Q1 Q2 Q3 Q4 Q1 Q2 Q3 Q4 Q1 Q2 Q3 Q4 Q1 Q2 Q3 Q4 Q1 Q2 Q3 Q4 Q1 Q2 Q3 Q4 Q1 Q2 Q3 Q4 Q1 Q2 Q3 Q4 Q1 Q2 Q3 Q Spanningsindicator Nederland Spanningsindicator Limburg Bron: UWV
10 Niet alle beroepen even krap in Limburg Beroepsklasse Spanning Typering ICT beroepen 3,24 krap Technische beroepen 2,41 krap Dienstverlenende beroepen 2,05 krap Transport en logistiek beroepen 1,52 krap Openbaar bestuur, veiligheid en juridische beroepen 1,50 krap Commerciele beroepen 1,44 gemiddeld Bedrijfseconomische en administratieve beroepen 1,28 gemiddeld Zorg en welzijn beroepen 1,21 gemiddeld Managers 0,95 gemiddeld Agrarische beroepen 0,77 gemiddeld Creatieve en taalkundige beroepen 0,47 ruim Pedagogische beroepen 0,41 ruim

11 Meest voorkomende ICT vacatures 5% meer ICT vacatures in 2017

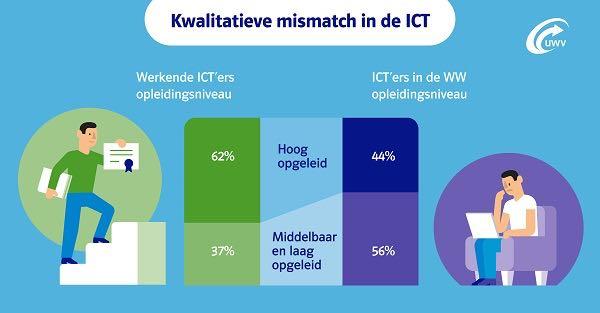
12 Kwalitatieve mismatch in de ICT
13 Structureel tekort? Aandeel werkgevers dat productiebelemmering ervaart door personeelstekort 50,0 40,0 Potentiële oplossingen Omscholing werkzoekenden 30,0 MBO-starters inzetten 20,0 10,0 ICT ers buiten Nederland werven 0,0 ICT-werkgeversschap versterken Q1 Q2 Q3 Q4 Q1 Q2 Q3 Q4 Q1 Q2 Q3 Q4 Q1 Q Bron: CBS Totaal IT-dienstverlening


14 Banengroei in de zorg zet door Zorg: 1,1 miljoen banen in 2018
15 Krapte in de zorg neemt toe Spanning op de arbeidsmarkt naar beroep Situatie in het derde kwartaal; Gespecialiseerd verpleegkundige (hbo) krap zeer krap Verpleegkundige (mbo) krap zeer krap Verzorgende ig krap zeer krap Woonbegeleider gezinsvervangend tehuis/wooncentrum gemiddeld krap Helpende ruim gemiddeld Zorghulp ruim gemiddeld
16 Vergrijzing zorgt voor extra uitbreidingsvraag én vervangingsvraag Uitbreidingsvraag - Meer vraag naar zorg leidt tot banengroei Vervangingsvraag Aandeel 55-plussers Werknemers ROA: - Gemiddeld 1,3% groei vraag naar arbeidskrachten per jaar in Limburg VVT ziekenhuizen 14% 11% 22% 27% banen erbij tot 2022 GHZ 9% 20% GGZ 13% 24% huisartsen 10% 21% overig 11% 19% 0% 5% 10% 15% 20% 25% 30% Bron: AZW info
17 Werkgevers zijn aan zet
18 In de strijd tegen de krapte op de arbeidsmarkt! JEROEN VAN DEN BERG YVES PILET
19 Aandacht Aandacht voor medewerkers Loyaliteit van medewerkers Loyaliteit van klanten Financiële prestatie

20 Trots Ontwikkelen van vaardigheden


21 Transparantie van de arbeidsmarkt Arbeidsmarktadviseur bij UWV In de laatste 15 jaar heeft Yves gewerkt op het snijvlak van employer brand Employer branding Arbeidsmarktvraagstukken management, arbeidsmarktvraagstukken en online data toepassingen. Yves Pilet MBM MSc Hij heeft onderzoek gedaan naar en advies gegeven over de kracht achter employer brands en dit vastgelegd in de methodiek Blue Print. Bij UWV heeft hij onder meer de taak om employer branding voor werkgevers inzichtelijk te maken. Online data toepassingen


22 Groeiende demografische druk Relatief minder kinderen... 62% Mensen leven langer, dankzij de vooruitgang in de gezondheidszorg en tegelijkertijd kiezen ze voor minder kinderen. In 1960 was een mondiaal gemiddelde van ongeveer vijf kinderen en een levensverwachting van 45 jaar de standaard. Tegenwoordig hebben we gemiddeld 2 kinderen per gezin en een levensverwachting van 75 jaar. - Bron: Wereld Bank en meer ouderen in de samenleving.

23 TECH


24 Technologische ontwikkelingen Door technologische ontwikkelingen verdwijnen banen op de arbeidsmarkt, maar er komen ook nieuwe banen bij. De rol van technologie is van invloed op ons dagelijks werk en vraagt om nieuwe vaardigheden van medewerkers en werkgevers. In beide gevallen draait het om snel kunnen omgaan met veranderingen. Automatisering, digitalisering, robotisering 3D printing, wearable tech, block chain technology Virtual reality, Artificial Intelligence, Internet of Things


25 Generaties op de werkvloer Baby Boomers Generatie X Generatie Y Generatie Z Geboren in 1946 t/m 1964 Geboren in 1965 t/m 1980 Geboren in 1981 t/m 1995 Geboren in 1996 t/m 2010 Persoonlijke groei als doel Handhaven van de status quo Ambtsperiode: 15+ jaar Wil directe waardering voor vaardigheden Omarmen risico en voorkeur voor ZZP Ambtsperiode: 5+ jaar Werken op eigen voorwaarden Verbonden aan een idee of doel Ambtsperiode: 1,5 2 jaar Voorkeur voor online interactie Past zich snel aan aan nieuwe technologie Angstbeeld: baan past niet bij karakter 14% van de bevolking 32% van de bevolking 17% van de bevolking 15% van de bevolking

26 TECH & GENERATIES

27 War for employees Employer branding K R A P T E


28


29 Stappenplan Wie ben je? Communiceer Meten is weten
30 Stap 1: Wie ben je? STAP 1/3

31 Werkgever: omschrijf je bedrijfscultuur, niet alleen je vacature Kern EVP Positioning statement Waarden
32 Menselijke drijfveren Ambitieus Ruim van opvatting Bekwaam Vrolijk Schoon Moedig Vergevingsgezind Hulpvaardig Eerlijk Fantasierijk Onafhankelijk Intellectueel Logisch Liefdevol Gehoorzaam Beschaafd Verantwoordelijk Zelfbeheersend
33 Menselijke drijfveren: ICT? Ambitieus Ruim van opvatting Bekwaam Vrolijk Schoon Moedig Vergevingsgezind Hulpvaardig Eerlijk Fantasierijk Onafhankelijk Intellectueel Logisch Liefdevol Gehoorzaam Beschaafd Verantwoordelijk Zelfbeheersend

34 Menselijke drijfveren: Zorg? Ambitieus Ruim van opvatting Bekwaam Vrolijk Schoon Moedig Vergevingsgezind Hulpvaardig Eerlijk Fantasierijk Onafhankelijk Intellectueel Logisch Liefdevol Gehoorzaam Beschaafd Verantwoordelijk Zelfbeheersend

35 Stappenplan Wie past bij wie? Communiceer Meten is weten
36 Een meest voorkomende ICT vacature Functie eisen: 1. Programmeren in.net Praten met de business 6. Plannen In bezit van rijbewijs b

37 Een meest voorkomende ICT vacature Plannen 4 Leerbaar In bezit van rijbewijs b 9 NIET CRUCIAAL 7 AFHANKELIJK VAN LEERBAARHEID CRUCIAAL Praten met de business 3 Leiderschapskwaliteiten 2 1 Programmeren in.net Ambitieus Bron: SEO, UWV Kerntaak


38 Think online first Opbouwen van bewustzijn bij doelgroepen vraagt om beïnvloeden van de beeldvorming. Tegenwoordig is inzet van online media daarbij onmisbaar. Waar social media en online video voorheen een nice-to-have waren, zijn ze momenteel een need-to-have. Visueel, interactief en continue voort de boventoon.
39 Stap 2: Communiceer Zo moet het niet Zo moet het wel Wij zijn marktleider in onze sector Wij geven jou verantwoordelijkheid in jouw baan Wij betalen een marktconform salaris Wij zijn benieuwd naar jouw doelen en wensen Wij hebben de beste trainingen Wij helpen jou om jouw persoonlijke doelen te bereiken
40 So, tell me what s in it for me? STAP 2/3
41 Baas boven baas Communicatie is belangrijk, maar gedrag is cruciaal Marketing en communicatie Interne communicatie Gedrag Werkervaring
42 Stappenplan Wie past bij wie? Communiceer Meten is weten
43 Stap 3: Meten is weten 1. Ga het gesprek aan! 2. Waarom zijn mijn waardevolle medewerkers vertrokken?
44 Stappenplan Wie ben je? Communiceer Meten is weten


45 Van vast naar vloeibaar Het belang van employer branding wordt de komende jaren alleen maar groter, want de arbeidsmarkt wordt transparanter en flexibeler. Technologische ontwikkelingen zorgen ervoor dat routinematige taken worden geautomatiseerd en de complexere taken die overblijven zullen worden uitgevoerd door specialisten. Deze agenten zullen alleen maar gaan werken met de bedrijven in hun ecosysteem die passen bij hun voorkeur. Andere mindset van werkgevers noodzakelijk
46 Aandacht Aandacht voor medewerkers Loyaliteit van medewerkers Loyaliteit van klanten Financiële prestatie
47 In de strijd tegen de krapte op de arbeidsmarkt! JEROEN VAN DEN BERG YVES PILET
De maakindustrie in Midden-Limburg
 De maakindustrie in Midden-Limburg Hoe om te gaan met een krapper wordende arbeidsmarkt Jeroen van den Berg (UWV) Thorn, juni 2018 De maakindustrie in Midden-Limburg 2 Planning De arbeidsmarkt in Limburg
Kansen & knelpunten op de arbeidsmarkt. Marieke Schramm & Michel van Smoorenburg Arbeidsmarktinformatie en -advies UWV Zwolle, 13 november 2017
 Kansen & knelpunten op de arbeidsmarkt Marieke Schramm & Michel van Smoorenburg Arbeidsmarktinformatie en -advies UWV Zwolle, 13 november 2017 Over arbeidsmarktinformatie en -advies 35 arbeidsmarktregio
Arbeidsmarkt Drenthe. Uitdagingen voor werkgevers. Erik Oosterveld Arbeidsmarktadviseur. 8 november 2018
 Arbeidsmarkt Drenthe Uitdagingen voor werkgevers Erik Oosterveld Arbeidsmarktadviseur 8 november 2018 Hoe staat de Drentse arbeidsmarkt ervoor? 3 Rode draad arbeidsmarkt 4 Wat betekent dat voor de arbeidsmarktregio
De arbeidsmarkt in Midden-Limburg
 De arbeidsmarkt in Midden-Limburg Hoe om te gaan met een krapper wordende arbeidsmarkt Jeroen van den Berg (UWV) Herten, november 2017 Planning UWV Arbeidsmarktprognose 2017-2018 Wat betekent dit voor
Regionale Maandcijfers Arbeidsmarktinformatie Noord-Limburg
 14-5-2019 15:33:25 Regionale Maandcijfers Arbeidsmarktinformatie Noord-Limburg Tabel 1: Stand WW-uitkeringen Stand WW mutatie tov vorige mnd mutatie tov vorig jaar Apr 2019 % Mrt 2019 % Apr 2018 % Nederland
Regionale Maandcijfers Arbeidsmarktinformatie Zuid-Holland Centraal
 15-5-2019 09:35:48 Regionale Maandcijfers Arbeidsmarktinformatie Zuid-Holland Centraal Tabel 1: Stand WW-uitkeringen Stand WW mutatie tov vorige mnd mutatie tov vorig jaar Apr 2019 % Mrt 2019 % Apr 2018
Regionale Maandcijfers Arbeidsmarktinformatie Groot Amsterdam
 14-5-2019 14:10:31 Regionale Maandcijfers Arbeidsmarktinformatie Groot Amsterdam Tabel 1: Stand WW-uitkeringen Stand WW mutatie tov vorige mnd mutatie tov vorig jaar Apr 2019 % Mrt 2019 % Apr 2018 % Nederland
Regionale Maandcijfers Arbeidsmarktinformatie Rijk van Nijmegen
 14-5-2019 17:43:18 Regionale Maandcijfers Arbeidsmarktinformatie Rijk van Nijmegen Tabel 1: Stand WW-uitkeringen Stand WW mutatie tov vorige mnd mutatie tov vorig jaar Apr 2019 % Mrt 2019 % Apr 2018 %
Regionale Maandcijfers Arbeidsmarktinformatie Amersfoort
 15-5-2019 09:28:24 Regionale Maandcijfers Arbeidsmarktinformatie Amersfoort Tabel 1: Stand WW-uitkeringen Stand WW mutatie tov vorige mnd mutatie tov vorig jaar Apr 2019 % Mrt 2019 % Apr 2018 % Nederland
Regionale Maandcijfers Arbeidsmarktinformatie Haaglanden
 15-5-2019 09:41:10 Regionale Maandcijfers Arbeidsmarktinformatie Haaglanden Tabel 1: Stand WW-uitkeringen Stand WW mutatie tov vorige mnd mutatie tov vorig jaar Apr 2019 % Mrt 2019 % Apr 2018 % Nederland
Regionale Maandcijfers Arbeidsmarktinformatie Gorinchem
 15-5-2019 09:43:40 Regionale Maandcijfers Arbeidsmarktinformatie Gorinchem Tabel 1: Stand WW-uitkeringen Stand WW mutatie tov vorige mnd mutatie tov vorig jaar Apr 2019 % Mrt 2019 % Apr 2018 % Nederland
Regionale Maandcijfers Arbeidsmarktinformatie Drenthe
 15-5-2019 08:36:43 Regionale Maandcijfers Arbeidsmarktinformatie Drenthe Tabel 1: Stand WW-uitkeringen Stand WW mutatie tov vorige mnd mutatie tov vorig jaar Apr 2019 % Mrt 2019 % Apr 2018 % Nederland
Regionale Maandcijfers Arbeidsmarktinformatie Midden-Limburg
 14-5-2019 15:35:46 Regionale Maandcijfers Arbeidsmarktinformatie Midden-Limburg Tabel 1: Stand WW-uitkeringen Stand WW mutatie tov vorige mnd mutatie tov vorig jaar Apr 2019 % Mrt 2019 % Apr 2018 % Nederland
Regionale Maandcijfers Arbeidsmarktinformatie Gooi en Vechtstreek
 15-5-2019 09:19:53 Regionale Maandcijfers Arbeidsmarktinformatie Gooi en Vechtstreek Tabel 1: Stand WW-uitkeringen Stand WW mutatie tov vorige mnd mutatie tov vorig jaar Apr 2019 % Mrt 2019 % Apr 2018
Regionale Maandcijfers Arbeidsmarktinformatie Midden-Holland
 15-5-2019 09:39:38 Regionale Maandcijfers Arbeidsmarktinformatie Midden-Holland Tabel 1: Stand WW-uitkeringen Stand WW mutatie tov vorige mnd mutatie tov vorig jaar Apr 2019 % Mrt 2019 % Apr 2018 % Nederland
Regionale Maandcijfers Arbeidsmarktinformatie FoodValley
 14-5-2019 14:40:01 Regionale Maandcijfers Arbeidsmarktinformatie FoodValley Tabel 1: Stand WW-uitkeringen Stand WW mutatie tov vorige mnd mutatie tov vorig jaar Apr 2019 % Mrt 2019 % Apr 2018 % Nederland
Regionale Maandcijfers Arbeidsmarktinformatie Holland Rijnland
 15-5-2019 09:37:23 Regionale Maandcijfers Arbeidsmarktinformatie Holland Rijnland Tabel 1: Stand WW-uitkeringen Stand WW mutatie tov vorige mnd mutatie tov vorig jaar Apr 2019 % Mrt 2019 % Apr 2018 % Nederland
Regionale Maandcijfers Arbeidsmarktinformatie Noord-Limburg
 Regionale Maandcijfers Arbeidsmarktinformatie Noord-Limburg Tabel 1: Stand WW-uitkeringen Stand WW mutatie tov vorige mnd mutatie tov vorig jaar Nov 2017 % aantal % aantal % Nederland 336.902 3,8% -6.194-1,8%
Regionale maandcijfers Arbeidsmarktinformatie Noord-Limburg
 Regionale maandcijfers Arbeidsmarktinformatie Noord-Limburg Tabel 1 Stand WW-uitkeringen Stand WW mutatie tov vorige mnd mutatie tov vorig jaar aug 2017 % aantal % aantal % Nederland 362.132 4,1% -2.290-0,6%
Regionale Maandcijfers Arbeidsmarktinformatie Flevoland
 14-5-2019 14:18:43 Regionale Maandcijfers Arbeidsmarktinformatie Flevoland Tabel 1: Stand WW-uitkeringen Stand WW mutatie tov vorige mnd mutatie tov vorig jaar Apr 2019 % Mrt 2019 % Apr 2018 % Nederland
Regionale Maandcijfers Arbeidsmarktinformatie Noord-Limburg
 Regionale Maandcijfers Arbeidsmarktinformatie Noord-Limburg Tabel 1: Stand WW-uitkeringen Stand WW mutatie tov vorige mnd mutatie tov vorig jaar Sep 2017 % aantal % aantal % Nederland 350.810 3,9% -11.322-3,1%
Regionale Maandcijfers Arbeidsmarktinformatie Rijk van Nijmegen
 Regionale Maandcijfers Arbeidsmarktinformatie Rijk van Nijmegen Tabel 1: Stand WW-uitkeringen Stand WW mutatie tov vorige mnd mutatie tov vorig jaar Nov 2017 % aantal % aantal % Nederland 336.902 3,8%
Regionale maandcijfers Arbeidsmarktinformatie Rijk van Nijmegen
 Regionale maandcijfers Arbeidsmarktinformatie Rijk van Nijmegen Tabel 1 Stand WW-uitkeringen Stand WW mutatie tov vorige mnd mutatie tov vorig jaar aug 2017 % aantal % aantal % Nederland 362.132 4,1% -2.290-0,6%
Regionale Maandcijfers Arbeidsmarktinformatie Rijk van Nijmegen
 Regionale Maandcijfers Arbeidsmarktinformatie Rijk van Nijmegen Tabel 1: Stand WW-uitkeringen Stand WW mutatie tov vorige mnd mutatie tov vorig jaar Sep 2017 % aantal % aantal % Nederland 350.810 3,9%
Regionale Maandcijfers Arbeidsmarktinformatie Groningen
 15-5-2019 08:32:54 Regionale Maandcijfers Arbeidsmarktinformatie Groningen Tabel 1: Stand WW-uitkeringen Stand WW mutatie tov vorige mnd mutatie tov vorig jaar Apr 2019 % Mrt 2019 % Apr 2018 % Nederland
Regionale Maandcijfers Arbeidsmarktinformatie Achterhoek
 14-5-2019 14:16:34 Regionale Maandcijfers Arbeidsmarktinformatie Achterhoek Tabel 1: Stand WW-uitkeringen Stand WW mutatie tov vorige mnd mutatie tov vorig jaar Apr 2019 % Mrt 2019 % Apr 2018 % Nederland
Regionale Maandcijfers Arbeidsmarktinformatie. Zuid-Kennemerland en IJmond
 14-5-2019 14:14:52 Regionale Maandcijfers Arbeidsmarktinformatie Zuid-Kennemerland en IJmond Tabel 1: Stand WW-uitkeringen Stand WW mutatie tov vorige mnd mutatie tov vorig jaar Apr 2019 % Mrt 2019 % Apr
Regionale Maandcijfers Arbeidsmarktinformatie Flevoland
 Regionale Maandcijfers Arbeidsmarktinformatie Flevoland Tabel 1: Stand WW-uitkeringen Stand WW mutatie tov vorige mnd mutatie tov vorig jaar Nov 2017 % aantal % aantal % Nederland 336.902 3,8% -6.194-1,8%
Regionale maandcijfers Arbeidsmarktinformatie Flevoland
 Regionale maandcijfers Arbeidsmarktinformatie Flevoland Tabel 1 Stand WW-uitkeringen Stand WW mutatie tov vorige mnd mutatie tov vorig jaar aug 2017 % aantal % aantal % Nederland 362.132 4,1% -2.290-0,6%
Regionale Maandcijfers Arbeidsmarktinformatie Midden-Gelderland
 14-5-2019 17:41:00 Regionale Maandcijfers Arbeidsmarktinformatie Midden-Gelderland Tabel 1: Stand WW-uitkeringen Stand WW mutatie tov vorige mnd mutatie tov vorig jaar Apr 2019 % Mrt 2019 % Apr 2018 %
Regionale Maandcijfers Arbeidsmarktinformatie Helmond-De Peel
 14-5-2019 15:31:13 Regionale Maandcijfers Arbeidsmarktinformatie Helmond-De Peel Tabel 1: Stand WW-uitkeringen Stand WW mutatie tov vorige mnd mutatie tov vorig jaar Apr 2019 % Mrt 2019 % Apr 2018 % Nederland
De regionale arbeidsmarkt 2016
 De regionale arbeidsmarkt MEER INFO? Check onze site www.utrechtzorg.net of bel naar (030) 6340808 De regionale arbeidsmarkt Wat is ONS Werkgebied? Regio Utrecht, Amersfoort, Gooi- en Vechtstreek Gooi-
Regionale Maandcijfers Arbeidsmarktinformatie Zaanstreek/Waterland
 14-5-2019 14:16:59 Regionale Maandcijfers Arbeidsmarktinformatie Zaanstreek/Waterland Tabel 1: Stand WW-uitkeringen Stand WW mutatie tov vorige mnd mutatie tov vorig jaar Apr 2019 % Mrt 2019 % Apr 2018
Regionale Maandcijfers Arbeidsmarktinformatie West-Brabant
 14-5-2019 15:21:47 Regionale Maandcijfers Arbeidsmarktinformatie West-Brabant Tabel 1: Stand WW-uitkeringen Stand WW mutatie tov vorige mnd mutatie tov vorig jaar Apr 2019 % Mrt 2019 % Apr 2018 % Nederland
Regionale Maandcijfers Arbeidsmarktinformatie Groot Amsterdam
 Regionale Maandcijfers Arbeidsmarktinformatie Groot Amsterdam Tabel 1: Stand WW-uitkeringen Stand WW mutatie tov vorige mnd mutatie tov vorig jaar Sep 2017 % aantal % aantal % Nederland 350.810 3,9% -11.322-3,1%
Regionale Maandcijfers Arbeidsmarktinformatie Noord-Holland Noord
 14-5-2019 14:12:21 Regionale Maandcijfers Arbeidsmarktinformatie Noord-Holland Noord Tabel 1: Stand WW-uitkeringen Stand WW mutatie tov vorige mnd mutatie tov vorig jaar Apr 2019 % Mrt 2019 % Apr 2018
Regionale Maandcijfers Arbeidsmarktinformatie Amersfoort
 Regionale Maandcijfers Arbeidsmarktinformatie Amersfoort Tabel 1: Stand WW-uitkeringen Stand WW mutatie tov vorige mnd mutatie tov vorig jaar Sep 2017 % aantal % aantal % Nederland 350.810 3,9% -11.322-3,1%
Regionale Maandcijfers Arbeidsmarktinformatie Midden-Limburg
 Regionale Maandcijfers Arbeidsmarktinformatie Midden-Limburg Tabel 1: Stand WW-uitkeringen Stand WW mutatie tov vorige mnd mutatie tov vorig jaar Nov 2017 % aantal % aantal % Nederland 336.902 3,8% -6.194-1,8%
Regionale Maandcijfers Arbeidsmarktinformatie Midden-Limburg
 Regionale Maandcijfers Arbeidsmarktinformatie Midden-Limburg Tabel 1: Stand WW-uitkeringen Stand WW mutatie tov vorige mnd mutatie tov vorig jaar Okt 2017 % aantal % aantal % Nederland 343.096 3,8% -7.714-2,2%
Regionale maandcijfers Arbeidsmarktinformatie Midden-Limburg
 Regionale maandcijfers Arbeidsmarktinformatie Midden-Limburg Tabel 1 Stand WW-uitkeringen Stand WW mutatie tov vorige mnd mutatie tov vorig jaar aug 2017 % aantal % aantal % Nederland 362.132 4,1% -2.290-0,6%
Regionale Maandcijfers Arbeidsmarktinformatie Midden-Limburg
 Regionale Maandcijfers Arbeidsmarktinformatie Midden-Limburg Tabel 1: Stand WW-uitkeringen Stand WW mutatie tov vorige mnd mutatie tov vorig jaar Sep 2017 % aantal % aantal % Nederland 350.810 3,9% -11.322-3,1%
Regionale Maandcijfers Arbeidsmarktinformatie Drechtsteden
 15-5-2019 11:01:31 Regionale Maandcijfers Arbeidsmarktinformatie Drechtsteden Tabel 1: Stand WW-uitkeringen Stand WW mutatie tov vorige mnd mutatie tov vorig jaar Apr 2019 % Mrt 2019 % Apr 2018 % Nederland
Regionale Maandcijfers Arbeidsmarktinformatie Zeeland
 14-5-2019 15:18:31 Regionale Maandcijfers Arbeidsmarktinformatie Zeeland Tabel 1: Stand WW-uitkeringen Stand WW mutatie tov vorige mnd mutatie tov vorig jaar Apr 2019 % Mrt 2019 % Apr 2018 % Nederland
Regionale Maandcijfers Arbeidsmarktinformatie Rivierenland
 14-5-2019 17:45:42 Regionale Maandcijfers Arbeidsmarktinformatie Rivierenland Tabel 1: Stand WW-uitkeringen Stand WW mutatie tov vorige mnd mutatie tov vorig jaar Apr 2019 % Mrt 2019 % Apr 2018 % Nederland
Regionale Maandcijfers Arbeidsmarktinformatie Zuid-Limburg
 14-5-2019 15:37:55 Regionale Maandcijfers Arbeidsmarktinformatie Zuid-Limburg Tabel 1: Stand WW-uitkeringen Stand WW mutatie tov vorige mnd mutatie tov vorig jaar Apr 2019 % Mrt 2019 % Apr 2018 % Nederland
Regionale Maandcijfers Arbeidsmarktinformatie Regio Zwolle
 15-5-2019 08:54:25 Regionale Maandcijfers Arbeidsmarktinformatie Regio Zwolle Tabel 1: Stand WW-uitkeringen Stand WW mutatie tov vorige mnd mutatie tov vorig jaar Apr 2019 % Mrt 2019 % Apr 2018 % Nederland
de wereld van werk trends en ontwikkelingen Ton Hopmans Managing Director Yacht
 de wereld van werk trends en ontwikkelingen Ton Hopmans Managing Director Yacht vier grote thema s technologie demografie globalisering duurzaamheid Randstad 2 technologie robotisering zorgt voor hogere
Regionale maandcijfers Arbeidsmarktinformatie Drechtsteden
 Regionale maandcijfers Arbeidsmarktinformatie Drechtsteden Tabel 1 Stand WW-uitkeringen Stand WW mutatie tov vorige mnd mutatie tov vorig jaar aug 2017 % aantal % aantal % Nederland 362.132 4,1% -2.290-0,6%
Regionale maandcijfers Arbeidsmarktinformatie Zuid-Holland Centraal
 Regionale maandcijfers Arbeidsmarktinformatie Zuid-Holland Centraal Tabel 1 Stand WW-uitkeringen Stand WW mutatie tov vorige mnd mutatie tov vorig jaar aug 2017 % aantal % aantal % Nederland 362.132 4,1%
Regionale Maandcijfers Arbeidsmarktinformatie Midden-Utrecht
 15-5-2019 09:25:47 Regionale Maandcijfers Arbeidsmarktinformatie Midden-Utrecht Tabel 1: Stand WW-uitkeringen Stand WW mutatie tov vorige mnd mutatie tov vorig jaar Apr 2019 % Mrt 2019 % Apr 2018 % Nederland
Regionale Maandcijfers Arbeidsmarktinformatie Zuidoost-Brabant
 14-5-2019 15:29:01 Regionale Maandcijfers Arbeidsmarktinformatie Zuidoost-Brabant Tabel 1: Stand WW-uitkeringen Stand WW mutatie tov vorige mnd mutatie tov vorig jaar Apr 2019 % Mrt 2019 % Apr 2018 % Nederland
Regionale Maandcijfers Arbeidsmarktinformatie Stedendriehoek en Noordwest
 14-5-2019 17:55:41 Regionale Maandcijfers Arbeidsmarktinformatie Tabel 1: Stand WW-uitkeringen Stand WW mutatie tov vorige mnd mutatie tov vorig jaar Apr 2019 % Mrt 2019 % Apr 2018 % Nederland 257.414
Regionale Maandcijfers Arbeidsmarktinformatie Twente
 14-5-2019 17:47:58 Regionale Maandcijfers Arbeidsmarktinformatie Twente Tabel 1: Stand WW-uitkeringen Stand WW mutatie tov vorige mnd mutatie tov vorig jaar Apr 2019 % Mrt 2019 % Apr 2018 % Nederland 257.414
Regionale maandcijfers Arbeidsmarktinformatie Gorinchem
 Regionale maandcijfers Arbeidsmarktinformatie Gorinchem Tabel 1 Stand WW-uitkeringen Stand WW mutatie tov vorige mnd mutatie tov vorig jaar aug 2017 % aantal % aantal % Nederland 362.132 4,1% -2.290-0,6%
Regionale Maandcijfers Arbeidsmarktinformatie Helmond-De Peel
 Regionale Maandcijfers Arbeidsmarktinformatie Helmond-De Peel Tabel 1: Stand WW-uitkeringen Stand WW mutatie tov vorige mnd mutatie tov vorig jaar Sep 2017 % aantal % aantal % Nederland 350.810 3,9% -11.322-3,1%
Regionale maandcijfers Arbeidsmarktinformatie Achterhoek
 Regionale maandcijfers Arbeidsmarktinformatie Achterhoek Tabel 1 Stand WW-uitkeringen Stand WW mutatie tov vorige mnd mutatie tov vorig jaar aug 2017 % aantal % aantal % Nederland 362.132 4,1% -2.290-0,6%
Regionale Maandcijfers Arbeidsmarktinformatie Achterhoek
 Regionale Maandcijfers Arbeidsmarktinformatie Achterhoek Tabel 1: Stand WW-uitkeringen Stand WW mutatie tov vorige mnd mutatie tov vorig jaar Okt 2017 % aantal % aantal % Nederland 343.096 3,8% -7.714-2,2%
Regionale Maandcijfers Arbeidsmarktinformatie Achterhoek
 Regionale Maandcijfers Arbeidsmarktinformatie Achterhoek Tabel 1: Stand WW-uitkeringen Stand WW mutatie tov vorige mnd mutatie tov vorig jaar Sep 2017 % aantal % aantal % Nederland 350.810 3,9% -11.322-3,1%
Regionale Maandcijfers Arbeidsmarktinformatie Midden-Brabant
 14-5-2019 15:24:15 Regionale Maandcijfers Arbeidsmarktinformatie Midden-Brabant Tabel 1: Stand WW-uitkeringen Stand WW mutatie tov vorige mnd mutatie tov vorig jaar Apr 2019 % Mrt 2019 % Apr 2018 % Nederland
Regionale Maandcijfers Arbeidsmarktinformatie Midden-Gelderland
 Regionale Maandcijfers Arbeidsmarktinformatie Midden-Gelderland Tabel 1: Stand WW-uitkeringen Stand WW mutatie tov vorige mnd mutatie tov vorig jaar Nov 2017 % aantal % aantal % Nederland 336.902 3,8%
Regionale maandcijfers Arbeidsmarktinformatie Midden-Gelderland
 Regionale maandcijfers Arbeidsmarktinformatie Midden-Gelderland Tabel 1 Stand WW-uitkeringen Stand WW mutatie tov vorige mnd mutatie tov vorig jaar aug 2017 % aantal % aantal % Nederland 362.132 4,1% -2.290-0,6%
Regionale Maandcijfers Arbeidsmarktinformatie Zaanstreek/Waterland
 Regionale Maandcijfers Arbeidsmarktinformatie Zaanstreek/Waterland Tabel 1: Stand WW-uitkeringen Stand WW mutatie tov vorige mnd mutatie tov vorig jaar Sep 2017 % aantal % aantal % Nederland 350.810 3,9%
Regionale Maandcijfers Arbeidsmarktinformatie Zuid-Kennemerland en IJmond
 Regionale Maandcijfers Arbeidsmarktinformatie Zuid-Kennemerland en IJmond Tabel 1: Stand WW-uitkeringen Stand WW mutatie tov vorige mnd mutatie tov vorig jaar Dec 2017 % aantal % aantal % Nederland 329.953
Regionale maandcijfers Arbeidsmarktinformatie Zuid-Kennemerland en IJmond
 Regionale maandcijfers Arbeidsmarktinformatie Zuid-Kennemerland en IJmond Tabel 1 Stand WW-uitkeringen Stand WW mutatie tov vorige mnd mutatie tov vorig jaar aug 2017 % aantal % aantal % Nederland 362.132
Regionale maandcijfers Arbeidsmarktinformatie Drechtsteden
 Regionale maandcijfers Arbeidsmarktinformatie Drechtsteden Tabel 1 Stand WW-uitkeringen Stand WW mutatie tov vorige mnd mutatie tov vorig jaar sep 2017 % aantal % aantal % Nederland 350.810 3,9% -11.322-3,1%
Regionale Maandcijfers Arbeidsmarktinformatie Rivierenland
 Regionale Maandcijfers Arbeidsmarktinformatie Rivierenland Tabel 1: Stand WW-uitkeringen Stand WW mutatie tov vorige mnd mutatie tov vorig jaar Sep 2017 % aantal % aantal % Nederland 350.810 3,9% -11.322-3,1%
Samenvatting Regio in beeld Gooi en Vechtstreek
 Samenvatting Regio in beeld 2016 Gooi en Vechtstreek Samenvatting Aantal banen neemt toe, vooral in de marktsector In de regio Gooi en Vechtstreek groeit het aantal banen van werknemers (voltijd en deeltijd)
Regionale Maandcijfers Arbeidsmarktinformatie West-Brabant
 Regionale Maandcijfers Arbeidsmarktinformatie West-Brabant Tabel 1: Stand WW-uitkeringen Stand WW mutatie tov vorige mnd mutatie tov vorig jaar Sep 2017 % aantal % aantal % Nederland 350.810 3,9% -11.322-3,1%
Regionale maandcijfers Arbeidsmarktinformatie Noord-Holland Noord
 Regionale maandcijfers Arbeidsmarktinformatie Noord-Holland Noord Tabel 1 Stand WW-uitkeringen Stand WW mutatie tov vorige mnd mutatie tov vorig jaar aug 2017 % aantal % aantal % Nederland 362.132 4,1%
Regionale Maandcijfers Arbeidsmarktinformatie Noord-Holland Noord
 Regionale Maandcijfers Arbeidsmarktinformatie Noord-Holland Noord Tabel 1: Stand WW-uitkeringen Stand WW mutatie tov vorige mnd mutatie tov vorig jaar Sep 2017 % aantal % aantal % Nederland 350.810 3,9%
Regionale Maandcijfers Arbeidsmarktinformatie Rijk van Nijmegen
 Regionale Maandcijfers Arbeidsmarktinformatie Rijk van Nijmegen Tabel 1: Stand WW-uitkeringen Stand WW mutatie tov vorige mnd mutatie tov vorig jaar Maa 2019 % aantal % aantal % Nederland 267.667 2,9%
Regionale maandcijfers Arbeidsmarktinformatie West-Brabant
 Regionale maandcijfers Arbeidsmarktinformatie West-Brabant Tabel 1 Stand WW-uitkeringen Stand WW mutatie tov vorige mnd mutatie tov vorig jaar aug 2017 % aantal % aantal % Nederland 362.132 4,1% -2.290-0,6%
Regionale maandcijfers Arbeidsmarktinformatie Midden-Brabant
 Regionale maandcijfers Arbeidsmarktinformatie Midden-Brabant Tabel 1 Stand WW-uitkeringen Stand WW mutatie tov vorige mnd mutatie tov vorig jaar aug 2017 % aantal % aantal % Nederland 362.132 4,1% -2.290-0,6%
Regionale Maandcijfers Arbeidsmarktinformatie Rijnmond
 15-5-2019 09:45:20 Regionale Maandcijfers Arbeidsmarktinformatie Rijnmond Tabel 1: Stand WW-uitkeringen Stand WW mutatie tov vorige mnd mutatie tov vorig jaar Apr 2019 % Mrt 2019 % Apr 2018 % Nederland
Regionale Maandcijfers Arbeidsmarktinformatie Midden-Utrecht
 Regionale Maandcijfers Arbeidsmarktinformatie Midden-Utrecht Tabel 1: Stand WW-uitkeringen Stand WW mutatie tov vorige mnd mutatie tov vorig jaar Nov 2017 % aantal % aantal % Nederland 336.902 3,8% -6.194-1,8%
Regionale maandcijfers Arbeidsmarktinformatie Midden-Utrecht
 Regionale maandcijfers Arbeidsmarktinformatie Midden-Utrecht Tabel 1 Stand WW-uitkeringen Stand WW mutatie tov vorige mnd mutatie tov vorig jaar aug 2017 % aantal % aantal % Nederland 362.132 4,1% -2.290-0,6%
Regionale Maandcijfers Arbeidsmarktinformatie Holland Rijnland
 Regionale Maandcijfers Arbeidsmarktinformatie Holland Rijnland Tabel 1: Stand WW-uitkeringen Stand WW mutatie tov vorige mnd mutatie tov vorig jaar Nov 2017 % aantal % aantal % Nederland 336.902 3,8% -6.194-1,8%
Regionale Maandcijfers Arbeidsmarktinformatie Midden-Utrecht
 Regionale Maandcijfers Arbeidsmarktinformatie Midden-Utrecht Tabel 1: Stand WW-uitkeringen Stand WW mutatie tov vorige mnd mutatie tov vorig jaar Sep 2017 % aantal % aantal % Nederland 350.810 3,9% -11.322-3,1%
Regionale Maandcijfers Arbeidsmarktinformatie Holland Rijnland
 Regionale Maandcijfers Arbeidsmarktinformatie Holland Rijnland Tabel 1: Stand WW-uitkeringen Stand WW mutatie tov vorige mnd mutatie tov vorig jaar Sep 2017 % aantal % aantal % Nederland 350.810 3,9% -11.322-3,1%
Regionale maandcijfers Arbeidsmarktinformatie Twente
 Regionale maandcijfers Arbeidsmarktinformatie Twente Tabel 1 Stand WW-uitkeringen Stand WW mutatie tov vorige mnd mutatie tov vorig jaar aug 2017 % aantal % aantal % Nederland 362.132 4,1% -2.290-0,6%
Tweede Kamer der Staten-Generaal
 Tweede Kamer der Staten-Generaal 2 Vergaderjaar 2018 2019 Aanhangsel van de Handelingen Vragen gesteld door de leden der Kamer, met de daarop door de regering gegeven antwoorden 1554 Vragen van het lid
Regionale Maandcijfers Arbeidsmarktinformatie Friesland
 15-5-2019 08:49:43 Regionale Maandcijfers Arbeidsmarktinformatie Friesland Tabel 1: Stand WW-uitkeringen Stand WW mutatie tov vorige mnd mutatie tov vorig jaar Apr 2019 % Mrt 2019 % Apr 2018 % Nederland
Regionale Maandcijfers Arbeidsmarktinformatie Stedendriehoek en Noordwest Veluwe
 Regionale Maandcijfers Arbeidsmarktinformatie Stedendriehoek en Noordwest Veluwe Tabel 1: Stand WW-uitkeringen Stand WW mutatie tov vorige mnd mutatie tov vorig jaar Okt 2017 % aantal % aantal % Nederland
Regionale Maandcijfers Arbeidsmarktinformatie Stedendriehoek en Noordwest Veluwe
 Regionale Maandcijfers Arbeidsmarktinformatie Stedendriehoek en Noordwest Veluwe Tabel 1: Stand WW-uitkeringen Stand WW mutatie tov vorige mnd mutatie tov vorig jaar Sep 2017 % aantal % aantal % Nederland
Regionale maandcijfers Arbeidsmarktinformatie Zuidoost-Brabant
 Regionale maandcijfers Arbeidsmarktinformatie Zuidoost-Brabant Tabel 1 Stand WW-uitkeringen Stand WW mutatie tov vorige mnd mutatie tov vorig jaar aug 2017 % aantal % aantal % Nederland 362.132 4,1% -2.290-0,6%
Regionale Maandcijfers Arbeidsmarktinformatie Zuidoost-Brabant
 Regionale Maandcijfers Arbeidsmarktinformatie Zuidoost-Brabant Tabel 1: Stand WW-uitkeringen Stand WW mutatie tov vorige mnd mutatie tov vorig jaar Sep 2017 % aantal % aantal % Nederland 350.810 3,9% -11.322-3,1%
Regionale Maandcijfers Arbeidsmarktinformatie Noordoost-Brabant
 Regionale Maandcijfers Arbeidsmarktinformatie Noordoost-Brabant Tabel 1: Stand WW-uitkeringen Stand WW mutatie tov vorige mnd mutatie tov vorig jaar Nov 2017 % aantal % aantal % Nederland 336.902 3,8%
Regionale maandcijfers Arbeidsmarktinformatie Noordoost-Brabant
 Regionale maandcijfers Arbeidsmarktinformatie Noordoost-Brabant Tabel 1 Stand WW-uitkeringen Stand WW mutatie tov vorige mnd mutatie tov vorig jaar aug 2017 % aantal % aantal % Nederland 362.132 4,1% -2.290-0,6%
Nieuwsflits Arbeidsmarkt. Holland Rijnland, maart 2019
 Nieuwsflits Arbeidsmarkt Holland Rijnland, maart 2019 Minder werkzoekenden langdurig in de WW in Holland Rijnland In Holland Rijnland houdt de daling van WW-uitkeringen gelijke tred met die van Nederland.
Regionale Maandcijfers Arbeidsmarktinformatie Groningen
 Regionale Maandcijfers Arbeidsmarktinformatie Groningen Tabel 1: Stand WW-uitkeringen Stand WW mutatie tov vorige mnd mutatie tov vorig jaar Maa 2019 % aantal % aantal % Nederland 267.667 2,9% -5.890-2,2%
Regionale Maandcijfers Arbeidsmarktinformatie FoodValley
 Regionale Maandcijfers Arbeidsmarktinformatie FoodValley Tabel 1: Stand WW-uitkeringen Stand WW mutatie tov vorige mnd mutatie tov vorig jaar Feb 2019 % aantal % aantal % Nederland 268.702 3,1% -5.527-2,0%
Highlights Regio in Beeld 2015. Arbeidsmarktregio Amersfoort
 Highlights Regio in Beeld 2015 Arbeidsmarktregio Amersfoort Samenvatting Aantal banen neemt weer toe, echter niet in collectieve sector In Amersfoort groeit het aantal banen van werknemers (voltijd en
Regionale maandcijfers Arbeidsmarktinformatie Zaanstreek/Waterland
 Regionale maandcijfers Arbeidsmarktinformatie Zaanstreek/Waterland Tabel 1 Stand WW-uitkeringen Stand WW mutatie tov vorige mnd mutatie tov vorig jaar aug 2017 % aantal % aantal % Nederland 362.132 4,1%
De arbeidsmarkt in Noord- en Midden- Limburg. Jeroen van den Berg (UWV) Geijsteren, december 2015
 Geijsteren, december 2015") De arbeidsmarkt in Noord- en Midden- Limburg Jeroen van den Berg (UWV) Geijsteren, december 2015 Planning Ontwikkelingen in Noord-Limburg Uitdagingen op de arbeidsmarkt 2 Bescheiden banengroei in 2015
De arbeidsmarkt in Noord- en Midden- Limburg Jeroen van den Berg (UWV) Geijsteren, december 2015 Planning Ontwikkelingen in Noord-Limburg Uitdagingen op de arbeidsmarkt 2 Bescheiden banengroei in 2015
Regionale Maandcijfers Arbeidsmarktinformatie Zuid-Kennemerland en IJmond
 Regionale Maandcijfers Arbeidsmarktinformatie Zuid-Kennemerland en IJmond Tabel 1: Stand WW-uitkeringen Stand WW mutatie tov vorige mnd mutatie tov vorig jaar Feb 2019 % aantal % aantal % Nederland 268.702
Samenvatting Regio in beeld Midden-Holland
 Samenvatting Regio in beeld 2016 Midden-Holland Samenvatting Aantal banen neemt toe, echter niet in collectieve sector In Midden-Holland groeit het aantal banen van werknemers (voltijd en deeltijd) in
Regionale Maandcijfers Arbeidsmarktinformatie Zuid-Limburg
 Regionale Maandcijfers Arbeidsmarktinformatie Zuid-Limburg Tabel 1: Stand WW-uitkeringen Stand WW mutatie tov vorige mnd mutatie tov vorig jaar Sep 2017 % aantal % aantal % Nederland 350.810 3,9% -11.322-3,1%
Regionale Maandcijfers Arbeidsmarktinformatie Midden-Brabant
 Regionale Maandcijfers Arbeidsmarktinformatie Midden-Brabant Tabel 1: Stand WW-uitkeringen Stand WW mutatie tov vorige mnd mutatie tov vorig jaar Feb 2019 % aantal % aantal % Nederland 268.702 3,1% -5.527-2,0%
Regionale Maandcijfers Arbeidsmarktinformatie West-Brabant
 Regionale Maandcijfers Arbeidsmarktinformatie West-Brabant Tabel 1: Stand WW-uitkeringen Stand WW mutatie tov vorige mnd mutatie tov vorig jaar Feb 2019 % aantal % aantal % Nederland 268.702 3,1% -5.527-2,0%
Regionale Maandcijfers Arbeidsmarktinformatie Regio Zwolle
 Regionale Maandcijfers Arbeidsmarktinformatie Regio Zwolle Tabel 1: Stand WW-uitkeringen Stand WW mutatie tov vorige mnd mutatie tov vorig jaar Maa 2019 % aantal % aantal % Nederland 267.667 2,9% -5.890-2,2%