BTO February BTO report. Exploring the boundaries of nontarget. Liquid Chromatography coupled to ESI-MS
|
|
|
- Benjamin de Lange
- 4 jaren geleden
- Aantal bezoeken:
Transcriptie

1 BTO February 2017 BTO report Exploring the boundaries of nontarget screening with Liquid Chromatography coupled to ESI-MS
2 BTO February 2017 Exploring the boundaries of non-target screening with Liquid Chromatography coupled to ESI-MS
3 BTO February 2017 Exploring the boundaries of non-target screening with Liquid Chromatography coupled to ESI-MS BTO Exploring the boundaries of non-target screening with Liquid Chromatography coupled to ESI-MS BTO February 2017 Project number Project manager S.A.E. Kools Client BTO Quality Assurance W.P de Voogt Author(s) J.A. van Leerdam, B.L. Bajema (Vitens), R.M.A. Sjerps, B.A. Wols, P.S. Bäuerlein, T.L. ter Laak, M.M.E. van der Kooi en E. Emke Sent to This report is distributed to BTO-participants. A year after publication it is public. Year of publishing 2017 More information Ing. Ton van Leerdam T ton.van.leerdam@kwrwater.nl Keywords: mass spectrometry, non-target screening, response factor PO Box BB Nieuwegein The Netherlands T +31 (0) F +31 (0) E info@kwrwater.nl I BTO February 2017 KWR All rights reserved. No part of this publication may be reproduced, stored in an automatic database, or transmitted, in any form or by any means, be it electronic, mechanical, by photocopying, recording, or in any other manner, without the prior written permission of the publisher.
, R.M.A. Sjerps, B.A. Wols, P.S. Bäuerlein, T.L. ter Laak, M.M.E. van der Kooi en E.")
4 BTO February 2017 Exploring the boundaries of non-target screening with Liquid Chromatography coupled to ESI-MS BTO Managementsamenvatting Hoe breed is brede screening? Auteur(s): J.A. van Leerdam, B.L. Bajema (Vitens), R.M.A. Sjerps, B.A. Wols, P.S. Bäuerlein, T.L. ter Laak, M.M.E. van der Kooi en E. Emke Vitens en KWR hebben op basis van uitgebreide metingen, literatuuronderzoek en ervaring twee modellen ontwikkeld die inzicht bieden in de inzetbaarbeid van non-target screening met vloeistofchromatografie (LC) en hoge-resolutie-massaspectrometrie (MS): LC-HRMS. Uit het onderzoek bleek dat er diverse verbanden bestaan tussen meetgevoeligheid en fysisch-chemische stofeigenschappen zoals elektronegativiteit en het aantal stikstofatomen in het molecuul. Het voorspellen van de meetgevoeligheid is complex omdat daarbij meerdere eigenschappen tegelijkertijd een rol spelen, naast de instrumentele instellingen. Model 1 voorspelt met 80% zekerheid of een stof wél of niet analyseerbaar is met LC-HRMS. Deze betrouwbaarheid wordt voldoende geacht voor een voorspellingsmodel. Model 2 bepaalt in welke van de vier meetgevoeligheidsklassen een stof valt, met 60% tot 76% zekerheid. Dit wordt nog onvoldoende geacht voor een betrouwbare voorspelling. Met model 1 is voor 150 voor drinkwater relevante stoffen vastgesteld in hoeverre ze te analyseren zijn. Van deze stoffen kan volgens het ontwikkelde model 65% worden geanalyseerd met LC-HRMS. Ionisatiekamer van de Orbitrap massaspectrometer Belang: zoveel mogelijk chemische stoffen die in het milieu voorkomen detecteren Wereldwijd worden er steeds meer stoffen geproduceerd. Een deel van deze stoffen komt ook in het milieu terecht en kan daardoor een bedreiging vormen voor de bronnen voor drinkwaterbereiding. Een zo compleet mogelijke chemische screening is noodzakelijk om de verspreiding van stoffen en de eventuele risico s die ze met zich meebrengen goed te kunnen inschatten. Met behulp van een brede screening met de combinatie van vloeistofchromatografie (LC)
5 BTO February 2017 Exploring the boundaries of non-target screening with Liquid Chromatography coupled to ESI-MS en hoge-resolutie-massaspectrometrie (MS) is het mogelijk in één analysegang zowel op bekende als onbekende stoffen te screenen. Deze methode is inmiddels circa tien jaar beschikbaar en wordt wereldwijd steeds meer toegepast. In 2013 hebben KWR en Vitens een begin gemaakt met de verdere harmonisatie van de werkwijze van de methode voor gebruik in de drinkwaterlaboratoria. Over de reikwijdte en de grenzen van deze detectiemethode en de betrouwbaarheid van de kwantificering is echter nog weinig bekend. Kennis hierover is nodig om zo goed mogelijk in beeld te krijgen in hoeverre non-target screening het mogelijk maakt om het steeds groter wordende bereik aan chemische stoffen in beeld te krijgen. meetgevoeligheid is complex omdat daarbij meerdere eigenschappen tegelijkertijd een rol spelen, naast de instrumentele instellingen. Op basis van 32 fysisch-chemische eigenschappen zijn twee modellen ontwikkeld: Model 1 voorspelt met 80% zekerheid of een stof wél of niet analyseerbaar is met LC-HRMS. Deze betrouwbaarheid wordt voldoende geacht voor een voorspellingsmodel; Model 2 bepaalt in welke van de vier meetgevoeligheidsklassen een stof valt, met 60% tot 76% zekerheid. Dit wordt nog onvoldoende geacht voor een betrouwbare voorspelling. Aanpak: metingen aan een groot aantal doelstoffen combineren met statistische big-data-technieken In totaal zijn in de laboratoria van Vitens en KWR bijna 500 stoffen geanalyseerd met de brede screeningsmethode, waarbij de meetgevoeligheid is geregistreerd. Op basis van een literatuurstudie en de ruime ervaring met deze techniek zijn chemische eigenschappen geselecteerd die waarschijnlijk van invloed zijn op de ionisatie in de massaspectrometer en daarmee op de meetgevoeligheid van de techniek. Met de nieuwste statistische big-data-technieken zijn relaties opgespoord tussen de gemeten gevoeligheid en in totaal 41 fysisch-chemische eigenschappen uit een set van 1300 vrij beschikbare molecuul descriptoren (PaDEL descriptoren). Resultaten: maat voor meetgevoeligheid ontwikkeld Uit de analyse van de ruim 500 stoffen bleek dat de meetgevoeligheid voor het overgrote deel van de stoffen lager is dan de gevoeligheid voor de gebruikelijke interne standaardstoffen. De in het verleden opgegeven concentraties in equivalenten interne standaard (atrazine-d5 en bentazon-d6) zijn daarom te laag, de werkelijke concentraties blijken tot meer dan een factor hoger te kunnen liggen. Voor een betere concentratieberekening zijn vier gevoeligheidsklassen gedefinieerd. Op basis van deze klasse-indeling kan een correctie voor de concentratie worden toegepast. Uit het onderzoek bleek dat er diverse verbanden bestaan tussen meetgevoeligheid en fysischchemische stofeigenschappen als electronegativiteit en het aantal stikstofatomen in het molecuul. Het voorspellen van de Met model 1 is voor 150 voor drinkwater relevante stoffen vastgesteld in hoeverre ze te analyseren zijn. Van deze stoffen kan volgens het ontwikkelde model 65% worden geanalyseerd met LC-HRMS. Het tweede model zal in de toekomst verfijnd moeten worden om de meetgevoeligheid goed te kunnen voorspellen. De verwachting is dat modellen in de toekomst een steeds grotere rol zullen spelen bij het voorspellen van de analyseerbaarheid én bij het voorspellen van de zuiveringsrendementen en toxiciteit van chemische stoffen. Implementatie: gegevens gedeeld in Europese databank en workshop brede screening De massaspectra van een deel van de gemeten stoffen zijn ingevoerd in de Europese databank Massbank, zodat ook andere instituten van deze gegevens gebruik kunnen maken. In 2017 zullen de resultaten van dit onderzoek samen met resultaten van aanpalende BTO-projecten zoals Bevestigen suspects en Kwaliteitsborging brede screening in een workshop met de drinkwaterlaboratoria worden gedeeld. In de workshop zal centraal staan in hoeverre de nieuwe inzichten in de praktijk toegepast kunnen worden. Rapport Dit onderzoek is beschreven in het rapport Exploring the boundaries of non-target screening with Liquid Chromatography coupled to ESI-MS (BTO ). Tevens worden de onderzoeksresultaten ingediend bij het wetenschappelijke tijdschrift International Journal of Mass Spectrometry. More information Ton van Leerdam T E ton.van.leerdam@kwrwater.nl KWR PO Box BB Nieuwegein The Netherlands
6 2 Contents 1 Introduction Chemicals in the aquatic environment Goal of the study 5 2 Non-target screening with LC-HRMS Introduction Sample collection and conservation Sample preparation Chromatography Detection Compound variability of the different LC-HRMS stages Existing QSAR models 17 3 Analytical approach Introduction Selection of compounds Analysis with LC-HRMS Data handling 22 4 Results and discussion Performance of the LC-HRMS screening: internal standards Performance of the LC-HRMS screening: studied compounds Performance of the LC-HRMS screening: Vitens and KWR compared Correlation between physicochemical properties and response Classification model Prediction of detectability of drinking water relevant compounds 46 5 Conclusions and recommendations Conclusion Recommendations 49 6 Future monitoring and modeling 50 7 References 51
7 3 Attachment I: Recovery of top-100 compounds Attachment II: KWR list of studied target compounds Attachment III: Vitens list of studied target compounds Attachment IV: List of compounds relevant to drinking water Attachment V: Compared response of Vitens and KWR Attachment VI: Correlations of the different descriptor values Attachment VII: Contribution of descriptors values in the prediction of the response factor
 and 11.")
8 4 1 Introduction 1.1 Chemicals in the aquatic environment Worldwide over 100 million organic compounds are registered in the Chemical Abstract Service (CAS) database, approximately have been registered for commercial application in Europe (Schwarzenbach, 2006) and are produced or used in volumes over 100 tons per year in the European Union (European Chemicals Agency Information on Chemicals). FIGURE 1-1: REGISTERED CHEMICALS IN CAS-DATABASE OVER THE LAST 50 YEARS The release of compounds and resulting risks for human health and the environment have raised the concern of scientists and policy makers. The number of substances is too large to be monitored or to assess any substance and its risks separately. Therefore, there is a need for an analytical methodology that in a relatively simple way provides reliable information on the presence of anthropogenic substances in water. FIGURE 1-2: RELEASE OF CHEMICAL COMPOUNDS TO SURFACE WATER
9 5 Drinking water has to meet several water quality standards for inorganic and organic substances. In The Netherlands, a generic target value with an alerting function has been set at 1 µg/l for all organic anthropogenic chemicals in sources of drinking water. The regulatory framework leads to extensive monitoring programs by the drinking water companies. Different compounds can be detected by different analytical methods, a costly approach. In addition, the targeted approach is narrowed by the pre-selection of target compounds. The liquid chromatography high resolution mass spectrometry (LC-ESI-HR-MS) technique can combine target and non-target analyses, which provides a broader overview of the presence of substances in water (ter Laak et al., 2012). Despite the detection of a wide range of organic compounds, the analytical conditions are not ideal for all compounds. Reemtsma et al. (2016) highlight the issue of Persistent Mobile Organic Compounds (PMOCs) from an environmental perspective and assess the gaps that appear to exist in terms of analysis, monitoring, water treatment en regulation. In their paper they elaborate on strategies for how to narrow these gaps with the intention to better protect water resources. The analysis of a chemical compound depends on a lot of variables like isolation recovery, chromatographic behaviour and ionisation efficiency in the mass spectrometer. The goal of the present study is to gain insight in the analytical limitations of the LC-HRMS method for the detection of compounds relevant for drinking water when used as a tool for determining the water quality. An LC-HRMS screening was performed for a reference set of 223 compounds by KWR and 294 compounds by Vitens. The dataset is used to study the sensitivity of the LC-HRMS method in more detail and to predict the response factor (relative to the internal standard) using physicochemical compound properties. 1.2 Goal of the study Using experimental data from LC-HRMS screening coupled to ESI, we aim to get a better understanding of the limitations and the sensitivity of the LC-HRMS method. The goal of this study is threefold: What are the limits of the LC-HRMS screening method? Which chemicals or chemical groups can be detected with the method and which ones cannot? Which physicochemical properties can be identified that affect the detectability of the chemicals with LC-HRMS? For example polarity, volatility and molecular size. Can the sensitivity of the detection be predicted using one or a combination of multiple physicochemical properties?
, sample preparation (paragraph 2.3), separation process during chromatography (paragraph 2.4) and the detection of compounds (paragraph 2.")
. 2.")
10 6 2 Non-target screening with LC- HRMS This chapter provides some background information on non-target LC-HRMS screening and does not purport to be complete. After sample collection (paragraph 2.2), sample preparation (paragraph 2.3), separation process during chromatography (paragraph 2.4) and the detection of compounds (paragraph 2.5), results are presented of a literature study on physicochemical properties that mainly influence ionisation efficiency (paragraph 2.6). 2.1 Introduction Gas chromatography (GC) and Liquid chromatography (LC) coupled to a Mass Spectrometry (MS) are the most frequently applied techniques to detect and identify organic substances in environmental chemistry (Schwarzenbach et al., 2006). Often MS is complemented with UV/Vis spectroscopy to get additional information on the compounds. The reason why LC- HRMS is the most common technique is its versatility. This technique covers the largest range of organic compounds, whereas GC-MS is most commonly used for uncharged, small and reasonably volatile compounds (Figure 2-1). To impart volatility to otherwise non-volatile compounds, derivatisation in GC-MS is frequently used. FIGURE 2-1: DOMAINS OF GC-MS AND LC-HRMS TECHNIQUES IN THE TWO DIMENSIONS OF MOLECULAR WEIGHT AND HYDROPHILITY (SOURCE: KWR REPORT ) In this chapter the most common LC and MS techniques for non-target screening will be explained. Furthermore the whole procedure from sample collection to data analysis will be explained as the choice of technique in each step has a significant impact on the analysis. Figure 2-2 shows the pathway from sampling to data analysis and in Table 2-1 selected techniques for each step are presented.
11 7 FIGURE 2-2: FLOW CHART OF AN ANALYTICAL PROCEDURE. TABLE 2-1: DIFFERENT ELEMENTS IN THE NON-TARGET LC-HRMS SCREENING METHOD. Sample Sample Chromatography Detection Collection* Preparation* Grab sampling Liquid-Liquid Reversed Phase Electrospray Extraction (LLE) Ionisation (ESI) Passive sampling Normal Phase Solid Phase Atmospheric Pressure Time integrated Extraction (SPE) HILIC Chemical Ionisation sampling (APCI) Direct water injection Atmospheric Pressure Photo Ionisation Evaporation (APPI) * these parts of the LC-HRMS screening are not involved in this study due to the use of pure reference standards without sample collection and sample preparation. 2.2 Sample collection and conservation The sample is chosen in such a way that it represents the presence of one or multiple analytes in the water. The water sample encompasses the spatial dimensions as well as a temporal component. In both cases the quality of the sample depends upon how accurately the body of water is represented in the laboratory sample. Sampling is the first step in a multistep process (the analytical procedure) toward receiving meaningful results (see figure). Sampling is also the most critical step in the whole analytical procedure. If the sampling is not carried out cautiously and precisely, the following steps will turn out to be a meaningless exercise. Several things have to be kept in mind. Liquid samples often require the immediate addition of analyte-specific preservatives (e.g. NaN 3 to prevent microbial degradation). For trace-level analyses the sample collection vessel must be composed of a material that will not interfere with the sample (e.g. adsorption of compounds of interest to the bottle wall) and it must be rigorously cleaned before use. The storage temperature is crucial. May the sample be frozen? Will compounds degrade above certain temperatures? To be able to answer all these questions, the sampling steps have to be evaluated and validated. Apart from validating the sampling steps, also recording information of the sample and sampling location is essential (e.g. weather conditions, temperature etc.). 2.3 Sample preparation After the sample has been taken, the next step in the laboratory is to decide whether the sample needs further treatment. Sometimes it is necessary to remove interferences, perhaps even to completely isolate the intended analyte from its sample matrix. Also further concentration of the analyte can be necessary. Several techniques are available to reach
12 8 these goals. To concentrate the analyte liquid/liquid extraction, solid phase extraction (SPE) and evaporation are common techniques. Filtration, liquid/liquid extraction and SPE can be used to separate the analyte from the sample matrix. Also, all these steps must be validated beforehand to make sure they neither result in losses of the analyte, nor contaminate the sample. 2.4 Chromatography After the sample has been prepared for analysis, it will be subjected to liquid chromatography. Chromatography is a technique to separate and makes use of the distribution of a compound between two different phases, a mobile phase and a stationary phase. In LC the mobile phase is a liquid and the stationary phase can be either liquid or solid. The most common approach to realise such a system is a column (a tube) in which the stationary phase is contained and the mobile phase flows through the interstitial channels. For the separation mechanism to work the two phases must have different properties. The most frequently applied technique for analysis of organic compounds is reverse phase high performance liquid chromatography (RP-HPLC). In this technique the mobile phase is a polar solvent or mixture, whereas the stationary phase is predominantly apolar. In that case the more polar compounds favour the liquid phase (mobile phase) and will move faster through the column. As a consequence they get separated from the more apolar compounds and elute first. Another chromatographic technique is called HILIC (Hydrophilic Interaction Liquid Chromatography). Also in this case a column is filled with a solid carrier material. However, water molecules on the surface of this solid form a stationary layer which is in contact with the moving liquid layer. This technique is used for the separation of extremely polar compounds (Speksnijder et. al (2012), Vughs et al. (2015)). Based on the polarity of a chemical one has to decide which of the two techniques should be applied. However, it needs to be mentioned that HILIC is still a technique under development and is at large more difficult to apply than RP-HPLC. In both cases, when the compounds emerge from the column, they still need to be detected and preferably unequivocally identified. Several methods of detection are possible. The most common ones are UV-Vis spectroscopy and mass spectrometry. 2.5 Detection UV-Vis spectroscopy UV-Vis spectroscopy or just UV-Vis capitalises on the fact the molecules with π-bonds adsorb light between 200 and 700 nm. The amount and wavelength of light absorbed by a molecule provides useful information on the molecular structure and the quantity. As most chemicals that are interesting for environmental chemists contain double or triple bonds, this technique is a powerful tool for screening environmental samples. HPLC-UV screening is used for more than 10 years by KWR, WML, Evides, Aqualab Zuid and Rijkswaterstaat for the quick and relatively inexpensive monitoring of organic micropollutants in the river Meuse. Due to the limited identification power of UV, additional identification techniques such as mass spectrometry or Nuclear Magnetic Resonance are commonly used for the identification of unknowns detected by HPLC-UV.

13 Mass spectrometry Mass spectrometry is an analytical technique by which chemical substances are identified by the sorting of gaseous ions in electric and magnetic fields according to their mass-to-charge ratios. This means in this case one gets information on the molecular mass of the analyte. In a mass spectrometer molecules or fragments of molecules are separated according to their mass. Four steps in this process can be distinguished: (i) transfer of the molecules in the sample to the gaseous form, (ii) ionisation in the ionisation chamber, (iii) separation in the mass analyser and (iv) detection. This applies for all types of mass spectrometers. The second step, the ionisation, is the crucial step in mass spectrometry. If a molecule is not or not sufficiently ionised, it is either not detected at all or the signal is weak. The latter will result in a low sensitivity and can result in an underestimation of the actual concentration of a compound in a sample. There are numerous ways to ionise molecules. The most common ones for environmental analysis are: ESI (electrospray ionisation), APCI (atmospheric pressure chemical ionisation) and APPI (atmospheric pressure photo ionisation), they all differ in the way the molecules are converted into ions and also affect significantly the grade of fragmentation of the molecules. In Figure 2 3 the increasing interest for these 3 ionisation techniques are illustrated ESI APCI APPI FIGURE 2-3: THE AMOUNT OF SCIENTIFIC PAPERS REGARDING THE USE OF ESI, APCI AND APPI IN COMBINATION WITH LC-HRMS FOR ENVIRONMENTAL ANALYSIS IN THE LAST 40 YEARS (SOURCE: SCOPUS) Electrospray ionisation (ESI) is a technique used in mass spectrometry to produce ions using an electrospray in which a high voltage is applied to a liquid to create an aerosol. The first use of ESI in combination with mass spectrometry was reported by Malcolm Dole in John Bennett Fenn was awarded the 2002 Nobel Prize in Chemistry for the development of electrospray ionisation mass spectrometry in the late 1980s. ESI is a so-called 'soft ionisation' technique, since there is very little fragmentation. In this study, ESI is used for all experiments. In combination with LC, ESI is the most frequently applied ionisation technique due to its versatility. A wide range of compounds from very hydrophilic (log Kow = -2) to weakly hydrophilic (log Kow = + 3.5) can be analysed. Also the molecular mass range is extensive (50 to 2000 Da). This is illustrated in Figure 2.4 where the global domains of the three ionisation techniques are shown in the two dimensions of molecular weight and hydrophobicity.
 of interest is introduced into the ionisation chamber through a capillary with an electric potential difference (Figure 2-5) and dispersed by electrospray into a")
14 10 FIGURE 2-4: GLOBAL DOMAINS OF FOUR DIFFERENT SIONISATION TECHNIQUES IN THE TWO DIMENSIONS OF MOLECULAR IWEIGHT AND HYDROPHOBICITY. The liquid containing the analyte(s) of interest is introduced into the ionisation chamber through a capillary with an electric potential difference (Figure 2-5) and dispersed by electrospray into a fine aerosol. Because the ion formation involves extensive solvent evaporation (also termed desolvation), the typical solvents for electrospray ionisation are prepared by mixing water with volatile organic compounds (e.g. methanol or acetonitrile). To decrease the initial droplet size, compounds that increase the conductivity (e.g. acetic acid) are customarily added to the solution. These species also act to provide a source of protons to facilitate the ionisation process. The ions observed by mass spectrometry may be quasimolecular ions created by the addition of a hydrogen cation and denoted [M + H] +, or of another cation such as sodium ion, [M + Na] +, or the removal of a hydrogen nucleus, [M H]. Multiply charged ions such as [M + nh] n+ are often observed. For LC-HRMS screening, the positive as well as the negative ionisation mode must be applied to be able to detect all compounds.
15 11 FIGURE 2-5: PRINCIPLE OF ELECTROSPRAY IONISATION (ESI). There are many types of mass spectrometers using magnetic or electric fields, each type which its own strengths and weaknesses. A sector field mass analyser uses an electric and/or magnetic field to affect the path and/or velocity of the charged particles in some way. The time-of-flight (TOF) analyser uses an electric field to structural accelerate the ions through the same potential, and then measures the time they take to reach the detector. In an ion trap, ions are trapped and sequentially ejected Beside this, there are several important analyser characteristics. The mass resolving power is the measure of the ability to distinguish two peaks of slightly different m/z. Table 2-2 shows the importance of this feature. Without the accurate mass of the molecules, three completely different compounds with a molecular weight of 84 would be indistinguishable by MS with a low resolving power.
 and time of flight (e.g. QTOF) in combination with high resolution (HR) MS.")
.")
16 12 TABLE 2-2 THREE DIFFERENT COMPOUNDS WITH THE SAME NOMINAL MASS BUT DIFFERENT ACCURATE MASSES. Elemental composition C 6H 12 C 5H 8O C 4H 8N 2 Nominal mass Accurate mass There are several ways to achieve accurate masses, the two most common techniques are ion traps (e.g. Orbitrap) and time of flight (e.g. QTOF) in combination with high resolution (HR) MS. This means the determination of mass values accurately up to more than one decimal places, thereby enabling distinguishing different structural formulas having the same nominal mass. Orbitrap In an Orbitrap HRMS the ions are trapped in chamber between an inner and an outer electrode. There they oscillate along the inner electrode (Figure 2-6). FIGURE 2-6: PICTURE OF THE ORBITRAP CHAMBER (LEFT) AND THE TRAJECTORY OF AN ION IN THE ORBITRAP CHAMBER (RIGHT). The frequency of these harmonic oscillations is independent of the ion velocity but exclusively inversely proportional to the square root of the mass-to-charge ratio (m/z). Measuring the oscillation and analysing it using Fourier transformation hence gives the accurate mass of the ions. Orbitraps have a high mass accuracy (< 5 ppm), a high resolving power and a high dynamic range. Time-of-Flight Time-of-flight mass spectrometry (TOFMS) is a method of mass spectrometry in which an ion's mass-to-charge ratio is determined via a time measurement. Ions are accelerated by an electric field of known strength. This acceleration results in an ion having the same kinetic energy as any other ion that has the same charge. The velocity of the ion depends on the mass-to-charge ratio (heavier ions of the same charge reach lower speeds, although ions with higher charge will also increase in velocity). The time that it subsequently takes for the ion to reach a detector at a known distance is measured. This time will depend on the velocity of the ion, and therefore is a measure of its mass-to-charge ratio. From this ratio and known experimental parameters, one can identify the ion. As with an Orbitrap, a Time-of-
17 13 flight instrument have a high mass accuracy (< 5 ppm), a high resolving power and a high dynamic range and therefore used for accurate mass measurements and useful for the identification of unknown compounds. FIGURE 2-7: OVERWIEW OF A TIME-OF-FLIGHT INSTRUMENT. 2.6 Compound variability of the different LC-HRMS stages A lot of factors affect the degree of how sensitively individual compounds can be detected. These factors can be divided into three groups, related to stage of the LC-HRMS analysis: (i) sample preparation, (ii) chromatography and (iii) ionisation (detection). See also Figure 2.3 for the Flow Chart of an analytical procedure. While the LC-HRMS non-target screening is used for the detection of a broad range of organic compounds, the analytical conditions are not optimal for all compounds. Sjerps et al. (2016) showed that the response factors of 53 reference compounds detected in the positive ionisation mode, varied within 4 orders of magnitude and for 80% of these compounds the variation remained within 2 orders of magnitude Sample preparation Besides the concentration of the individual compounds in the water sample, sample preparation steps such as extraction (e.g. Solid Phase Extraction and Liquid-Liquid extraction) influence the recovery of compounds. Experiments at the KWR laboratory with the LC-HRMS screening method (Hogenboom et al. 2009) in drinking water spiked with 100 reference compounds selected for their relevance for surface water quality (Huijzer 2006, Jansen 2009) showed variable recoveries. For the complete list of compounds see Attachment I. A selection of these compounds is also used in the study for the correlation between physicochemical properties and the response factor. 32 of the 100 compounds studied by Jansen are not detectable by LC-HRMS due to a low recovery and/or a low sensitivity. The recoveries of the other 68 compounds were classified into four categories. This classification is presented in table 2-2. Almost half of the compounds (43%) have an acceptable recovery (75-125%). A little less compounds (40%) have a mediate recovery (10-74%). Only a small number of the compounds (15%) have a very low recovery (<10%) or a very high recovery (>125%).
18 14 TABLE 2-2 NUMBER OF COMPOUNDS CLASSIFIED IN RECOVERY CLASSES (JANSEN 2009). Recovery (%) Nr of compounds Percentage (%) <10 8 # > Sum # Recovery is 0 % Matrix effects To detect chemical compounds by LC-HRMS, the compounds must be separated by LC. In the case that compounds are too polar for separation (e.g. in the case that there is no physical interaction between the chemical compound and the stationary phase) the compound will elute unretained from the LC-column together with a lot of other polar chemical compounds such as humic acids naturally present in water. This mixture of compounds usually causes signal suppression. It is a common LC-HRMS problem and, therefore, should be evaluated with each LC-HRMS method. Evaluation of these effects provides valuable information about the quality of the LC-HRMS method Ionisation efficiency Ionisation efficiency is defined as the ratio of the number of ions generated to the number of molecules consumed in the ion source of a mass spectrometer. Ionisation efficiency is influenced by a multitude of complex processes taking place during electrospray to form a gaseous ion (see paragraph 2.5). The physicochemical properties that affect the ionisation efficiency have been sparsely studied. An overview from the literature is presented below. The relationships of pk a and pk b, the logarithmic acid and base dissociation constants, with ionisation efficiencies were described by four studies (Kruve et al. 2014, Ehrmann et al. 2008, Oss et al. 2010, Leito et al. 2008). The basicity is the ability to become protonated and become a cation. Kruve et al. (2014) observed a correlation between log IE (ionisation efficiency) and pk a, which indicates that stronger acids (lower pk a values) tend to have higher ionisation efficiencies. The extent of charge delocalization in an anion (negative ionisation) can be quantitatively expressed via the WAPS (weighted average positive sigma) parameter (Kruve et al. 2014). The WAPS is calculated with the software COSMO-RS. The smaller the WAPS value, the more delocalized the charge in the anion. Kruve et al. observed higher ionisation efficiency for ions with more efficient charge delocalisation (lower WAPS). COSMO-RS A database of 1892 compounds (solvents, small molecules) facilitates instantaneous predictions of log P, solubilities, and other properties. It is easy to add other molecules to the database with a prescribed ADF calculation. Tutorials show step-by-step how to set up COSMO-RS property calculations with the GUI. Scripting tools enable rapid solvent screening, e.g. to find the solvent combination which best partitions a drug and its main contaminant.
19 15 The importance of the charge density of the anion for ionisation is explained by two factors: the charge-to-charge repulsion and the solvation energy. The charge-to-charge repulsion is occurring on the surface of the ESI droplet and is responsible for ion evaporation from the droplets. On the other hand, lower WAPS also indicate lower solvation energy and lower tendency for ion pairing. As an ion needs to escape from the droplet to be detected in MS, the solvation energy describes how much energy is needed to overcome the attractive forces between ion and the solvent molecules. In addition, Kruve et al. (2014) observed a correlation (R 2 = 0.59) between ionisation efficiency and the number of halogen atoms in the molecule n(hal). However, also other parameters correlate with the number of halogen atoms (molecular volume was found to be correlated in a positive and WAPS in negative way). Several studies related hydrophobicity to ionisation efficiency (Cech and Enke 2000, Espinosa et al. 2015, Chalcraft et al. 2009, Henriksen et al. 2005). This parameter is characteristic for the affinity of the protonated forms toward the drops surface. A more hydrophobic compound will have an enhanced affinity for the surface of the droplets and consequently higher ionisation efficiency. However, the hydrophobicity was found not to be statistically significantly related to ionisation efficiency (Oss et al. 2010). Eight studies observed a relation between the molecular size and the ionisation efficiency. Molecular size can be characterized by molecular weight, molecular volume and molecular surface area. Generally, the larger the molecule the better stabilised its protonated form in the gaseous phase. Bigger molecules tend to have a higher ionisation efficiency (Kruve et al. 2014). Probably, ions formed from larger molecules are more favoured on the surface of the droplet, thus favouring their transfer to the gaseous phase (Kruve et al. 2014, Espinosa et al. 2015). Espinosa et al. (2015) observed an increased response factor in relation to an increased molecular weight inside a family of compounds. Hogan Jr and Fernandez de la Mora (2009) found that for more compact ions, the solvation energy (ΔG) of evaporating ions was found to be higher, therefore delaying the ion evaporation. In addition, Nguyen et al. (2013) observed a positive correlation between ESI response and adjusted mass of the ion (expressed as n(h)/n(c) x molecular mass). Chalcraft et al. (2009) and Oss et al. (2010) both observed that the ESI signal can be predicted using molecular volume. A total of 14 physicochemical properties that possibly affect the ionisation efficiency were found in literature. These physicochemical properties can be clustered into properties indicating basicity, hydrophobicity and molecular size. Logarithmic transformed values are often used to handle the variation in the values. Based on our experience with LC-HRMS, five additional physicochemical properties: (i) number of N, O, S, P and Cl, (ii) ionisation potential, (iii) electronegativity, (iv) dipole moment and (v) proton affinity, are selected to have a possibly relation with the ionisation efficiency. These parameters are labelled as expert judgement In Table 2.3. TABLE 2-3 PHYSICOCHEMICAL PROPERTIES IDENTIFIED RELATED TO IONISATION EFFICIENCY. Parameter Description Ionisation Reference mode pka Measure for acidity in Pos Oss et al., 2010 solution Neg Kruve et al., 2014 Pos Leito et al., 2008
20 16 pkb Measure for basicity in solution Pos Ehramm et al., 2008 WAPS Delocalized charge Neg Kruve et al., 2014 log P Distribution coefficient between polar and non-polar medium. Measure for hydrophobicity. Neg Henriksen et al., 2005 log D/logKow Octanol-water distribution coefficient Pos Chalcraft et al., 2009 Hydrofobicity Physical property repelled from a mass of water Pos Cech and Enke, 2000 Pos + Neg Espinosa et al., 2015 Absolute mobility (u0) - Pos Chalcraft et al., 2009 Molecular weight (mw) Weight of the molecule Pos + Neg Espinosa et al., 2015 Adjusted mass (M) n(h)/n x molecular mass Pos Nguyen et al., 2013 Polar surface area (PSA) The area of the molecule where hydrogen atoms can attach to the surface Pos + Neg Hogan et al., 2009 Length of the alkyl chain (nc) Molecular structure Neg Huffman et al., 2012 Molecular size Molecular volume of the molecule Pos Oss et al., 2010 Pos Chalcraft et al., 2009 Number of acid groups Represent the number of Neg Hellmuth C. et al (ncooh) acid (COOH) groups in the molecule Number of Double Measure for aromaticity of Pos + neg Ghosh B. et al (2015) Bond Equivalents (DBE) organic compounds. Can be calculated from the elemental composition. Number of N, O, S, P Represent the number of Pos + neg Expert judgement and Cl (nn, no, ns, np nitrogen, oxygen, sulphur, and ncl) phosphor and chlorine atoms
21 17 present in the molecule The calculated ionisation Pos + neg Expert judgement Ionisation Potential energy of the molecule to be (IP) ionised. Different calculation methods are available. The tendency to capture an Pos + neg Expert judgement electron in a gaseous state Electronegativity (e.g. Mpe) Measure for distribution of Pos + neg Expert judgement the positive and negative charges on the molecule Dipole moment (DIPOLE) Measure of gas-phase Pos + neg Expert judgement basicity. Proton affinity (PA) In addition to psysicochemical properties, other variables during the ionisation process affect the instrumental sensitivity of the individual compounds. Examples are ph, the percentage organic modifier (e.g. acetonitrile and methanol) during the LC-analysis and experimental settings like cone voltage and capillary temperature of the electrospray ionisation. The presence of specific chemical groups (e.g. nitrogen, hydroxyl) can also affect the sensitivity of the compounds. This factor is partly incorporated in the identified physicochemical properties by properties such as the length of the alkyl chain and the number of acid groups. In the SMILES notation for chemical compounds, the specific chemical groups are stored in an encrypted form. It is recommended to include the information from the SMILES notation in a possible follow-up research. SMILES notation The simplified molecular-input line-entry system (SMILES) is a specification in form of a line notation for describing the structure of chemical species using short ASCII strings. SMILES strings can be imported by most molecule editors for conversion back into two-dimensional drawings or three-dimensional models of the molecules. The original SMILES specification was initiated in the 1980s. It has since been modified and extended. In 2007, an open standard called "OpenSMILES" was developed in the open-source chemistry community. Other 'linear' notations include the Wiswesser Line Notation (WLN), ROSDAL and SLN. 2.7 Existing QSAR models A QSAR model is a regression or classification model used in the chemical and biological sciences and in engineering. Like other regression models, QSAR regression models relate a set of "predictor" variables (X) to the potency of the response variable (Y), while classification
22 18 QSAR models relate the predictor variables to a categorical value of the response variable. A literature research for models to predict the sensitivity of compounds analysed by LC-HR-MS results in some scarce information. Four models/databases were studied in more detail This is an on-line chemical database with properties of chemical compounds such as melting point, water solubility and logd. OCHEM contains experimental records for about 516 properties collected from sources. Based on the experimental data published in the OCHEM database, QSAR models for predictions of chemical properties for a set of compounds can be applied. Beside the chemical information, this database contains information and libraries about structural alerts for endpoints as mutagenicity, skin sensitization, aqueous toxicity, etc The Joint Research Centre ( JRC) QSAR Model Inventory is an inventory of information on the validity of (Q)SAR models that have been submitted to the JRC. The database is intended to help to identify valid (Q)SARs, e.g. for the purposes of REACH. The QSAR Model Reporting Format (QMRF) is a harmonised template for summarising and reporting key information on (Q)SAR models, including the results of any validation studies. The information is structured according to the OECD principles for the validation of (Q)SAR models QsarDB hosted by the Molecular Technology Group of the University of Tartu in Estonia is developing and operates domain-specific digital data exchange standards and tools that enables research groups, project teams and institutions to share and present Quantitative Structure-Activity Relationships (data and models). The QsarDB repository is designed for models produced with all statistical and mathematical algorithms that qualitatively or quantitatively express the relationship between the chemical structure and the responses of a compound. This information includes chemico-biological activity (QSAR), physicochemical properties (QSPR), toxicity (QSTR), metabolism (QSMR), reactivity (QSRR), retention (QSRR), permeability (QSPR), pharmacokinetics (QSPR), bioavailability (QSBR), binding (QSBR), etc This Danish (Q)SAR Database includes estimates from more than 200 (Q)SARs from free and commercial platforms and related to physicochemical properties, ecotoxicity, environmental fate, ADME and toxicity. (Q)SAR predictions for more than 600,000 chemical substances can be searched, sorting can be made on chemical similarity, and profiles for individual substances can be downloaded. The database is developed by the National Food Institute, Technical University of Denmark, with support from the Danish Environmental Protection Agency, the Nordic Council of Ministers and the European Chemicals Agency. These four databases particularly contain information about chemical properties and QSAR models to predict toxicity. No specific information about the relation between specific organic chemical compounds and the sensitivity under LC-HRMS conditions with electrospray ionisation was found. This result confirmed the perception that there is little information available about the relation between physicochemical properties and the MS sensitivity of a compound.
23 19 3 Analytical approach 3.1 Introduction An LC-Orbitrap MS screening was performed for a reference set of 223 compounds by KWR and a LC-Q-ToF MS screening was performed to analyze 294 compounds by Vitens. The dataset is used to study the sensitivity of about 500 different individual compounds in more detail and to predict the response factor using chemical properties. 49 compounds were analyzed both by KWR and Vitens and are used to study the influence of the different Mass Spectrometers (Orbitrap from Thermo Scientific versus Q-ToF from ABSciex) and analysis conditions on the sensitivity of the individual compounds. During the progress of the project the approach changed. First the approach was to classify a set of compounds into different chemical groups using relevant properties; analysis should be performed on a selection of compounds from each group. From the literature study more than ten properties were found to influence the response factor using electrospray ionisation (ESI). Creating classes of compounds with similar chemical properties for over 10 variables was however problematic. Therefore we changed the approach and decided not create classes beforehand. The approach proceeded with a large experimental dataset from LC- HRMS screening. The experimental data were classified into groups with different response factors. In a multivariate approach the classes with different response factors were then linked to all selected physicochemical properties. 3.2 Selection of compounds The study makes use of two datasets: target compounds analysed with LC-Orbitrap MS at the KWR laboratory target compounds analysed with LC-Q-ToF MS at the Vitens laboratory The list of 218 KWR target compounds is composed of 120 prioritized suspects (Sjerps et al. 2016), 97 compounds regularly found in surface waters (Jansen 2009) and one additional compound (pyrazole). The 120 compounds from the Sjerps study have been selected because these compounds have been prioritized from suspect screening LC-HRMS and need further confirmation of their identity with reference standards (Sjerps et al. 2016). The 97 other compounds have been selected because of their occurrence in surface water. These so called top-100 standard was analysed within each analytical LC-HRMS screening run at the KWR laboratory for the last 10 years for measurement of the recovery. Pyrazole is a recently identified substance with wide occurrence in Dutch surface waters and therefore a nice reference compound to test the applicability of the LC-HRMS screening. See Attachment II for the full list of KWR compounds. The five internal standards atrazine-d5, bentazone-d6, chloroxuron, fenuron and neburon were added to each analytical run for quantification purposes. The total list of KWR compounds covers a broad range of physicochemical properties; this is illustrated in Figure 3-1.
24 20 FIGURE 3-1 DISTRIBUTION OF A SELCTION OF SIX PHYSICOCHEMICAL PROPERTIES FOR THE COMPOUNDS ANALYSED BY KWR. logkow= octanol-water distrubution coefficient, apol=measure for polarizability, no=amount of oxygen atoms in molecule, nn=amount of nitrogen atoms in the molecule, Mpe=mean Pauling electronegativity, TopoPSA=topological polar surface area. The list of 263 Vitens compounds is composed of a selection of target compounds included in the regular LC-HRMS screening (with a Triple Quad mass spectrometer)and based on the availability of physicochemical properties. See Attachment III for the full list of Vitens compounds.
25 Analysis with LC-HRMS KWR The individual stock compounds were dissolved in acetonitrile and diluted to a concentration between 3 en 15 mg/l in a mixture of 75% water and 25% acetonitrile. The KWR compounds were analysed using direct injection of the standard, and analysed with conditions as described in Hogenboom et al (2009) and the LOA-600 protocol for LC-HRMS accurate mass screening with the Orbitrap (Thermo Scientific). The Orbitrap MS was used in the data dependent mode with a mass resolution of and with collision energy (CE) of 35% for both resolutions and CE of 65% specific for the resolution of The obtained mass spectra of the 134 prioritized suspect compounds are stored in the Massbank database. In the BTO-report of the project Bevestigen Suspects, a protocol is included with a description of how to input the MS/MS spectra of chemical compounds into Massbank. Injection of all individual compounds with and without an LC-column (Reversed Phase, Xbridge C18, particle size 3,5 µm, 2.1 x 150 mm) were performed using an injection loop of 10 µl. As internal standards to calculate a relative response, the compounds atrazine-d5, bentazon-d6 were added to all individual standards. The concentration of all internal standards was 1 mg/l. So the absolute amount of the individual compounds was ng, the 1 absolute amount of the internal standards was 1 ng. The following linear gradient was applied: starting at 5% acetonitrile/95% water with 0.1% formic acid (v/v/v) increasing to 99% acetonitrile/1% water with 0.1% formic acid in 40 min with a flow rate of 300 µl/min and a column temperature of 21 C. To study the influence of the chromatographic separation on the sensitivity of the individual compounds, all measurements are performed with direct injection and analysis with a LCcolumn. Vitens The individual stock compounds were solved in methanol or acetonitrile and diluted to a concentration between 0.5 to 1 µg/l in a solution consisting of water with acetonitrile. The compounds were analysed by LC-Q-ToF MS on an AB Sciex instrument (API 5600). The conditions are in short: ion spray voltage: 4.5 kv, LC-column: Waters, XSELECT HSS C18 (Reversed Phase), 150 x 4.6 mm, particle size 3.5 µm, column temperature: 35 C The injection volume was 1000 µl, so the absolute amount of the individual compounds is about ng. The following linear gradient was applied: starting at 1% acetonitrile/99% water with 0.1% formic acid (v/v/v) increasing to 99% acetonitrile/1% water with 0.1% formic acid in min with a flow rate of 1000 µl/min. As internal standards to calculate a relative response, the compounds atrazine-d5 (positive ionisation) and, bentazon-d6 (negative ionisation) were used.
26 Data handling The internal standards atrazine-d5 and bentazon-d6 have been used for quantification purposes from the start in 2006 of the LC-Orbitrap MS screening at KWR. Concentrations of the detected compounds are expressed in µg/l internal standard equivalents. These two compounds were also used for the present study to calculate the relative response for each analyte. The analyses with both direct injection and injection with the use of an LC-column are distributed across many measurement series that took place on different days, measured within a time period of about 2 months. Because the sensitivity of the mass spectrometer varies over time, the measured response expressed as peak area of the protonated ([M+H] + ) or deprotonated ([M-H] - ) molecules, is corrected for the response of the internal standard. This is performed by dividing the peakarea of the analyte by the peakarea of the internal standard atrazine-d5 (positive ions) or bentazone-d6 (negative ions). Adduct ions (e.g. sodium) are not registered. The relation between the sensitivity for detection and the physicochemical properties was studied using LC-HRMS screening data from 6 subsets: compounds analysed at KWR with LC-column in positive ionisation mode compounds analysed at KWR with LC-column in negative ionisation mode compounds analysed at KWR without LC-column (direct injection) in positive ionisation mode compounds analysed at KWR without LC-column (direct injection) in negative ionisation mode compounds analysed at Vitens with LC-column in positive ionisation mode compounds analysed at Vitens with LC-column in negative ionisation mode The sensitivity was linked to physicochemical properties from the following selection: A. Physicochemical properties selected from literature and expert judgement (section 2.6). B. Physicochemical properties described by 1300 descriptors calculated with the software PaDEL that were not selected from literature but show a high correlation with the response factor. The selected properties include: 1. Acidity/basicity (pka/pkb, dependent on the positive or negative ionisation)* 2. Hydrophobicity (log P) 3. Molecular weight 4. Molecular size (molecular volume) 5. Number of hydrogen atoms that can attach to the surface area (polar surface area) 6. Number of N en O, S, P and Cl atoms atoms. The number of F, Br en I atoms are not taken into account. 7. Number of acid groups 8. Ionisation potential 9. Electronegativity 10. Number of double bond units (measure for aromaticity) 11. Dipole moment 12. Proton affinity * No data could be retrieved for the pka/pkb without additional costs. Therefore, this property was skipped in this study. It is recommended to include this parameter in a possible follow-up research.
27 23 The physicochemical properties were determined either by the software package PaDEL (Yap, 2011) or MOPAC (Stewart, 1990). For the software package PaDEL, a SDF file of a compound was used as input file. The SDF files were retrieved from the CACTUS (CADD Group Chemoinformatics Tools and User Services) web server. For the software package MOPAC, MOPAC2012 was used with the following options: PM6 NOMM STATIC mullik GEO-OK. Before MOPAC was executed, the SDF files were converted to MOL files using the openbabel software package (O'Boyle et al. 2011). PaDEL is a software package for calculating molecular descriptors and fingerprints. The software currently calculates 797 descriptors (663 1D, 2D descriptors, and 134 3D descriptors) and 10 types of fingerprints. These descriptors and fingerprints are calculated mainly using The Chemistry Development Kit. Some additional descriptors and fingerprints were added, which include McGowan volume, ring counts and count of chemical substructures. MOPAC (Molecular Orbital PACkage) is a semiempirical quantum chemistry program based on Dewar and Thiel's NDDO approximation The relation between the physicochemical properties and the sensitivity was studied using the following tools: Boxplots distribution physicochemical properties for compounds that were detected and compounds that were not detected Spearman correlation coefficient Non-linear classification model Prediction of the detectability with the classification model Using visual boxplots and a statistical test (t-test) it was evaluated whether individual physicochemical properties were different between compounds that could be detected and the compounds that could not. The Spearman correlation coefficient was used to study the relationship between sensitivity and individual physicochemical properties from selection A (literature and expert judgement) and selection B (PaDEL). The Spearman rank correlation coefficient assesses how well the relationship between two variables can be described using a monotonic function (linear or not). The sensitivity of detection was expressed as the response factor (peak area normalised for the internal standard and transformed to a10-log scale). A response factor larger than zero means that the sensitivity of the compounds is larger than the internal standard. Next, the response factors of the analysed compounds were classified into two or four classes. For the two classes, the classification showed whether or not a signal will occur, whereas for the four classes, the classification also showed the magnitude of the response (Table 3-1). The combined set of physicochemical properties from selection A (literature and expert judgement) and selection B (PaDEL) was used to predict whether a compound was or was not detected with ESI (no response/response) and in which class the response factor of the chemical could be classified. The multivariate classification analysis is performed with a non-linear Gradient Boosting Classifier (Friedman, 2001) implemented in the scikit-learn machine learning toolbox of Python (Pedregosa et al., 2011). The performance is expressed
28 24 by the predictability score, determined by the performance of 50 iterations, in which for each iteration a randomly selected test set was chosen (25% of the original data set). The average R 2 of the test set for the 50 iterations was used as performance indicator. This express the fraction of well predicted classes. TABLE 3-1 CLASSIFICATION OF CHEMICALS BASED ON EXPERIMENTALLY OBTAINED RESPONSE FACTORS. Response class Response factor Pos Neg Pos Neg direct direct with LC with LC injection injection No response# 0 28% 69% 30% 70% Small response factor (<-1.5 log) 31% 17% 28% 16% Medium response factor (-1.5 log-0 log) 32% 15% 36% 14% High response factor## >1 (>0 log) 8% 2% 6% 3% # the response class no response means: no response with the used instrument, analysis conditions en concentrations of the individual compounds. With the use of another instrument, different conditions or a higher concentration of the standard, a (small) response is possible. ## the highest response factor is influenced by a lot of instrumental parameters and the used compounds. De highest response is bounded by e.g. the maximum ionisation rate and sensitivity in the mass spectrometer. Next, the obtained classification model was applied to another list of 163 chemicals that are relevant for drinking water (Baken et al. 2015) to predict their detectability. For the complete list, see attachment IV.
29 25 4 Results and discussion This chapter describes the performance of the LC-HRMS screening conducted by KWR and Vitens and whether the detectability could be predicted. 4.1 Performance of the LC-HRMS screening: internal standards The analysis of the KWR target compounds was performed during a four month period. To correct for some drift of the analyte response in time, a correction for the response for an internal standard is applied Reproducibility of the peak area The peakarea of the chromatographic peak is registrated to test the reproducibility of the three internal standards within the analytical series. The reproducibility of the peak area of the internal standards over a four month period (KWR data, subsets 1-2) is shown in Table 4-1 TABLE 4-1 REPRODUCIBILITY OF THE THREE INTERNAL STANDARDS IN LC-HRMS SCREENING. NEBURON IS USED AS AN ALTERNATIVE STANDARD FOR BOTH POSITIVE AND NEGATIVE IONISATION. Ionisation Standard LC Average STDEV Relative stdev (%) Number of mode column Peak area detections POS atrazine-d5 no 1.40E E yes 2.34E E neburon no 7.42E E yes 1.01E E NEG bentazon-d6 no 5.14E E yes 5.47E E neburon no 1.45E E yes 2.96E E a selection of neburon measurements were used. 2 this value seems unlikely. We could not found a good explanatory for this high value. The relative standard deviation was satisfactorily low for atrazine-d5 (21-26%, n= ). With the use of the LC-column, bentazon-d6 measurements had a low relative standard deviation (16%), but without LC-column the relative standard deviation is high (53%). The relative standard deviation for neburon as an alternative compound for both positive and negative ionisation is relatively high, and varies from 26% (positive ionisation with direct injection) to 59% (positive ionisation with LC-column). In Figure 4.1 the absolute peak areas of atrazine-d5 and bentazon-d6 for the analysis with and without LC-column are shown (KWR data, subsets 1-2)
30 peak area*10 8 (neg mode) peak area*10 8 (neg mode) peak area*10 8 (with LC) peak area*10 8 (with LC) 26 5 atrazin (positive mode) 0.8 bentazon (negative mode) peak area*10 8 (without LC) peak area*10 8 (without LC) FIGURE 4-1 PEAKAREA OF ATRAZINE-D5 (LEFT) AND BENTAZON-D6 (RIGHT) IN THE LC-HRMS SCREENING WITH A LC COLUMN COMPARED TO DIRECT INJECTION AT IDENTICAL CONCENTRATION LEVEL. THE DOTTED LINE IS THE 1:1 LINE. From this figure we can conclude that the averaged peak areas of atrazine-d5 with a LCcolumn were higher than peak areas with direct injection. A clear explanation of this difference in peak area could not be found. Maybe the percentage of water and the ph of the LC-eluens may play a role. For bentazon-d6, no clear differences between analysis with a LCcolumn and direct injection was observed. The peakareas in both ionisation modes must be intense to use neburon as an alternative internal standard, for both positive and negative ionisation It was concluded from the experiments that the peakarea of neburon was in the same order as the internal standards atrazine-d5 and bentazon-d6 and therefore intense enough to use this compound as an alternative internal standard. The intensity of neburon in the positive ionisation mode was about 6 times higher compared to the negative ionisation mode. This is illustrated in Figure 4.2. Neburon (with LC column) Neburon (without LC) peak area*10 8 (pos mode) peak area*10 8 (pos mode) FIGURE 4-2 PEAK AREAS OF NEBURON IN THE POSITIVE AND NEGATIVE MODE WITH THE KWR LC-HRMS SCREENING WITH USE OF THE LC COLUMN (LEFT) AND DIRECT INJECTION. THE DOTTED LINE IS THE 1:1 LINE. This results are confirmed by the Vitens data (subsets 5-6). The signal in both positive and negative ionisation is intense enough to use neburon as an internal standard. The ratio for the response positive/negative ionisation is 3:1. This difference in reponse ratio is affected by the instrument (Orbitap MS at KWR and Q-ToF MS at Vitens). See Figure 4-3.
31 27 FIGURE 4-3 PEAK AREAS OF NEBURON IN THE POSITIVE (Y-AXIS) AND NEGATIVE (X-AXIS) MODE WITH THE LC-HRMS ANALYSIS AT VITENS Reproducibility of the retention time The retention time of the five internal standards atrazine-d5, bentazon-d6, fenuron, chloroxuron and neburon over the different analytical series is very stable (KWR data, subsets 1-2). The relative standard deviation is below 2% (see Table 4-2). De two labelled standards atrazine-d5 and bentazon-d6 were used to calculate the relative repons. TABLE 4-2 REPRODUCIBILITY OF THE RETENTION TIME ( Ionisation Standard Retention STDEV Distribution (% stdev Number of detections mode time (min) from average) POS atrazine-d fenuron chlooroxuron neburon NEG bentazon-d chloroxuron neburon a selection of neburon measurements was used. 4.2 Performance of the LC-HRMS screening: studied compounds Overall, more compounds could be detected with LC-HRMS screening coupled to ESI in the positive ionisation mode than in the negative ionisation mode (Table 4-3). In the positive ionisation mode, 67% of the compounds could be detected with LC-HRMS screening and 68% could be detected by direct injection. In the negative ionisation mode above 32% could be detected with LC-HRMS screening and 33% could be detected by direct injection.
32 Response factor Response factor Response factor Response factor 28 TABLE 4-3 PERCENTAGE OF COMPOUNDS DETECTED IN THE POSITIVE AND NEGATIVE IONISATION MODE (KWR DATA, SUBSETS 1-2, N=218) Ionisation mode LC column Not detected (%) Detected (%) Not analysed (%) POS no yes NEG no yes The peak areas of the compounds were normalised relative to atrazine-d5 in the positive mode and bentazon-d6 in the negative mode. The response factors of almost 300 compounds varied between 10-6 and 10 times the internal standard (Figure 4-4-4). Less than 10% of the compounds had a response factor above 1; the ionisation efficiency of these compounds was larger than that of the internal standard. More than 90% of the compounds had a response factor below 1; this means that most of the concentrations expressed as the internal standards atrazine-d5 or bentazon-d6 were lower than the actual concentration. POS / no LC POS / LC Compounds Compounds NEG / no LC NEG / LC Compounds Compounds FIGURE 4-4 RESPONSE FACTORS OBTAINED WITH THE LC-HRMS SCREENING COUPELD TO ESI IN THE POSTIIVE (POS) AND NEGATIVE (NEG) IONISATION MODE, WITH DIRECT (NO LC) AND INDIRECT INJECTION (LC). (KWR DATA, SUBSETS 1-2) 43 compounds could not be detected at all (no signal in neither the positive nor negative ionisation mode). 17 compounds (see Table 4-4 for the list) show a (relative low) response with direct injection, while no response is observed with analysis using a LC-column, probably due to the high polarity of the compounds and as a result no retention on the LC-column. An example of this phenomena is the compound pyrazole (logkow = 0.26).
33 29 TABLE 4-4 COMPOUNDS ONLY DETECTED WITH DIRECT INJECTION (NOT WITH ANALYSIS USING A LC- COLUMN (KWR DATA, SUBSETS 1-4) Compound Positive ionisation mode Response factor (relative to internal standard) Log K ow Aminomethylphosphonic acid [AMPA] Nitrilotriacetic acid [NTA] Pyrazole Decamethylcyclopentasiloxane Aminopenicillanic acid ,4-dichlooraniline Iopamidol Iohexol Triethoxyvinylsilane ,5-Dimethyl-2,5-di(tert-butylperoxy)hexane Negative ionisation mode Amidotrizoic acid Salicylic acid-2-ethyl-1-hexyl ester Nitrilotriacetic acid [NTA] ,4-dichlooraniline Iopamidol Iohexol Monochloroacetic acid The comparison of the normalised peak areas (response factor) of the compounds in the screening with direct (without LC-column) and indirect injection (with LC column) is shown in Figure 4-5.
34 normalised peak area (with LC) normalised peak area (with LC) positive ionisation mode negative ionisation mode normalised peak area (without LC) normalised peak area (without LC) FIGURE 4-5 NORMALISED PEAK AREA (LOG SCALE) OF ALL COMPOUNDS IN THE LC-HRMS SCREENING (KWR DATA, SUBSETS 1-4) )WITH THE USE OF A LC-COLUMN COMPARED TO DIRECT INJECTION. LEFT: POSITIVE IONISATION, RIGHT: NEGATIVE IONISATION. THE DOTTED LINE IS THE 1:1 LINE. Since most compounds approached the 1:1 line, the difference in normalised peak area between direct injection and analysis with the use of a LC-column was similar, both for positive and negative ionisation. The largest part of the compounds ionised in the positive ionisation mode approach the 1:1 line; therefore most compounds had a larger peak area in the analyses with the use of a LC-column (similar to the internal standard atrazine-d5, Figure 4-1). In the negative ionisation mode, the studied compounds showed similar peak areas with direct and indirect injection (similar to bentazon-d6, Figure 4 1). 4.3 Performance of the LC-HRMS screening: Vitens and KWR compared The two datasets of Vitens and the four datasets of KWR (subsets 1-6) contain 52 identical compounds, see for more information Attachment III. In the positive ionisation mode, the Vitens response factors (obtained at a Q-TOF instrument) were generally bigger than the KWR response factors (Orbitrap instrument). Due to the limited amount of data, no clear conclusions can be drawn for the negative ionisation mode.
35 Peak area relative to average (KWR) Peak area relative to average (KWR) atrazin-d5 eq (KWR) bentazon-d6 eq (KWR) atrazin-d5 eq (Vitens) bentazon-d6 eq (Vitens) Peak area relative to average (Vitens) Peak area relative to average (Vitens) FIGURE 4-6 COMPARISON OF RESPONSE FACTORS OF DATA OBTAINED BY KWR AND VITENS, RESPECTIVELY. PEAK AREAS: RELATIVE TO INTERNAL STANDARD (ABOVE) OR AVERAGE PEAK AREA (BELOW) IN THE POSTIVE (LEFT) AND NEGATIVE (RIGHT) IONISATION MODE. 4.4 Correlation between physicochemical properties and response The 12 physicochemical properties from A (literature and expert judgement, see paragraph 3.4) in combination with the 44 physicochemical properties from selection B (best correlating from all PaDEL descriptors, see Table 4-5) were related to the response factors. Beforehand, the 12 physicochemical properties from A were tested for correlation. Molecular weight (no.3) and the number of double bond units as a measure for aromaticity (no. 10) show no correlation and were skipped. The 44 descriptors in Table 4-5 were tested for mutual correlations (orthogonality). After the removal of strongly mutually correlated descriptors (see Attachment V), 32 descriptors were used for further analysis (see final selection column in Table 4-5). In total = 41 descriptors were used for the final correlation study between physicochemical properties and response factor. From the calculated 1300 descriptors provided by the software program PaDEL, two descriptors that were not selected based on the literature survey, show a high correlation with the response: AATSC0e and GATS3e. Both descriptors are a measure for the electronegativity of the molecule.
36 32 TABLE SELECTED PHYSICOCHEMICAL DESCRIPTORS WITH DESCRIPTION AND SOURCE. Descriptors Description Source Final selection Log_Kow n-octanol/water partition Episuite Yes Log Kow coefficient measure of Hydrophobicity AlogP Ghose-Crippen LogKow PaDEL yes Henry Volatility (Henrys law constant in atm-m3/mol) Episuite yes McGowan_Volume McGowan characteristic volume PaDEL yes VABC Van der Waals volume PaDEL no, cross correlated with McGowan_Volume TopoPSA Topological polar surface area PaDEL yes DIPOLE Dipole moment MOPAC yes nhbacc Number of hydrogen bond PaDEL yes acceptors nhbacc2 Number of hydrogen bond acceptors PaDEL no, cross correlated with HBAcc nhbacc3 Number of hydrogen bond acceptors PaDEL no, cross correlated with HBAcc nhbacc_lipinski Number of hydrogen bond acceptors PaDEL no, cross correlated with HBAcc nhbdon Number of hydrogen bond donors PaDEL yes nhbdon_lipinski Number of hydrogen bond donors PaDEL no, cross correlated with HBDon nacid Number of acidic groups. PaDEL yes natom Number of atoms PaDEL no, cross correlated nheavyatom Number of heavy atoms (i.e. not PaDEL no, cross correlated hydrogen) nc Number of carbon atoms PaDEL yes nh Number of hydrogen atoms PaDEL yes nn Number of nitrogen atoms PaDEL yes no Number of oxygen atoms PaDEL yes ns Number of sulphur atoms PaDEL yes np Number of phosphorus atoms PaDEL yes nf Number of fluorine atoms PaDEL yes ncl Number of chlorine atoms PaDEL yes nbr Number of bromine atoms PaDEL yes ni Number of iodine atoms PaDEL yes nx Number of halogen atoms (F, Cl, Br, PaDEL yes I, At, Uus) TopoSPA Topological polar surface area PaDEL yes apol Sum of the atomic polarizabilities PaDEL no, cross correlated (including implicit hydrogens) Mp Mean atomic polarizabilities PaDEL yes (scaled on carbon atom) Sp Sum of atomic polarizabilities (scaled on carbon atom) PaDEL no, cross correlated with Mp MLFER_S Combined dipolarity/polarizability PaDEL yes
37 33 Descriptors Description Source Final selection IONISATION Ionisation potential MOPAC yes POTENTIAL Mi Mean first first ionisation PaDEL yes potentials (scaled on carbon atom) Si Sum of first first ionisation PaDEL yes potentials (scaled on carbon atom) Mpe Mean atomic Pauling PaDEL yes electronegativities (scaled on carbon atom) Spe Sum of atomic Pauling electronegativities (scaled on carbon atom) PaDEL no, cross correlated with Mpe HEAT OF FORMATION TOTAL ENERGY Standard enthalpy of formation or the enthalpy change to form a mole of compound at 25 o C from its elements in their standard state Sum of electronic and nuclearnuclear repulsion energies for molecules, isolated in vacuum, without vibration at 0 K MOPAC MOPAC DBE Double Bond Equavalents Xcalibur no, no correlation with response MW Molecular Weight Xcalibur no, cross correlated with number of different atoms (e.g. C, H, N,O) AATSC0e Average centered Broto-Moreau PaDEL yes autocorrelation - lag 0 / weighted by Sanderson electronegativities GATS3e Geary autocorrelation - lag 3 / weighted by Sanderson electronegativities PaDEL yes yes yes First, to find out the distinctive character of the different descriptor values, KWR compounds with and without a response were used. The results of this automated study for compounds that ionise in the positive mode are shown in Figure The results for compounds that ionise in the negative mode are shown and 4-7.
 AND WITHOUT A RESPONSE (0:BLUE) IN THE POSITIVE IONISATION MODE (KWR")
38 34 FIGURE 4-7 DISTRIBUTION (MEAN AND 90% PERCENTILE) OF SOME OF THE BEST CORRELATING DESCRIPTOR VALUES OF THE COMPOUNDS WITH A RESPONS (1: GREEN) AND WITHOUT A RESPONSE (0:BLUE) IN THE POSITIVE IONISATION MODE (KWR DATASETS).
. Most descriptor values show a large overlap in the boxplots and do not significantly differ for compounds with and without a response.")
39 35 FIGURE 4-8 DISTRIBUTION (MEAN AND 90% PERCENTILE) OF THE SOME OF THE BEST CORRELATING DESCRIPTOR VALUES OF COMPOUNDS WITH A RESPONS (1: GREEN) AND WITHOUT A RESPONSE (0:BLUE) IN THE NEGATIVE IONISATION MODE (KWR DATASETS). Most descriptor values show a large overlap in the boxplots and do not significantly differ for compounds with and without a response. The most distinctive descriptor value for positive ionisation is nhbacc, a measure for the number of Hydrogen Bond acceptors. The most distinctive descriptor value for negative ionisation is nhbdon, a measure for the number of Hydrogen Bond Donors. Probably the effect of one single descriptor value cannot be fully distinctive, since the response of a specific compound depends on multiple descriptor values (physicochemical parameters). Second, the 32 descriptors were correlated to the response factors in the six datasets (excluding the compounds without a response) as paragraph 3.4 (data handling). Figure 4-99 and Attachment VI show the correlations between the physicochemical descriptors and the LC-HRMS response (compounds with no response excluded). A correlation of 1 is a total positive linear correlation (reddish colours), a correlation of 0 is no linear correlation, whereas a correlation of -1 is a total negative linear correlation (bluish colours). The chemical descriptors on the right hand side of the figure show the largest extent of correlation with the response. The highest correlations observed are in the range of or , indicating that a single descriptor may explain at most about 40-50% of the variability of the normalized response. So there is no single descriptor that may
 BETWEEN THE SELECTED PHYSICOCHEMICAL DESCRIPTORS AND THE RESPONSE FACTOR (LEFT TO RIGHT; LOW TO HIGH CORRELATION).")
40 36 explain the variability in the normalized response to a large extent. The descriptors that show the best correlation with the response are highlighted in Figure 4-10 and Figure 4-3. FIGURE 4-9 EXTENT OF CORRELATION (EXPRESSED BY THE DETERMINATION COEFFICIENT R 2 ) BETWEEN THE SELECTED PHYSICOCHEMICAL DESCRIPTORS AND THE RESPONSE FACTOR (LEFT TO RIGHT; LOW TO HIGH CORRELATION). Average centered Broto-Moreau autocorrelation (AATSCOe, R 2 =-0.6), the number of oxygen atoms (no, R 2 =-0.63) and the number of nitrogen atoms (nn, R 2 =0.5) show the highest correlation with the response factor in LC-HRMS screening at KWR in the positive mode. The number of oxygen atoms and the number of nitrogen atoms show a negative and a positive correlation, respectively. This observation confirmed our experience that nitrogen containing compounds give a better response due to the higher proton affinity caused by the nitrogen atoms in the molecule that facilitates proton addition to form a protonated molecule ([M+H] + ). Oxygen in the form of a hydroxyl or ketone group has the opposite effect due to an increased electronegativity of the molecule. In the negative ionisation mode, ionisation potential (R 2 =0.38), the number of fluorine atoms (nf, R 2 =0.42) and Geary autocorrelation (GATS3e, R 2 =0.47) show a high correlation. The variation of the response was large for molecules that contain no fluorine atoms. However if a molecule contains one or more fluorine atoms the response was high due to the electronegativity of fluorine atoms and which facilitates hydride abstraction to form [M-H] - ions Topological polar surface area (TopoPSA, R 2 =-0.38), average centered Broto-Moreau autocorrelation (AATSCOe, R 2 =-0.41) and the mean atomic Pauling electronegativity (MPe, R 2 =-0.42) show a high correlation with responses obtained in LC-HRMS screening at Vitens in the positive ionisation mode. The response decreases when the topological polar surface area decreases, due to an increased electronegativity of the molecule. In the negative ionisation mode, ionisation potential (R 2 =0.42), mean first ionisation potentials (Mi, R 2 =0.42) and the number of acidic groups (nacid, R 2 =-0.46) show a high correlation with observed response. As expected, the response increases when the ionisation potential increases.
 IN THE SCREENING PERFORMED AT KWR.")
41 37 FIGURE 4-10 RELATION BETWEEN THE BEST CORRELATING PSYSICOCHEMICAL DESCRIPTORS AND THE RESPONSE FACTOR (LOG SCALE) IN THE POSITIVE (ABOVE) AND NEGATIVE IONISATION MODE (BELOW) IN THE SCREENING PERFORMED AT KWR. NOTE THAT A NEGATIVE NORMRESPONSE MEANS A RESPONSE LOWER THAN THE STANDARD (AS A RESULT OF THE LOG TRANSFORMATION SCALE)

 IN THE SCREENING PERFORMED AT")
42 38 FIGURE 4-3 RELATION BETWEEN THE BEST CORRELATING PHYSICOCHEMICAL DESCRIPTORS AND THE RESPONSE FACTOR (LOG SCALE) IN THE POSITIVE (ABOVE) AND NEGATIVE IONISATION MODE (BELOW) IN THE SCREENING PERFORMED AT VITENS.
43 Examples In the following section we highlight some examples comparing the response factor between related compounds. Note that this information is based on only one measurement. For more detailed conclusions, additional measurements are necessary. Atrazine and transformation products ATRAZINE DESETHYLATRAZINE DESISOPROPYLATRAZINE FIGURE 4-4 CHEMICAL STRUCTURE OF ATRAZINE AND TRANSFORMATION PRODUCTS. Atrazine shows the largest response in the positive ionisation mode, up to 80% of atrazined5 (Figure 4-13). Both desethylatrazine as well as desisopropylatrazine have a smaller response; related to the smaller molecular weight because of the loss of one ethyl-group (C2H5) and one extra methyl-ethyl-group (C3H7), see Figure As expected, the compounds were not ionised in the negative ionisation mode. FIGURE 4-5 RESPONSE FACTOR OF ATRAZINE AND DERIVATIVES
.")
.")
44 40 Diuron and transformation products Next, the herbicide diuron and its transformation products 1-(3,4-dichlorophenyl)-3- methylurea and 1-(3,4-dichloorfenyl)urea were considered, the chemical structures are presented in Figure Diuron shows the largest response in the positive ionisation mode, up to 20% of atrazine-d5 (Figure 4-). Both 1-(3,4-dichlorophenyl)-3-methylurea and 1-(3,4- dichloorfenyl)urea have a smaller response; related to the smaller molecular weight because of the loss of one or two methyl-groups (CH 3 ). The response in the negative ionisation mode shows an inversed pattern (when analysed with LC-column). DIURON 1-(3,4-DICHLOROPHENYL)-3-METHYLUREA 1-(3,4-DICHLOROPHENYL)UREA FIGURE 4-6 CHEMICAL STRUCTURESSTRUCTURE OF DIURON AND TRANSFORMATION PRODUCTS Diuron 1-(3,4-Dichlorophenyl)-3-methylurea 1-(3,4-dichloorfenyl)urea response factor no LC-column response factor with LC-column response factor no LC column response factor with LC-column POS NEG FIGURE 4-15 RESPONSE FACTOR OF DIURON AND SOME TRANSFORMATION PRODUCTS
45 41 Glymes The solvents tetraglyme, triglyme and diglyme are polyoxyethyleneglycol dimethyl ethers (glymes) of different chain lengths (Figure 4-7). We cannot observe a clear pattern of response factors for these compounds (Figure 4-87). Following direct injection the response factor of the three compounds was equal: % of that of atrazine. Following injection by LC-HRMS, the response factor of triglyme exceeds that of the two others. No response was observed for any of the glymes in the negative ionisation mode. TETRAGLYME TRIGLYME DIGLYME FIGURE 4-7 CHEMICAL STRUCTURE OF 3 POLYOXYETHYLENEGLYCOL DIMETHYL ETHERS Tetraglyme Triglyme response factor no LC-column response factor with LC-column response factor no LC column Diglyme response factor with LC-column POS NEG FIGURE 4-8 RESPONSE FACTOR OF 3 POLYOXYETHYLENEGLYCOL DIMETHYL ETHERS (GLYMES).
46 42 Alkylphosphates Triethylphosphate and tributylphosphate are esters of phosphoric acid, for the chemical structures see Figure The compound with the longest alkylchains, tributylphosphate had the highest response (Figure 4-10). Triethylphosphate had a smaller response, related to the smaller molecular weight because of the shorter chains. No response was obtained in the negative mode. TRIBUTYLPHOSPHATE TRIETHYLPHOSPHATE FIGURE 4-98 CHEMICAL STRUCTURE OF TRIBUTYLPHOSPHATE (ABOVE) AND TRIETHYLPHOSPHATE (BELOW) response factor no LC-column response factor with LC-column response factor no LC column tributyl phosphate triethyl phosphate response factor with LC-column POS NEG FIGURE RESPONSE FACTOR OF TWO ALKYLPHOSPHATES
, the retention time shows an excellent relation with the hydrophobicity (expressed as log K ow (see Fig. 4-20 the right dark red colums; KWR: R 2 =0.82, Vitens: R 2 =0.77).")
47 Relation between LC-retention time and hydrophobicity As expected from literature (Barron et al. 2016, Bade et al. 2015), the retention time shows an excellent relation with the hydrophobicity (expressed as log K ow (see Fig the right dark red colums; KWR: R 2 =0.82, Vitens: R 2 =0.77). The more hydrophobic the substance (the larger the log K ow value), the more the substance will be retained by the LC-column and the longer the retention time. FIGURE 4-20 EXTENT OF CORRELATION (EXPRESED BY THE DETERMINATION COEFFICIENT R 2 ) BETWEEN THE SELECTED PHYSICOCHEMICAL DESCRIPTORS VALUES AND THE RETENTION TIME (LEFT TO RIGHT; LOW TO HIGH CORRELATION COEFFICIENT). For all the Vitens compounds, the logkow is plotted against the retention time. logkow FIGURE 4-11 CORRELATION BETWEEN LOGKOW AND RETENTION TIME FOR THE VITENS COMPOUNDS. Although less significant, we found an additional good relation with the Henry constant (KWR: R 2 =0.38, Vitens: R 2 =0.47) as a measure for volatility both for the Vitens data and the
 HYDROPHOBICITY (LOG KOW) AND (II) VOLATILITY (HENRY CONSTANT) AND THE RETENTION TIME DETECTED IN THE LC-HRMS SCREENING BY KWR AND VITENS BOTH IN THE POSITIVE (GREEN)")
48 44 KWR data. When the Henry coefficient of a substance is high, the substance is more retained on the LC-column. FIGURE 4-22 RELATION BETWEEN (I) HYDROPHOBICITY (LOG KOW) AND (II) VOLATILITY (HENRY CONSTANT) AND THE RETENTION TIME DETECTED IN THE LC-HRMS SCREENING BY KWR AND VITENS BOTH IN THE POSITIVE (GREEN) AND NEGATIVE (BLUE) IONISATION MODE 4.5 Classification model To investigate their correlation with response, 32 physicochemical properties were selected. The selection included physicochemical properties from literature and expert judgement (selection A) and the parameters from PaDEL (selection B) that show a good correlation. These properties were used to describe whether a compound did or did not show a response with ESI (no response/response) and in which class the response factor of the chemical could be classified. The classification analysis for the KWR LC-HRMS screening data was performed for two classification schemes: Two classes: compounds with (i) no response and compounds (ii) with a response. Four classes: compounds with (i) no response, (ii) low response, (iii) medium response and (iv) high response (see table 4-6) First, the 200 compounds were classified into two classes: compounds that show a response and compounds without a response (Table 4-6). With Python a non-linear classification model was applied to predict the substance class using the 32 physicochemical descriptors. Python (programming language) Python is a widely used high-level, general-purpose, interpreted, dynamic programming language. Its design philosophy emphasizes code readability, and its syntax allows programmers to express concepts in fewer lines of code than possible in languages such as C++ or Java. The language provides constructs intended to enable writing clear programs on both a small and large scale. Python is managed by the non-profit Python Software Foundation. Three quarters of the experimental data were used to train the classification model. The predictability score was determined using a randomly selected test set including 25% of the original data set. The 50 iterations resulted in a predictability score of 79% to 81%; this
49 45 implies that whether a compound can or cannot be detected was predicted properly for 80% of the compounds. In general a R 2 of 0.7 or higher for a test set is regarded as a good performance of a statistical model (Wols et al., 2012). Note that for a classification of two classes a prediction score of 50% is equal to a random guess for response/no response, so that the prediction score of 80% is the minimum value for a good prediction model. TABLE 4-6 TWO CLASSES OF CHEMICALS BASED ON EXPERIMENTAL OBTAINED RESPONSE FACTORS. Compounds Pos no LC Neg no LC Pos with LC Neg with LC Total data set Test set No response (RF=0) With response (RF>0) R R 2 std The contribution of each descriptor to the model is shown in Attachment VII (Contribution of descriptors values in the prediction of the response factor). The contribution is expressed as the average and standard deviation of the contribution by predicting the response factor class in 50 repetitions. Most contributing descriptors were volatility (Henry), ionisation potential (Si), hydrophobicity (log Kow or AlogP), hydrogen bond donors (HBDon), number of acidic groups (nacid) and the combined dipolarity/polarizabilit (Milfer_S). Second, the compounds were classified into four classes of different response factors relative to internal standard: no response, low response, average response, high response (Table 4-7). Again, a non-linear classification model was applied to predict the substance class using the 32 physicochemical descriptors. The predictability score became 60% to 76% depending on the ionisation mode and LC column. The scores were lower than the predictability score for the two classes (80%). Here, the prediction score of 25% is equal to a random guess for a response class. The borders chosen for the small, reduced or large response are a bit arbitrary, which may explain why the model shows a reduced performance. Since the probability to predict a wrong response factor is thus 25-40%, still some improvements are required in this model to use it to predict the response class for other chemicals. Alternatively, a (non-linear) regression model could be used to directly predict the response factor instead of using classes. TABLE 4-7 FOUR CLASSES OF CHEMICALS BASED ON EXPERIMENTALLY OBTAINED RESPONSE FACTORS. Response class Response factor Pos no LC Neg no LC Pos with LC Neg with LC Total data set Test set No response 0 (no response) Small response factor (<-1.5 log) Medium response factor (<-1.5log-o log) High response factor >1 (>0 log) R R 2 std
, hydrophobicity (log Kow or AlogP), hydrogen bond donors (HBDon) and the combined dipolarity/polarizability (Milfer_S).")
50 46 The contribution of each descriptor to this model is shown in Attachment VI. Most contributing descriptors were again volatility (Henry), hydrophobicity (log Kow or AlogP), hydrogen bond donors (HBDon) and the combined dipolarity/polarizability (Milfer_S). Other contribution descriptors are the average centered Broto-Moreau autocorrelation (AATSCo) and heat of formation. 4.6 Prediction of detectability of drinking water relevant compounds Using the prediction model from section 4.5, a prediction was made for the LC-HRMS detectability of a total list of 163 drinking water relevant compounds (Baken et al. 2015). The selection was based on compounds that were detected in drinking water. From these 163 compounds, physicochemical descriptor values (necessary for the prediction of detectability) were available for 150 out of 163 compounds. The prediction (no response/response) for the 150 compounds was again performed in 50 iterations (similar as for the training of classification model described in section 4.5). From these 50 iterations, the probability to be detected is expressed as a percentage. For a probability of 20% or less it is assumed the compound has no response. A probability of over 80% indicates that the compounds have a response. The compounds for which the prediction varies over time (a probability between 20-80% ) are not reliable. In Figure 4-23is shown that 55% of the compounds can be detected in the positive mode (with a probability of more than 80%) and 25% in the negative mode (with a probability of more than 80%). In total, 65% of the 150 drinking water relevant compounds were predicted to be sensitive for detection with LC-HRMS screening coupled to ESI. FIGURE 4-23 COMPOUND DISTRIBUTION OF THE PREDICTABILITY TO GET A RESPONSE. NO RESPONS (<20%), UNKNOW (20-80%), OR RESPONSE >80% TO BE DETECTED IN THE POSITIVE AND NEGATIVE IONISATION MODES AND WITH BOTH MODES. As an example, the sensitivity of pyrazole was compared to all other compounds. Pyrazole occurred in the summer of 2015 in the river Meuse at high concentrations. The response factor of pyrazole is 12% (compared to atrazine-d5) and therefore this compound is detectable with LC-HRMS by direct injection. 25% of the compounds (54 individuals) have a larger response factor; and 75% a smaller response factor. Pyrazole could
51 Response factor (pos, no LC) 47 not be detected with analysis using a LC-column as used in this study because of the high polarity (see Table 4-4) all compounds Pyrazole Compounds FIGURE 4-24 RESPONSE FACTOR OF THE COMPOUNDS DETECTED WITH POSITIVE IONISATION MODE AND DIRECT INJECTION; RELATIVE TO PYRAZOLE.
52 48 5 Conclusions and recommendations 5.1 Conclusion The LC-HRMS analysis of almost 500 compounds showed that the response factor varied between 10-6 and 10 times that of the internal standard. More than 90% of the compounds had a response factor below 1, this means that the response is lower than the internal standard. Concentration expressed as equivalents internal standard (atrazine-d5 for positive ionisation or bentazon-d6 for negative ionisation) were generally an underestimation of the actual concentration. Correlation analysis showed that the retention time is strongly related to log K ow en the Henry constant. In the positive ionisation mode the response factors were significantly related to the number of oxygen and nitrogen atoms in the analyte, topological polar surface area and electronegativity. The number of fluorine atoms, the ionisation potential and the number of acidic groups were all significantly correlated to the response factor in the negative ionisation mode. The non-linear classification model using the 32 physicochemical descriptors was able to predict with 80% accuracy whether a compound could be detected by LC-HRMS or not. The most contributing descriptors were Henry coefficient, ionisation potential (Si), hydrophobicity (log Kow or AlogP), hydrogen bond donors (HBDon), number of acidic groups (nacid) and the combined dipolarity/polarizability (Milfer_S). Whether or not a compound belonged to a specific response factor class (no response, low, reduced and high response) could be predicted with an accuracy of 60%-76%. Since the probability to predict a wrong response factor is thus 25-40%, still some improvements are required in this model to use it to predict the response class for other chemicals. The classification model was applied to 150 drinking water relevant compounds. 65% of these compounds were predicted to be sensitive for detection with LC-HRMS screening coupled to ESI. Confirmation of the compounds, predicted to be detectable by experiments, was not performed in this study but seems reliable based on expert knowledge.
53 Recommendations We have shown that a classification model can be used for the prediction of the response factor of specific compounds analyzed by LC-HRMS with an ESI-interface. However, refinement of the model could increase the certainty of the correct prediction. Some recommendations for refinement of the model are: Collection of more measurement data; Inclusion of missing physicochemical descriptors (such as pka/pkb) in the model; Gathering more insight in the influence of matrix effects (e.g. caused by humic acids); Gathering more insight in the influence of the ph during ionisation; Gathering more insight whether water facilitate the ionisation process; Gathering more insight in the role of specific chemical groups present in the molecule (e.g. amine, hydroxyl): Next to classification of four classes, a regression analysis could be performed to predict the response factor for new chemicals.
54 50 6 Future monitoring and modeling Organic micropollutants are still a major concern for drinking water companies, recently again underlined by the high concentrations of pyrazole observed in the river Meuse water. Monitoring of drinking water sources is optimal with a complete chemical screening. This screening includes non-target screening for the detection of known and unknown compounds and effect directed screening with the use of in vitro bioassays. Modelling can improve our knowledge about the behaviour and effects of substances. In this study we developed a tool to predict the sensitivity of individual chemical compounds when analysed by non-target LC-ESI-MS screening, based on physicochemical descriptors. Besides the detection of the compounds, prediction models for the toxicity of the detected compounds and for the removal efficiency of different treatment processes to produce drinking water are important to estimate the risk of chemical compounds for drinking water production. The ultimate goal of these tools is an optimal safeguarding of the water quality of drinking water and their sources. Combining the predictive models for screening, toxicity and water treatment will be a powerful tool for water companies to directly assess the occurrence, toxicity and removal of new organic micropollutants (Baken et al and 2015).
55 51 7 References Bade R, Bijlsma L, Sancho JV, Hernández F. Critical evaluation of a simple retention time predictor based on LogKow as a complementary tool in the identification of emerging contaminants in water. Talanta 2015;139: Bade R, Bijlsma L, Miller TH, Barron LP, Sancho JV, Hernández F. Suspect screening of large numbers of emerging contaminants in environmental waters using artificial neural networks for chromatographic retention time prediction and high resolution mass spectrometry data analysis. Sci Total Environ 2015;538: Baken, K., Kools, S.,(2014). Innovative testing strategies and their relevance for evaluating chemical drinking water quality. BTO Baken, K., Schriks. M, Sjerps., R.(2015). Toxicologische risicobeoordeling geprioriteerde stoffen, BTO Barron LP, McEneff GL. Gradient liquid chromatographic retention time prediction for suspect screening applications: A critical assessment of a generalised artificial neural network-based approach across 10 multi-residue reversed-phase analytical methods. Talanta 2016;147: Chalcraft, K.R., Lee, R., Mills, C. and Britz-McKibbin, P. (2009) Virtual quantification of metabolites by capillary electrophoresis- electrospray ionisation-mass spectrometry: Predicting ionisation efficiency without chemical standards. Analytical Chemistry 81(7), Cech, N.B. and Enke, C.G. (2000) Relating electrospray ionisation response to nonpolar character of small peptides. Analytical Chemistry 72(13), Chemical Abstract Service, Dole M, Mack LL, Hines RL, Mobley RC, Ferguson LD, Alice MB (1968). "Molecular Beams of Macroions". Journal of Chemical Physics. 49 (5): Birendra N. Pramanik; A.K. Ganguly; Michael L. Gross (28 February 2002). Applied Electrospray Mass Spectrometry: Practical Spectroscopy Series. CRC Press. pp. 4. ISBN Ehrmann, B.M., Henriksen, T. and Cech, N.B. (2008) Relative Importance of Basicity in the Gas Phase and in Solution for Determining Selectivity in Electrospray Ionisation Mass Spectrometry. Journal of the American Society for Mass Spectrometry 19(5), European Chemicals Agency Information on Chemicals Espinosa, M.S., Folguera, L., Magallanes, J.F. and Babay, P.A. (2015) Exploring analyte response in an ESI-MS system with different chemometric tools. Chemometrics and Intelligent Laboratory Systems 146, Friedman, J. (2001) Greedy Function Approximation: A Gradient Boosting Machine, The Annals of Statistics, Vol. 29, No. 5, 2001.
56 52 Ghosh B, Jones AD. (2015). Dependence of negative-mode electrospray ionisation response factors on mobile phase composition and molecular structure for newly-authenticated neutral acylsucrose metabolites. Analyst, 140, Hogan Jr, CJ, Fernández De La Mora, J. (2009). Tandem ion mobility-mass spectrometry (IMS-MS) study of ion evaporation from ionic liquid-acetonitrile nanodrops. Physical Chemistry Chemical Physics, vol. 11, issue 36, Hogenboom AC, van Leerdam JA, de Voogt P. Accurate mass screening and identification of emerging contaminants in environmental samples by liquid chromatography-hybrid linear ion trap Orbitrap mass spectrometry. J Chromatogr A 2009;1216(3): Henriksen, T., Juhler, R.K., Svensmark, B. and Cech, N.B. (2005) The relative influences of acidity and polarity on responsiveness of small organic molecules to analysis with negative ion electrospray ionisation mass spectrometry (ESI-MS). Journal of the American Society for Mass Spectrometry 16(4), Hellmuth C, Weber M, Koletzko B, Peissner W. (2012). Nonesterified fatty acid determination for functional lipidomics: comprehensive ultrahigh performance liquid chromatography-tandem mass spectrometry quantitation, qualification, and parameter prediction. Anal Chem 84, Huijzer, J., (2006). samenstellen top 100 prioritaire stoffen in rivierwater, opbouwen LC-DAD database, KWR afstudeerverslag Jansen, R., (2009) Inventarisatie van frequent aanwezige stoffen in oppervlaktewater en optimalisatie van het KWR screening protocol, KWR afstudeerverslag Kruve, A., Kaupmees, K., Liigand, J. and Leito, I. (2014) Negative electrospray ionisation via deprotonation: Predicting the ionisation efficiency. Analytical Chemistry 86(10), Van Leerdam, J.A., Puijker. L.M., Hogenboom, A.C., Oomen, C.A.H.M., Gruter, H.F.M., van Genuchten C.C.A. (2008). Onderzoek naar organisc he microverontreinigingen in winningen van waterbedrijf Oasen. KWR rapport ter Laak, T.L., Puijker, L.M., van Leerdam, J.A., Raat, K.J., Kolkman, A., de Voogt, P. and van Wezel, A.P. (2012) Broad target chemical screening approach used as tool for rapid assessment of groundwater quality. Science of the Total Environment , Leito, I., Herodes, K., Huopolainen, M., Virro, K., Künnapas, A., Kruve, A. and Tanner, R. (2008) Towards the electrospray ionisation mass spectrometry ionisation efficiency scale of organic compounds. Rapid Communications in Mass Spectrometry 22(3), Nguyen, S. and Fenn, J.B. (2007) Gas-phase ions of solute species from charged droplets of solutions. Proceedings of the National Academy of Sciences of the United States of America 104(4), O'Boyle, N. M., M. Banck, C. A. James, C. Morley, T. Vandermeersch and G. R. Hutchison (2011). "Open Babel: An open chemical toolbox." Journal of Cheminformatics 3(1): 33. Oss, M., Kruve, A., Herodes, K. and Leito, I. (2010) Electrospray ionisation efficiency scale of organic compound. Analytical Chemistry 82(7), Pedregosa, F., G. Varoquaux, A. Gramfort, V. Michel, B. Thirion, O. Grisel, M. Blondel, P. Prettenhofer, R. Weiss, V. Dubourg, J. Vanderplas, A. Passos, D. Cournapeau, M. Brucher, M. Perrot
57 53 and E. Duchesnay (2011). "Scikit-learn: Machine Learning in Python." Journal of Machine Learning Research 12: Reemtsma T, Berger U, Arp HPH, Gallard H, Knepper TP, Neumann M, et al. Mind the Gap: Persistent and Mobile Organic Compounds - Water Contaminants That Slip Through. Environ Sci Technol 2016;50(19): Yap, C. W. (2011). PaDEL-descriptor: an open source software to calculate molecular descriptors and fingerprints. J Comput Chem May;32(7): Schwarzenbach, R.P.; Escher, B.I.; Fenner, K.; Hofstetter, T.B. Johnson, C.A.; von Gunten, U.; Wehrli, B. (2006). The challenge of micropollutants in aquatic systems. Science, 313, (5790), Speksnijder, P., Kolkman, A. (2012), Toepassingen van hydrophilic intercation chromatografie (HILIC) voor de analyse van zeer polaire stoffen in water. BTO Nieuwegein. KWR. Stewart, J. J. P. (1990). "MOPAC: A semiempirical molecular orbital program." Journal of Computer- Aided Molecular Design 4(1): Vughs, D. Kooij, P. Kolkman, A. (2015), HILIC sreening analyse van zeer polaire stoffen in water. BTO Nieuwegein. KWR. Wols, B. A., D. Vries and C. H. M. Hofman-Caris (2012). Removal efficiency of pharmaceuticals in drinking water production: application of QSARs. BTO (s). Nieuwegein, KWR.
58 54 Attachment I : recovery of top-100 compounds Recovery of top-100 compounds (Jansen, 2009). Isolation of the compounds with Oasis HLB. Elution with 100% acetonitrile Compound SPE Recovery (n=2) anhydro-erythromycin-a (metabolite of erythromycine) 139 ± 1 carbamazepin 131 ± 5 metoprolol 125 ± 5 trifenylfosfineoxide (=TPPO) 125 ± 5 erythromycine A 121 ± 1 pentoxifylline 118 ± 8 chloortoluron 112 ± 2 diuron 111 ± 3 isoproturon 109 ± 9 metazachloor 109 ± 11 dimethomorf 106 ± 6 terbutylazin 102 ± 3 fenazon 101 ± 0 pirimicarb 100 ± 0 dichlorprop (2,4-DP) 98 ± 0 linuron 97 ± 5 metribuzin 97 ± 5 2,4-dichloorfenoxyazijnzuur (=2,4-D) 96 ± 1 desisopropylatrazine 95 ± 1 metobromuron 95 ± 1 mecoprop [=MCPP] 93 ± 10 1-(3,4-dichloorfenyl)-3-methylureum 91 ± 6 1-(3,4-dichloorfenyl)ureum (metabolite of diuron) 91 ± 6 atrazine 91 ± 3 monuron 89 ± 8 desethylatrazine 88 ± 9 simazin 87 ± 4 tetraethyleenglycol dimethyl ether (=tetraglyme) 85 ± 28 caffeine 84 ± 2 bezafibraat 83 ± 8 metoxuron 78 ± 0 chlorpyrifos 77 ± 0 bromacil 75 ± 1 sulfadimidine 75 ± 5 ethofumesate 74 ± 10
59 55 Compound SPE Recovery (n=2) sulfamethoxazool 73 ± 6 metolachloor 72 ± 18 tri-n-butylfosfaat 70 ± 19 2,4-dichlooraniline 69 ± 7 4-chloor-2-methylfenoxyazijnzuur (=MCPA) 68 ± 6 chloridazon 68 ± 2 tris-(2-chloorpropyl)fosfaat 66 ± 9 2,6-dichloorbenzamide (=BAM) 65 ± 3 diclofenac 64 ± 10 diisobutylftalaat 61 ± 4 iopromide 56 ± 2 2,4-dichloorfenol 55 ± 5 anhydroerythromycin-b (metabolite erythromycine) 53 ± 3 2-(1,1-dimethylethyl)-4,6-dinitrofenol (=dinoterb) 50 ± 8 2-methyl-4,6-dinitrofenol (=DNOC) 50 ± 7 bentazon 50 ± 8 carbendazim 46 ± 1 2,4,6-trichloorfenol 43 ± 10 azinfos methyl 40 ± 5 dichlobenil 38 ± 17 2-aminoacetofenon 37 ± 9 triethylfosfaat 37 ± 19 2,4-dinitrofenol 36 ± 8 triethylglycol dimethyl ether (=triglyme) 31 ± 3 dicamba 13 ± 1 iomeprol 10 ± 1 iopamidol 10 ± 1 4,4'-sulfonyldifenol (=bisfenol-s) 0 bisfenol-a 0 diethyleentriaminepentaazijnzuur (=DTPA) 0 diethylene glycol dimethyl ether (=diglyme) 0 naftaleen-1-sulfonaat 0 parathion-methyl 0 sotalol 0 tetrachloor orthoftaalzuur 0
60 56 Attachment II : KWR list of studied target compounds CAS number Compound name Origin Fenuron Internal Standard Neburon Internal Standard Chlooroxuron Internal Standard Atrazine-d5 Internal Standard Bentazon-d6 Internal Standard chloordecaan Top Ethenylbenzene [Styrene] Top Desisopropylatrazine Top dicyclohexylamine Suspect ,3-diphenylguanidine Suspect Methyl Cinnamate Suspect phenoxyethyl isobutyrate Suspect n-nonylfenol Top dibutyl fumarate Suspect Dibutyl maleate, Suspect Adipic acid-di-n-butyl ester Suspect Carbendazim Top hydroxystearic acid, Suspect Di-2-ethylhexylamine Suspect Aminomethylphosphonic acid [AMPA] Top ,8-Octanedicarboxylic acid-bis-methyl ester Suspect trans-1,2-dichloroethane Top Glyphosate Top Tebuconazol Suspect diisopropyl ether (DIPE) Top Propylene glycol 1-methyl ether 2-acetate Suspect Methylbenzene [toluene] Top Chlorobenzene Top Dimethomorph (mixture of E + Z) Suspect Ethoxy ethylacetaat Suspect Sebacic acid Suspect Ethylenebis-(2-oxyethyl acetate) Suspect Methyl-10-undecenoate Suspect Di-n-octylamine Suspect Triethyl glycol dimethyl ether [Triglyme] Suspect
61 tri(ethylene glycol) monoethyl ether Suspect N,N-dimethyl-tetradecylamine Suspect erythromycin Top Tris(2-chloorethyl)fosfaat Suspect diethylhexyl phthalate [DEHP] Top Bis(methylglycol) phthalate Suspect Amidotrizoic acid Top Salicylic acid-2-ethyl-1-hexyl ester Suspect dichlobenil Top Fipronil Suspect dichloorprop Top Methoxy-5-methylaniline Suspect ,4-dichlorophenol Top simazin Suspect/Top ,3,(6of7)naftaleentrisulfonzuur, trinazout Top Azelaic acid Suspect Phosphoric acid, 2-ethylhexyl ester Suspect Tributyl phosphate Suspect/Top tetrachloroethene Top Solvent Green 3 Suspect Ftaalzuur, bis-allylester Suspect Fludioxonil Pestanal Suspect Tris-(2-chloroisopropyl) phosphate Suspect Valsartan Suspect Irbesartan Suspect Nitrilotriacetic acid [NTA] Top tert-octylphenol Top (1,1-dimethylethyl)-4,6-dinitrophenol Top 100 [dinoterb] Tetraethyleen glycol dimethyl ether Suspect Kresoxim-Methyl Suspect Ethyleendiaminetetra-acetic acid [EDTA] Top monuron Top Citronellyl acetate Suspect Methyl benzoylformate Suspect Diclofenac Top chloortoluron Top Carbofuran Suspect p-phenetidine Suspect cis-1,2-dichloroethene Top Dodemorph Suspect Fenamidone Suspect Methyl tertiair-butylether [MTBE] Top dipropylmalonic acid Suspect N-phenylbenzenesulphonamide Suspect
62 Chloridazon Suspect/Top Methyl (R)-(+)-lactate Suspect Heptadecafluorooctanesulfonic acid Suspect undecanedioic acid Suspect Atrazine Top metoxuron Top BAM Top metribuzin Top Pirimicarb Top (3,4-dichloorfenyl)urea Top ,4-Epoxycyclohexylmethyl 3,4- Suspect epoxycyclohexanecarboxylate ,4-Butanediol diglycidyl ether Suspect aminoundecanoic acid Suspect undecyl cyanide Suspect ,6-diisopropylaniline Suspect ,6,9-Triethyl-3,6,9-trimethyl-1,4,7- Suspect triperoxonane bentazon Suspect/Top Gemfibrozil Suspect Etridiazole Top Ethofumesate Top ,2-Benzisothiazol-3(2H)-one Suspect octyl-2-pyrrolidinone Suspect H-benzotriazool Suspect (-)-Methyl L-lactate Suspect Irgarol Suspect Diacetone acrylamide Suspect pyrazole chloorpyrifos Top Parathion-Methyl Top Carbamazepine Top Methyl-1H-Benzotriazole Suspect ,1-Di(tert-butylperoxy)cyclohexane Suspect metobromuron Top bromacil Top ,6-diethoxytetrahydropyran Suspect diethyl diallylmalonate Suspect tert-butylcyclohexyl acetate Suspect trimethylolpropane trimethacrylate Suspect Diuron Top linuron Top Perfluoroctaanzuur Suspect Isoproturon Top (3,4-Dichlorophenyl)-3-methylurea Top 100
63 N-n-Butylbenzenesulfonamide Suspect Carbamazepine 10,11-Epoxide Suspect metoprolol Suspect/Top Sotalol Top isophorone diisocyanate Suspect bezafibraat Top (Dimethylaminomethyl)-1-cyclohexanone Suspect hydrochloride Phenylsulfonaniline Suspect MAES Suspect Neodecanoic acid-ethenyl ester Suspect Piperonylbutoxide Suspect metolachloor Suspect/Top hydroxy-2,2,6,6-tetramethylpiperidine-1- Suspect ethanol DNOC Top Decamethylcyclopentasiloxane Suspect Musk MC4 Suspect Aminopenicillanic acid Suspect aminoacetofenon Top ,4-dichlooraniline Top cyclic 3-(1,2-ethanediylacetale)-estra- Suspect 5(10),9(11)-diene-3,17-dione tetrachloromethane Top Benzylacrylicacid Suspect caffeïne Suspect/Top isobornyl acrylate Suspect terbutylazin Suspect/Top iopamidol Top oxazepam Suspect fenazon Suspect/Top Propanoic acid, 2-hydroxy-, (1R,2S,5R)-5-methyl- Suspect 2-(1-methylethyl)cyclohexyl ester, (2S) Desethylatrazine Top ethyl methyl carbonate Suspect Aniline Top dibromoacetic acid Top Ethyl-tertiair-butylether [ETBE] Top ARTEMISININ, Suspect ,4-pentamethylene-2-pyrrolidinone Suspect Pentoxifylline Top ,9-di-(3-cyclohexenyl)-2,4,8,10- Suspect tetraoxaspiro(5,5)undecane Iohexol Top Metazachlor Top Diethylenetriaminepentaacetic acid [DTPA] Top 100
64 Trichloromethane [chloroform] Top methacrylic acid-2-ethylhexyl ester Suspect diisopropyl adipate Suspect ,2-diacetylbenzene Suspect mecoprop (MCPP) Suspect/Top diethylene glycol dimethyl ether [diglyme] Benzene Top ,1,1-trichloroethane sulfametoxazool Top diethylene glycol butyl ether Suspect Iopromide Top ,8-dimethoxy-1,3-dihydro-2H-3-benzazepin-2- Suspect one butyl glycolate Suspect Docusate Potassium Suspect dichloromethane Top tribromomethane = bromoform Top bromodichloromethane Top isobornyl methacrylate Suspect ,4-dichlorophenoxyacetic acid [2,4-D] Top trichloroacetic acid [TCA] Top triethyl citrate Suspect Triethoxyvinylsilane Suspect triethyl phosphate Suspect ,5-Dimethyl-2,5-di(tert-butylperoxy)hexane Suspect trichloroethene Top monochloroacetic acid Top TPPO Suspect/Top dichloroacetic acid Top Bisphenol-A Top ,4'-sulphonyldiphenol = bisfenol-s Suspect/Top Musk Ketone Suspect etridiazool Suspect ,2,6,6-tetramethyl-4-piperidone Suspect hydroxyquinaldine Suspect Acetamidoantipyrine Suspect diethyl phthalate [DEPH] Top phthalic acid, bis-iso-butyl ester Suspect phthalic acid, bis-n-butyl ester Suspect/Top naftaleen-1-sulfonzuur Top ,3-Diethyl-1,3 diphenylurea Suspect azinfos-methyl Top ,4,6-trichloorfenol Top myclobutanil Suspect menthyl Acetaat Suspect
65 Ethyl (R)-2-hydroxy-4-phenylbutyrate, Suspect ,4'-dichlorobenzophenone Suspect naphthalene Top diisopropyl succinate Suspect o-phenetidine Suspect chloro-2-methylphenoxyacetic acid [MCPA] Suspect/Top ,2-dichlorobenzene Top methyl (r)-2-(4-hydroxyphenoxy)propionate Suspect N-lauroylsarcosine Suspect isopropylbenzene [Cumol] Top flumetsulam Suspect ethoprofos safrole Suspect chloro-5,10-dihydro-11Hdibenzo[b,e][1,4]diazepin-11-one Suspect [4-(2-Methoxyethyl)phenoxy]-2,3-epoxypropane Suspect (difluoromethoxy)-1H-benzimidazole-2-thiol Suspect
66 62 Attachment III Vitens list of studied target compounds CAS number compound name Pentoxifylline Acetaminophen Quizalofop-P-Ethyl Atrazinee-desisopropyl Cyclamate Sulfachloropyridazine Diuron Malachite green Mesotrione Mesotrione iodo-2-propynyl N-butylcarbamate Tamoxifen Clodinafop-propargyl Tebuconazole Mepanipyrim Dimethomorph Cyanazine Chlortoluron Omethoate Thiacloprid Nicosulfuron Chlorsulfuron Erythromycin Propoxur Losartan Aldicarb Tebufenpyrad Difenoconazole Simazine Fipronil Cyazofamid Azimsulfuron Dichlorprop Amidosulfuron Cyprodinil
67 Sulfadimethoxin Fenitrothion octyl-4-isothiazoline-3-one CPA Rimsulfuron Acetochlor Pymetrozine Metconazole Primidone Propyphenazone Triflusulfuron-methyl Fenhexamid Sulfamerazine Carfentrazone-ethyl Sulfamethoxazole Propranolol Azoxystrobin Chlorbromuron Epoxiconazole Pindolol Desmedipham Phenmedipham aminobenzothiazole Lidocaine chloro-2-methyl-4-isothiazolin-3-one Valsartan Imidacloprid Propazine Tylosin Sulfosulfuron Dinoterb Flufenacet Kresoxim-methyl Flumequine Oxasulfuron Sulfapyridine Oxolinic acid Thiabendazole Oxymetazoline Monuron Cefuroxime Diclofenac Lincomycin Capecitabine
68 Carbofuran Flonicamid Alachlor Carbetamide Aldicarb-sulfone Hydroxycarbofuran Bromoxynil Chloridazone Ketoprofen Foramsulfuron Foramsulfuron Indoxacarb Monolinuron Pyraclostrobin PFOS Salbutamol Boscalid Atrazinee Trietazine Dicamba Propachlor Benzthiazuron Amiodarone Oseltamivir Methomyl Metoxuron Methiocarb Mesosulfuron-Methyl Metribuzin Acetylsulfamethoxazole Fluometuron Fenamiphos Oxamyl Heptenophos Phosphamidon Propyzamide Triazophos Pinoxaden Bentazone Benazolin-ethyl Gemfibrozil Naproxen Ethofumesate Amoxicillin
69 Sotalol Irgarol Pirimiphos-methyl Demeton-O Carbamazepine Ethiofencarb Metobromuron Paraoxon-ethyl Mebendazole Bromacil Fenoprofen Asulam PFOA Isoproturon Butocarboxim Butoxycarboxim Imazalil Fluoxastrobin Ifosfamid Metoprolol Etrimfos Dinoseb Tolyltriazole Pendimethalin Metamitron Bupirimate Bezafibrate Benzothiazolin Terbutaline Fenofibrate Cyclophosphamide Clenbuterol Hexazinone Carbaryl ,4-Dinitrophenol Flucloxacillin Trichlorfon Prosulfocarb Pyrimethanil Estrone DNOC Indometacin Aspartame Aspartame
70 Furosemide Bitertanol Dimetridazole Triadimenol Tiamulin Triclopyr Fenthion Pyridate Metolachlor Sucralose Linuron Fluoxetine Furalaxyl Sulfadimidine Metalaxyl Chloramphenicol Cymoxanil Ibuprofen Terbutylazine Sulfaquinoxaline Propiconazole Tetracycline Phenazone Atenolol (methylthio)benzothiazole Oxytetracycline Cloxacillin Atrazinee-desethyl Phenacetin Iopamidol Carbendazim Betaxolol Clofibrate Pencycuron Iohexol Penconazole Flutolanil Oxacillin Oxacillin Fenpropidin Fenpropimorph Hydramethylnon Prochloraz Sulfadiazine
71 Triflumizol Fluroxypyr Fluazifop-butyl Norfloxacin Mecoprop Caffeine Chlortetracycline Ceftazidime Sebuthylazine Prometryn Iopromide Trimethoprim Enoxacin Metsulfuron-methyl Enalapril Ronidazole Oxadixyl Iomeprol Triphenylphosphine oxide Thifensulfuron-methyl Fluazinam Simvastatin Dapson Saccharin Clarithromycin Clomazone Triasulfuron Diflufenican Ofloxacin Azithromycin Ciprofloxacin Diethofencarb Dimethenamid Fenoxaprop-ethyl Clofibric acid Nitrophenol Quinmerac Demeton-S-methyl Enrofloxacin Fenoprop Prosulfuron DEET Cyproconazole MCPA
72 MCPB ,4-DB Paraoxon-methyl Iopanoic acid Fosthiazate Sulcotrione Cloquintocet-mexyl Metronidazole
73 69 Attachment IV List of compounds relevant to drinking water CAS number Compound name Use MTDC pharmaceutical Benzene, ethenyl- [styrene] industrial Hexamine [urotropin] industrial Guanidine, N,N -diphenyl- industrial Acetamide, N-(4-hydroxyphenyl)- pharmaceutical Carbendazim pesticide Benzene, 1,4-dimethyl- industrial Benzenamine, 4-chloro- industrial Aminomethylphosphonic acid [AMPA] pesticide Ethane, 1,2-dichloro- industrial Glycine, N-(phosphonomethyl)- [glyphosate] pesticide Tebuconazole pesticide Propane, 2,2 -oxybis- industrial Benzene, 1,3-dimethyl- industrial Benzene, methyl- [toluene] industrial Phenol industrial Methane, dimethoxy- industrial Furan, tetrahydro- industrial Dimethomorph pesticide Cyclohexane industrial Ethane, 1,1 -oxybis[2-methoxy- [diglyme] industrial Nicosulfuron pesticide ,5,8,11-Tetraoxadodecane [triglyme] industrial Benzoic acid, 3,5-bis(acetylamino)-2,4,6-triiodo- [amidotrizoic contrast medium acid] Anthracene industrial ,3-Propanedione, 1,3-diphenyl- industrial Benzothiazole, 2,2 -dithiobis- industrial Benzene, 1,2,4-trichloro- industrial Simazine pesticide Acetic acid, (4-chlorophenoxy)- pesticide ,4-Dioxane industrial Methane, dibromochloro- industrial Primidone pharmaceutical Phosphoric acid, tris(2-methylpropyl) ester industrial Phosphoric acid tributyl ester industrial
74 Ethene, tetrachloro- industrial Folpet pesticide Propanol, 1-(2-methoxypropoxy)- industrial Diethyl toluamide [DEET] pesticide Propanol, 1-chloro-, phosphate (3:1) industrial H-Benzotriazole, 5-methyl- industrial Glycine, N,N-bis(carboxymethyl)- [nitrolotriacetic acid] industire Dinoterb pesticide ,5,8,11,14-Pentaoxapentadecane [tetraglyme] industrial Thiabendazole pesticide (3H)-Benzothiazolethione pesticide ,2,5,5-Tetramethyl-tetrahydrofuran industrial Metolachlor OA metabolite Diclofenac pharmaceutical Ethene, 1,2-dichloro-, (Z)- industrial Ethene, 1,2-dichloro-, (E)- industrial Alachlor pesticide Ether, methyl tert-butyl [MTBE} industrial Dimethenamid-P pesticide Aldicarb sulfoxide pesticide Chloridazon pesticide Metolachlor ESA metabolite Desphenylchloridazon, methyl- metabolite Acetochlor ESA sodium salt pesticide Propachlor pesticide ,6-Dichlorobenzamide pesticide Dimethenamid ESA metabolite Ketoprofen pharmaceutical Oxamyl pesticide exo-1,2,7,7-tetramethylbicyclo[2.2.1]heptan-2-ol natural origin Urea, N,N'-dicyclohexyl- pharmaceutical Propamocarb pesticide Bentazone pesticide Gemfibrozil pharmaceutical Ethazole pesticide ,2-Benzisothiazol-3(2H)-one pesticide Tramadol pharmaceutical Ioxitalamic acid contrast medium H-Benzotriazole, 4(or 5)-methyl- industrial Carbamazepine pharmaceutical H-Benzotriazole, 4-methyl- industrial Benzamide, 2-amino-N-(1-methylethyl)- metabolite Butanedioic acid, 2,3-dimercapto-, (R*,S*)- pharmaceutical ,4(1H,3H)-Pyrimidinedione, 5-bromo-6-methyl-3-(1-methylpropyl)- pesticide
75 71 [bromacil] Fenoprofen pharmaceutical Diuron pesticide Linuron pesticide Mevinphos, trans-isomer pesticide Isoproturon pesticide Butocarboxim pesticide Butoxycarboxim pesticide Carbamazepine 10,11-epoxide metabolite Metoprolol pharmaceutical Thiofanox sulfoxide pesticide Sulfamide, N,N-dimethyl- metabolite H-Benzotriazole, 5,6-dimethyl- industrial Sulfamic acid, N-cyclohexyl- food ingredient Propyphenazone pharmaceutical Fenofibrate pharmaceutical H-Indene, 2,3-dihydro- industrial Aspirin pharmaceutical Metolachlor pesticide Dikegulac sodium pesticide Propranol pharmaceutical Estrone natural origin Furosemide pharmaceutical Tiamulin pharmaceutical Acesulfame-K food ingredient Sucralose food ingredient Adenosine 5 -(tetrahydrogen triphosphate) [ATP] natural origin Chlortetracycline pharmaceutical Sulfadimidine pharmaceutical Caffeine food ingredient Theophylline pharmaceutical Hydrochlorothiazide pharmaceutical Ioxaglic acid contrast medium Terbutylazine [TBA} pesticide Ethylenediaminetetraacetic acid [EDTA] industrial Oxazepam pharmaceutical Phenazone pharmaceutical Pencillin G pharmaceutical Sulthiame pharmaceutical Paroxetine pharmaceutical Benzenamine [aniline] industrial Methanamine, N-methyl-N-nitroso- [NDMA] industrial Iopamidol contrast medium Acetic acid, dibromo- pharmaceutical
76 Carbaryl pesticide Desphenylchloridazon metabolite Metformin pharmaceutical Iohexol contrast medium Glycine, N,N-bis 2- bis(carboxymethyl)amino ethyl - industrial Acetone industrial Methane, trichloro- [chloroform] industrial Ethane, hexachloro- industrial Melamine, hexa(methoxymethyl)- industrial Benzoic acid, 2-hydroxy- pharmaceutical Mecoprop (racemate) pesticide Ethane, 1,1,1-trichloro- industrial Iopromide contrast medium Methane, dibromo- industrial Ethene, chloro- [vinyl chloride] industrial Methane, dichloro- industrial Methane, tribromo- [bromoform] industrial Methane, bromodichloro- industrial Ethene, 1,1-dichloro- industrial Methane, bromotrichloro- industrial Acetic acid, trichloro- industrial Phosphoric acid, triethyl ester industrial Iomeprol contrast medium Propane, 1,2-dichloro- industrial Ethane, 1,1,2-trichloro- industrial Ethene, trichloro- industrial Acetic acid, chloro- industrial Phosphine oxide, triphenyl- [TPPO] industrial Acetic acid, dichloro- industrial Acetamidoantipyrin metabolite Diethyl phthalate industrial Clofibric acid pesticide Naphthalene industrial Propanoic acid, 2-(4-chloro-2-methylphenoxy)- pesticide Acetic acid, (4-chloro-2-methylphenoxy)- [MCPA] pesticide H-Benzotriazole industrial Benzene, 1,2-dichloro- industrial Benzenamine, 2-chloro- industrial Propane, 1,2,3-trichloro- industrial Sulcotrione pesticide Multiple Gadolinium compounds contrast medium
77 73 Attachment V : compared response of Vitens and KWR Response factors in the positive ionisation mode (atrazine-d5 eq.) in the LC-HRMS screening by Vitens and KWR. Response factors in the positive ionisation mode (atrazine-d5 eq.) Peak area relative to internal standard Peak area relative to the average peak area Component Vitens KWR Vitens KWR 1-(3.4-dichlorophenyl)-3-methylurea Benzothiazolin-3-one Diethyl-1.3-diphenylurea diphenylguanidine Dichlorobenzamide (BAM) Atrazinee Atrazinee-desethyl Atrazinee-desisopropyl Bezafibrate Caffeine Carbamazepine Carbamazepine epoxide Carbendazim Carbofuran Chloridazone Chlortoluron Diclofenac Di-glyme Dimethomorph-A Dimethomorph-B Diuron Dodemorph-A Dodemorph-B Erythromycin Ethofumesate Iohexol Iopamidol Iopromide Iopromide Irbesartan Irgarol Isoproturon Kresoxim-methyl Linuron Metobromuron Metolachlor
78 74 Response factors in the positive ionisation mode (atrazine-d5 eq.) Peak area relative to internal standard Peak area relative to the average peak area Component Vitens KWR Vitens KWR Metoprolol Metoxuron Metribuzin Monuron Pentoxifylline Phenazone Piperonyl-butoxide Simazine Sotalol Sulfamethoxazole Tebuconazole Terbutylazine Tetra-glyme Tri-glyme Triphenylphosphine oxide Valsartan

79 75 Normalised (relative to internal standard atrazine-d5) and log transformed response compared for Vitens and KWR; LC-HRMS screening in the positive ionisation mode.
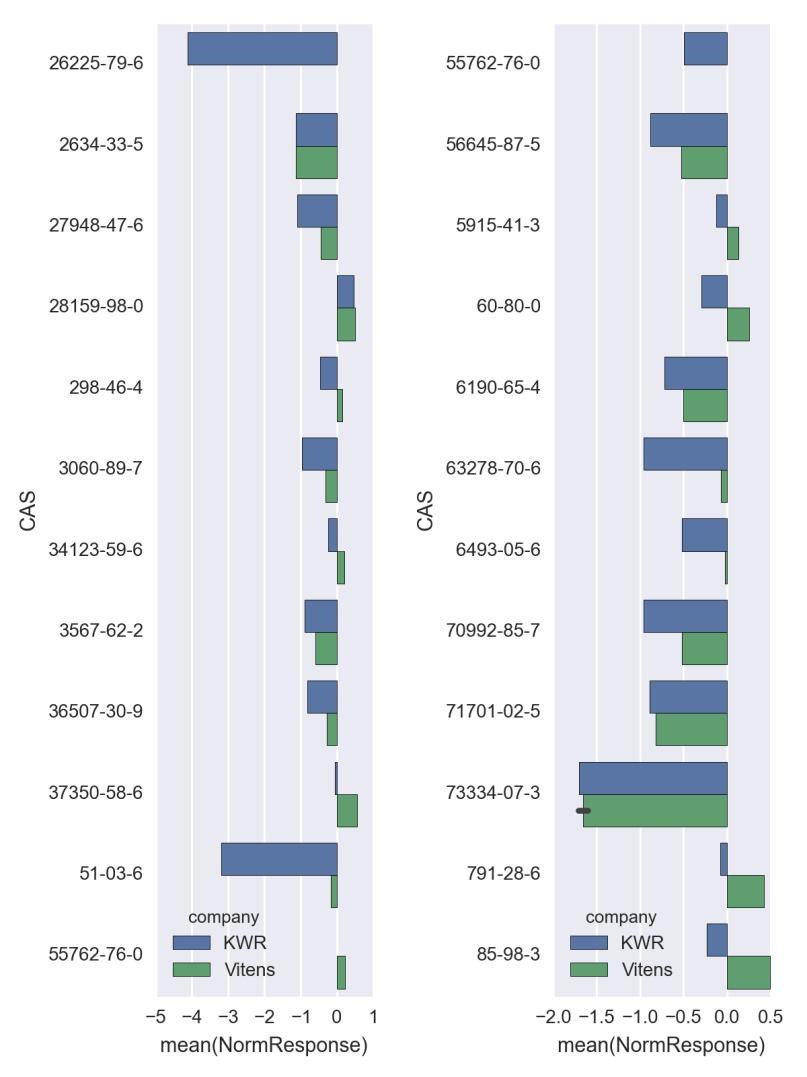
80 76
81 77 Response factors in the negative ionisation mode (bentazond6 eq.) for the LC-HRMS screening by Vitens and KWR. Response factors in the negative ionisation mode (bentazon-d6 eq.) Peak area relative to the internal standard Peak area relative to the average peak area Component Vitens KWR Vitens KWR Bentazone Bromacil Dichlorprop Dinoterb Fipronil Fludioxonil Gemfibrozil MCPA Mecoprop (MCPP) PFOA PFOS

82 78 Figure: Normalised (relative to internal standard bentazon-d6) and log transformed response compared for Vitens and KWR; LC-HRMS screening in the negative ionisation mode

83 79 Attachment VI Correlation of the different descriptor values Starting set of descriptors:

84 80 Descriptor set after removing strongly related descriptors:
85 81 R 2 of descriptors to response in six datasets: Company KWR KWR Vitens KWR KWR Vitens Ionisation mode neg neg neg pos pos pos Number of compounds LC column Without LC With LC With LC Without LC With LC With LC AATSC0e DIPOLE GATS3e HEAT OF FORMATION Henry IONISATION POTENTIAL MLFER_S McGowan_Volume Mi Mp Mpe Si TOTAL ENERGY TopoPSA log Kow nacid narombond nb nbr nc ncl nf nh nhbacc nhbdon ni nn no np ns nx naaromatom

 Negative ionisation mode with LC-column")
86 82 Attachment VII Contribution of descriptors values in the prediction of the response factor Positive ionisation mode with LC-column (2 classes) Negative ionisation mode with LC-column (2 classes)

")
87 83 Positive ionisation mode, direct injection (2 classes) Negative ionisation mode, direct injection (2 classes)
 Negative ionisation mode with LC-column (4")
88 84 Positive ionisation mode with LC-column (4 classes) Negative ionisation mode with LC-column (4 classes)
.")
89 85 Positive ionisation mode, direct injection (4 classes). Negative ionisation mode, direct injection (4 classes)
BE Nanoregistry Annual Public Report
 1 BE Nanoregistry Annual Public Report Carine Gorrebeeck FPS Health, Food Chain Safety & Environment 2 WHY? The objectives of the registry (a.o.): - Traceability: allow competent authorities to intervene
SAMPLE 11 = + 11 = + + Exploring Combinations of Ten + + = = + + = + = = + = = 11. Step Up. Step Ahead
 7.1 Exploring Combinations of Ten Look at these cubes. 2. Color some of the cubes to make three parts. Then write a matching sentence. 10 What addition sentence matches the picture? How else could you
MyDHL+ Van Non-Corporate naar Corporate
 MyDHL+ Van Non-Corporate naar Corporate Van Non-Corporate naar Corporate In MyDHL+ is het mogelijk om meerdere gebruikers aan uw set-up toe te voegen. Wanneer er bijvoorbeeld meerdere collega s van dezelfde
Invloed van het aantal kinderen op de seksdrive en relatievoorkeur
 Invloed van het aantal kinderen op de seksdrive en relatievoorkeur M. Zander MSc. Eerste begeleider: Tweede begeleider: dr. W. Waterink drs. J. Eshuis Oktober 2014 Faculteit Psychologie en Onderwijswetenschappen
FOR DUTCH STUDENTS! ENGLISH VERSION NEXT PAGE. Toets Inleiding Kansrekening 1 8 februari 2010
 FOR DUTCH STUDENTS! ENGLISH VERSION NEXT PAGE Toets Inleiding Kansrekening 1 8 februari 2010 Voeg aan het antwoord van een opgave altijd het bewijs, de berekening of de argumentatie toe. Als je een onderdeel
Add the standing fingers to get the tens and multiply the closed fingers to get the units.
 Digit work Here's a useful system of finger reckoning from the Middle Ages. To multiply $6 \times 9$, hold up one finger to represent the difference between the five fingers on that hand and the first
Introductie in flowcharts
 Introductie in flowcharts Flow Charts Een flow chart kan gebruikt worden om: Processen definieren en analyseren. Een beeld vormen van een proces voor analyse, discussie of communicatie. Het definieren,
Lichamelijke factoren als voorspeller voor psychisch. en lichamelijk herstel bij anorexia nervosa. Physical factors as predictors of psychological and
 Lichamelijke factoren als voorspeller voor psychisch en lichamelijk herstel bij anorexia nervosa Physical factors as predictors of psychological and physical recovery of anorexia nervosa Liesbeth Libbers
Het Effect van Verschil in Sociale Invloed van Ouders en Vrienden op het Alcoholgebruik van Adolescenten.
 Het Effect van Verschil in Sociale Invloed van Ouders en Vrienden op het Alcoholgebruik van Adolescenten. The Effect of Difference in Peer and Parent Social Influences on Adolescent Alcohol Use. Nadine
Laboratory report. Independent testing of material surfaces. Analysis of leaching substances in treated wood samples conform guide line EU 10/2011
 Independent testing of material surfaces Laboratory report Analysis of leaching substances in treated wood samples conform guide line EU 10/2011 Customer Wasziederij De Vesting BV Trasweg 12 5712 BB Someren-Eind
Beïnvloedt Gentle Teaching Vaardigheden van Begeleiders en Companionship en Angst bij Verstandelijk Beperkte Cliënten?
 Beïnvloedt Gentle Teaching Vaardigheden van Begeleiders en Companionship en Angst bij Verstandelijk Beperkte Cliënten? Does Gentle Teaching have Effect on Skills of Caregivers and Companionship and Anxiety
5/2/2011 Understanding Clouds Clouds form as warm air is forced upward As the air is forced upward, it expands and cools 1
 Understanding Clouds Clouds form as warm air is forced upward As the air is forced upward, it expands and cools 1 Understanding Clouds As the air cools, the relative humidity reaches 100% Water vapor begins
Tentamen T1 Chemische Analysemethoden 6 maart 2014
 Tentamen T1 Chemische Analysemethoden 6 maart 2014 Naam: Student nummer: Geef uw antwoord op dit papier. U mag uw tekstboek, aantekeningen, liniaal en een rekenmachine gebruiken. 1) De stralingsdosis van
Pesten onder Leerlingen met Autisme Spectrum Stoornissen op de Middelbare School: de Participantrollen en het Verband met de Theory of Mind.
 Pesten onder Leerlingen met Autisme Spectrum Stoornissen op de Middelbare School: de Participantrollen en het Verband met de Theory of Mind. Bullying among Students with Autism Spectrum Disorders in Secondary
Process Mining and audit support within financial services. KPMG IT Advisory 18 June 2014
 Process Mining and audit support within financial services KPMG IT Advisory 18 June 2014 Agenda INTRODUCTION APPROACH 3 CASE STUDIES LEASONS LEARNED 1 APPROACH Process Mining Approach Five step program
Group work to study a new subject.
 CONTEXT SUBJECT AGE LEVEL AND COUNTRY FEATURE OF GROUP STUDENTS NUMBER MATERIALS AND TOOLS KIND OF GAME DURATION Order of operations 12 13 years 1 ste year of secundary school (technical class) Belgium
LONDEN MET 21 GEVARIEERDE STADSWANDELINGEN 480 PAGINAS WAARDEVOLE INFORMATIE RUIM 300 FOTOS KAARTEN EN PLATTEGRONDEN
 LONDEN MET 21 GEVARIEERDE STADSWANDELINGEN 480 PAGINAS WAARDEVOLE INFORMATIE RUIM 300 FOTOS KAARTEN EN PLATTEGRONDEN LM2GS4PWIR3FKEP-58-WWET11-PDF File Size 6,444 KB 117 Pages 27 Aug, 2016 TABLE OF CONTENT
Impact en disseminatie. Saskia Verhagen Franka vd Wijdeven
 Impact en disseminatie Saskia Verhagen Franka vd Wijdeven Wie is wie? Voorstel rondje Wat hoop je te leren? Heb je iets te delen? Wat zegt de Programma Gids? WHAT DO IMPACT AND SUSTAINABILITY MEAN? Impact
De Relatie tussen Werkdruk, Pesten op het Werk, Gezondheidsklachten en Verzuim
 De Relatie tussen Werkdruk, Pesten op het Werk, Gezondheidsklachten en Verzuim The Relationship between Work Pressure, Mobbing at Work, Health Complaints and Absenteeism Agnes van der Schuur Eerste begeleider:
Four-card problem. Input
 Four-card problem The four-card problem (also known as the Wason selection task) is a logic puzzle devised by Peter Cathcart Wason in 1966. It is one of the most famous tasks in the study of deductive
Running head: BREAKFAST, CONSCIENTIOUSNESS AND MENTAL HEALTH 1. The Role of Breakfast Diversity and Conscientiousness in Depression and Anxiety
 Running head: BREAKFAST, CONSCIENTIOUSNESS AND MENTAL HEALTH 1 The Role of Breakfast Diversity and Conscientiousness in Depression and Anxiety De Rol van Gevarieerd Ontbijten en Consciëntieusheid in Angst
Eye Feature Detection Towards Automatic Strabismus Screening
 Eye Feature Detection Towards Automatic Strabismus Screening Ken Allen, Khanh Nguyen Gettysburg College What is strabismus? Eye defect that causes eyes to look in two different directions If left untreated,
Developments in SWAT modelling
 Developments in SWAT modelling Erik Querner Environmental Modelling SWAT model SWAT use in the Limpopo basin > SWAT CUP New developments: Link SIMGRO SWAT Rainfall runoff module for shallow groundwater
General info on using shopping carts with Ingenico epayments
 Inhoudsopgave 1. Disclaimer 2. What is a PSPID? 3. What is an API user? How is it different from other users? 4. What is an operation code? And should I choose "Authorisation" or "Sale"? 5. What is an
04/11/2013. Sluitersnelheid: 1/50 sec = 0.02 sec. Frameduur= 2 x sluitersnelheid= 2/50 = 1/25 = 0.04 sec. Framerate= 1/0.
 Onderwerpen: Scherpstelling - Focusering Sluitersnelheid en framerate Sluitersnelheid en belichting Driedimensionale Arthrokinematische Mobilisatie Cursus Klinische Video/Foto-Analyse Avond 3: Scherpte
Concept of Feedback. P.S. Gandhi Mechanical Engineering IIT Bombay
 Concept of Feedback P.S. Gandhi Mechanical Engineering IIT Bombay Recap Goal of the course: understanding and learning Assignments: optional to start with Contact hour with TAs: Monday AN: time? Meeting
Cambridge Assessment International Education Cambridge International General Certificate of Secondary Education. Published
 Cambridge Assessment International Education Cambridge International General Certificate of Secondary Education DUTCH 055/02 Paper 2 Reading MARK SCHEME Maximum Mark: 45 Published This mark scheme is published
Adam Marciniec, Grzegorz Budzik Zaborniak
 Journal of KONES Powertrain and Transport, Vol. 21, No. 3 2014 THE DETERMINATION OF ACCURACY OF THE DEMONSTRATOR OF AERONAUTIC BEVEL GEARBOX, ACCOMPLISHED BY SELECTED RAPID PROTOTYPING TECHNIQUES USING
Academisch schrijven Inleiding
 - In this essay/paper/thesis I shall examine/investigate/evaluate/analyze Algemene inleiding van het werkstuk In this essay/paper/thesis I shall examine/investigate/evaluate/analyze To answer this question,
Esther Lee-Varisco Matt Zhang
 Esther Lee-Varisco Matt Zhang Want to build a wine cellar Surface temperature varies daily, seasonally, and geologically Need reasonable depth to build the cellar for lessened temperature variations Building
Determinantenonderzoek naar Factoren waarmee een Actief Stoppen-met-Roken Beleid op Cardiologieverpleegafdelingen kan worden bevorderd
 Determinantenonderzoek naar Factoren waarmee een Actief Stoppen-met-Roken Beleid op Cardiologieverpleegafdelingen kan worden bevorderd Determinant Study in to Factors that Facilitate a Active Smoking-cessation
De Rol van Zelfregulatie, Motivatie en Eigen Effectiviteitsverwachting op het Volhouden
 De Rol van Zelfregulatie, Motivatie en Eigen Effectiviteitsverwachting op het Volhouden van Sporten en de Invloed van Egodepletie, Gewoonte en Geslacht The Role of Selfregulation, Motivation and Self-efficacy
De Samenhang tussen Dagelijkse Stress en Depressieve Symptomen en de Mediërende Invloed van Controle en Zelfwaardering
 De Samenhang tussen Dagelijkse Stress en Depressieve Symptomen en de Mediërende Invloed van Controle en Zelfwaardering The Relationship between Daily Hassles and Depressive Symptoms and the Mediating Influence
FOR DUTCH STUDENTS! ENGLISH VERSION NEXT PAGE
 FOR DUTCH STUDENTS! ENGLISH VERSION NEXT PAGE Tentamen Bewijzen en Technieken 1 7 januari 211, duur 3 uur. Voeg aan het antwoord van een opgave altijd het bewijs, de berekening of de argumentatie toe.
2010 Integrated reporting
 2010 Integrated reporting Source: Discussion Paper, IIRC, September 2011 1 20/80 2 Source: The International framework, IIRC, December 2013 3 Integrated reporting in eight questions Organizational
z x 1 x 2 x 3 x 4 s 1 s 2 s 3 rij rij rij rij
 ENGLISH VERSION SEE PAGE 3 Tentamen Lineaire Optimalisering, 0 januari 0, tijdsduur 3 uur. Het gebruik van een eenvoudige rekenmachine is toegestaan. Geef bij elk antwoord een duidelijke toelichting. Als
Modererende Rol van Seksuele Gedachten. Moderating Role of Sexual Thoughts. C. Iftekaralikhan-Raghubardayal
 Running head: momentaan affect en seksueel verlangen bij vrouwen 1 De Samenhang Tussen Momentaan Affect en Seksueel Verlangen van Vrouwen en de Modererende Rol van Seksuele Gedachten The Association Between
Chapter 4 Understanding Families. In this chapter, you will learn
 Chapter 4 Understanding Families In this chapter, you will learn Topic 4-1 What Is a Family? In this topic, you will learn about the factors that make the family such an important unit, as well as Roles
COGNITIEVE DISSONANTIE EN ROKERS COGNITIVE DISSONANCE AND SMOKERS
 COGNITIEVE DISSONANTIE EN ROKERS Gezondheidsgedrag als compensatie voor de schadelijke gevolgen van roken COGNITIVE DISSONANCE AND SMOKERS Health behaviour as compensation for the harmful effects of smoking
I.S.T.C. Intelligent Saving Temperature Controler
 MATEN & INFORMATIE I.S.T.C. Intelligent Saving Temperature Controler Deze unieke modulerende zender, als enige ter wereld, verlaagt het energieverbruik aanzienlijk. Het werkt in combinatie met de energy
Classification of triangles
 Classification of triangles A triangle is a geometrical shape that is formed when 3 non-collinear points are joined. The joining line segments are the sides of the triangle. The angles in between the sides
De Relatie tussen Betrokkenheid bij Pesten en Welbevinden en de Invloed van Sociale Steun en. Discrepantie
 De Relatie tussen Betrokkenheid bij Pesten en Welbevinden en de Invloed van Sociale Steun en Discrepantie The Relationship between Involvement in Bullying and Well-Being and the Influence of Social Support
Quality of life in persons with profound intellectual and multiple disabilities. Marga Nieuwenhuijse maart 2016
 Quality of life in persons with profound intellectual and multiple disabilities Marga Nieuwenhuijse maart 2016 Beoogde resultaten Literatuuronderzoek naar de bestaande concepten van kwaliteit van leven
ANGSTSTOORNISSEN EN HYPOCHONDRIE: DIAGNOSTIEK EN BEHANDELING (DUTCH EDITION) FROM BOHN STAFLEU VAN LOGHUM
 FROM BOHN STAFLEU VAN LOGHUM") Read Online and Download Ebook ANGSTSTOORNISSEN EN HYPOCHONDRIE: DIAGNOSTIEK EN BEHANDELING (DUTCH EDITION) FROM BOHN STAFLEU VAN LOGHUM DOWNLOAD EBOOK : ANGSTSTOORNISSEN EN HYPOCHONDRIE: DIAGNOSTIEK STAFLEU
Read Online and Download Ebook ANGSTSTOORNISSEN EN HYPOCHONDRIE: DIAGNOSTIEK EN BEHANDELING (DUTCH EDITION) FROM BOHN STAFLEU VAN LOGHUM DOWNLOAD EBOOK : ANGSTSTOORNISSEN EN HYPOCHONDRIE: DIAGNOSTIEK STAFLEU
NETWORK CHARTER. #ResourceEfficiency
 NETWORK CHARTER 1 WHAT IS THE EREK NETWORK? EREK stands for the European Resource Efficiency Knowledge Centre, a vibrant platform to enable and reinforce businesses and especially small and medium sized
Behandeleffecten. in Forensisch Psychiatrisch Center de Rooyse Wissel. Treatment effects in. Forensic Psychiatric Centre de Rooyse Wissel
 Behandeleffecten in Forensisch Psychiatrisch Center de Rooyse Wissel Treatment effects in Forensic Psychiatric Centre de Rooyse Wissel S. Daamen-Raes Eerste begeleider: Dr. W. Waterink Tweede begeleider:
Opgave 2 Geef een korte uitleg van elk van de volgende concepten: De Yield-to-Maturity of a coupon bond.
 Opgaven in Nederlands. Alle opgaven hebben gelijk gewicht. Opgave 1 Gegeven is een kasstroom x = (x 0, x 1,, x n ). Veronderstel dat de contante waarde van deze kasstroom gegeven wordt door P. De bijbehorende
Archief Voor Kerkelijke Geschiedenis, Inzonderheid Van Nederland, Volume 8... (Romanian Edition)
") Archief Voor Kerkelijke Geschiedenis, Inzonderheid Van Nederland, Volume 8... (Romanian Edition) Click here if your download doesn"t start automatically Archief Voor Kerkelijke Geschiedenis, Inzonderheid
Archief Voor Kerkelijke Geschiedenis, Inzonderheid Van Nederland, Volume 8... (Romanian Edition) Click here if your download doesn"t start automatically Archief Voor Kerkelijke Geschiedenis, Inzonderheid
Verklaring van het beweeggedrag van ouderen door determinanten van. The explanation of the physical activity of elderly by determinants of
 Verklaring van het beweeggedrag van ouderen door determinanten van het I-change Model The explanation of the physical activity of elderly by determinants of the I-change Model Hilbrand Kuit Eerste begeleider:
De Samenhang tussen Dagelijkse Stress, Emotionele Intimiteit en Affect bij Partners met een. Vaste Relatie
 De Samenhang tussen Dagelijkse Stress, Emotionele Intimiteit en Affect bij Partners met een Vaste Relatie The Association between Daily Stress, Emotional Intimacy and Affect with Partners in a Commited
Meetkunde en Lineaire Algebra
 Hoofdstuk 1 Meetkunde en Lineaire Algebra Vraag 1.1 Het trapoppervlak is een afwikkelbaar oppervlak met oneindig veel singuliere punten. Vraag 1.2 Het schroefoppervlak is een afwikkelbaar oppervlak met
Ouderlijke Controle en Angst bij Kinderen, de Invloed van Psychologische Flexibiliteit
 1 Ouderlijke Controle en Angst bij Kinderen, de Invloed van Psychologische Flexibiliteit Nicola G. de Vries Open Universiteit Nicola G. de Vries Studentnummer 838995001 S71332 Onderzoekspracticum scriptieplan
LabAnalyse 14-10-2015
 LabAnalyse 14-10-2015 1 LabAnalyse 14-10-2015 2 Brede chemische screening beschermt drinkwaterkwaliteit Ton van Leerdam, LabAnalyse 14-10-2015 KWR: opening nieuwbouw 18-9-2015 We hebben permanent nieuwe
Verschillen in het Gebruik van Geheugenstrategieën en Leerstijlen. Differences in the Use of Memory Strategies and Learning Styles
 Verschillen in het Gebruik van Geheugenstrategieën en Leerstijlen tussen Leeftijdsgroepen Differences in the Use of Memory Strategies and Learning Styles between Age Groups Rik Hazeu Eerste begeleider:
Earth Similarity Index
 Earth Similarity Index The Earth Similarity Index (ESI) is a measurement that expresses the strength of the physical resemblance of a certain celestial body and the planet Earth. It is a scale that goes
Risico s van Technologisch Succes in digitale transformatie S T R A T E G I C A D V I S O R
 Risico s van Technologisch Succes in digitale transformatie 2e Risk Event 2019 11 april 2019 The S T R A T E G I C A D V I S O R Ymanagement school of the autonomous University of Antwerp 2 Prof. dr. Hans
The Dutch mortgage market at a cross road? The problematic relationship between supply of and demand for residential mortgages
 The Dutch mortgage market at a cross road? The problematic relationship between supply of and demand for residential mortgages 22/03/2013 Housing market in crisis House prices down Number of transactions
CHROMA STANDAARDREEKS
 CHROMA STANDAARDREEKS Chroma-onderzoeken Een chroma geeft een beeld over de kwaliteit van bijvoorbeeld een bodem of compost. Een chroma bestaat uit 4 zones. Uit elke zone is een bepaald kwaliteitsaspect
Knelpunten in Zelfstandig Leren: Zelfregulerend leren, Stress en Uitstelgedrag bij HRM- Studenten van Avans Hogeschool s-hertogenbosch
 Knelpunten in Zelfstandig Leren: Zelfregulerend leren, Stress en Uitstelgedrag bij HRM- Studenten van Avans Hogeschool s-hertogenbosch Bottlenecks in Independent Learning: Self-Regulated Learning, Stress
FOR DUTCH STUDENTS! ENGLISH VERSION NEXT PAGE. Toets Inleiding Kansrekening 1 22 februari 2013
 FOR DUTCH STUDENTS! ENGLISH VERSION NEXT PAGE Toets Inleiding Kansrekening 1 22 februari 2013 Voeg aan het antwoord van een opgave altijd het bewijs, de berekening of de argumentatie toe. Als je een onderdeel
RECEPTEERKUNDE: PRODUCTZORG EN BEREIDING VAN GENEESMIDDELEN (DUTCH EDITION) FROM BOHN STAFLEU VAN LOGHUM
 FROM BOHN STAFLEU VAN LOGHUM") Read Online and Download Ebook RECEPTEERKUNDE: PRODUCTZORG EN BEREIDING VAN GENEESMIDDELEN (DUTCH EDITION) FROM BOHN STAFLEU VAN LOGHUM DOWNLOAD EBOOK : RECEPTEERKUNDE: PRODUCTZORG EN BEREIDING VAN STAFLEU
Read Online and Download Ebook RECEPTEERKUNDE: PRODUCTZORG EN BEREIDING VAN GENEESMIDDELEN (DUTCH EDITION) FROM BOHN STAFLEU VAN LOGHUM DOWNLOAD EBOOK : RECEPTEERKUNDE: PRODUCTZORG EN BEREIDING VAN STAFLEU
University of Groningen. Injury prevention in team sport athletes Dallinga, Joan
 University of Groningen Injury prevention in team sport athletes Dallinga, Joan IMPORTANT NOTE: You are advised to consult the publisher's version (publisher's PDF) if you wish to cite from it. Please
De Relatie Tussen Persoonskenmerken en Ervaren Lijden bij. Verslaafde Patiënten met PTSS
 Persoonskenmerken en ervaren lijden bij verslaving en PTSS 1 De Relatie Tussen Persoonskenmerken en Ervaren Lijden bij Verslaafde Patiënten met PTSS The Relationship between Personality Traits and Suffering
THE WORK HET WERK HARALD BERKHOUT
 THE WORK During the twenty years of its existence Studio Berkhout has evolved into the number one studio specialized in still life fashion photography. All skills needed for photography and styling, including
Het Verband Tussen Persoonlijkheid, Stress en Coping. The Relation Between Personality, Stress and Coping
 Het Verband Tussen Persoonlijkheid, Stress en Coping The Relation Between Personality, Stress and Coping J.R.M. de Vos Oktober 2009 1e begeleider: Mw. Dr. T. Houtmans 2e begeleider: Mw. Dr. K. Proost Faculteit
University of Groningen
 University of Groningen De ontwikkeling van prikkelverwerking bij mensen met een Autisme Spectrum Stoornis en de invloed van hulp en begeleiding gedurende het leven. Fortuin, Marret; Landsman-Dijkstra,
The colour of a pixel in a bit map picture can be presented in different ways. For this assignment, we distinguish two categories:
 Bitmap conversion A bit map picture is exactly what the name makes one suspect: a sequence of bits (0 or 1) that together represent a digital photo. The picture consists of a matrix (rectangle grid) of
MyDHL+ ProView activeren in MyDHL+
 MyDHL+ ProView activeren in MyDHL+ ProView activeren in MyDHL+ In MyDHL+ is het mogelijk om van uw zendingen, die op uw accountnummer zijn aangemaakt, de status te zien. Daarnaast is het ook mogelijk om
How are Total Cost of Ownership and Whole Life Value methods used? For AMNL 7 th June 2017
 How are Total Cost of Ownership and Whole Life Value methods used? For AMNL 7 th June 2017 1 Findings 1 TCO Policy statement often part of AM-policy statement Only one of the companies has an explicit
NMOZTMKUDLVDKECVLKBVESBKHWIDKPDF-WWUS Page File Size 9,952 KB 29 May, 2016
 NAVIJVEN MINILAMPJES OM ZELF TE MAKEN KERSTFIGUREN UIT DE LAPPENMAND VOOR DE KINDERSSALOON EN COWBOYS VAN LOLLYSTOKJES KAMERBREED BOEKENREK VOOR EEN SMAL BUDGETGEBAKKEN KOEKFIGUURTJES HANGEN WE IN DE KERSTBOOM
3e Mirror meeting pren April :00 Session T, NVvA Symposium
 3e Mirror meeting pren 689 13 April 2017 14:00 Session T, NVvA Symposium steps since April 2016 The enquiry (June to August 2016) performed by the national bodies. Resulting in 550 comments. Three/Four
HOU-NLD3 Energy Performance Coefficient (Energie Prestatie Coëfficiënt, EPC)
") Title of the measure: HOU-NLD3 Energy Performance Coefficient (Energie Prestatie Coëfficiënt, EPC) General description The Building Decree from 1992 already contained requirements for thermal insulation
Title of the measure: HOU-NLD3 Energy Performance Coefficient (Energie Prestatie Coëfficiënt, EPC) General description The Building Decree from 1992 already contained requirements for thermal insulation
UvA-DARE (Digital Academic Repository) Education in wrist arthroscopy Obdeijn, Miryam. Link to publication
 Education in wrist arthroscopy Obdeijn, Miryam. Link to publication") UvA-DARE (Digital Academic Repository) Education in wrist arthroscopy Obdeijn, Miryam Link to publication Citation for published version (APA): Obdeijn, M. C. (2014). Education in wrist arthroscopy. General
UvA-DARE (Digital Academic Repository) Education in wrist arthroscopy Obdeijn, Miryam Link to publication Citation for published version (APA): Obdeijn, M. C. (2014). Education in wrist arthroscopy. General
de Rol van Persoonlijkheid Eating: the Role of Personality
 De Relatie tussen Dagelijkse Stress en Emotioneel Eten: de Rol van Persoonlijkheid The Relationship between Daily Stress and Emotional Eating: the Role of Personality Arlette Nierich Open Universiteit
Risico s van CO2 leidingen
 takes gastransport further Risico s van CO2 leidingen Kennistafel buisleidingen T. Veenstra HSE coordinator Utrecht, 7 september 2010 Groningen, 9-9-2010 1 Inhoud Duurzaamheidsbeleid van Gasunie Ontwikkelingen
Quality requirements concerning the packaging of oak lumber of Houthandel Wijers vof (09.09.14)
") Quality requirements concerning the packaging of oak lumber of (09.09.14) Content: 1. Requirements on sticks 2. Requirements on placing sticks 3. Requirements on construction pallets 4. Stick length and
Quality requirements concerning the packaging of oak lumber of (09.09.14) Content: 1. Requirements on sticks 2. Requirements on placing sticks 3. Requirements on construction pallets 4. Stick length and
Longitudinal Driving Behaviour At Incidents And The Influence Of Emotions. Raymond Hoogendoorn
 Longitudinal Driving Behaviour At Incidents And The Influence Of Emotions Raymond Hoogendoorn. Primary thesis coordinator: Dr. W. Waterink Secondary thesis coordinator: Dr. P. Verboon April 2009 School
Today s class. Digital Logic. Informationsteknologi. Friday, October 19, 2007 Computer Architecture I - Class 8 1
 Today s class Digital Logic Friday, October 19, 2007 Computer Architecture I - Class 8 1 Digital circuits Two logical values Binary 0 (signal between 0 and 1 volt) Binary 1 (signal between 2 and 5 volts)
Pure Bending. A beam satisfying above given requirements are shown below: Why this surface is called neutral will be explained later in the lecture.
 In this section we will derive a formula to analyze a the deformation and stress distribution of a beam under flexural action. Theformulatobederivedinthis section will be used for straight beams with sections
Digital municipal services for entrepreneurs
 Digital municipal services for entrepreneurs Smart Cities Meeting Amsterdam October 20th 2009 Business Contact Centres Project frame Mystery Shopper Research 2006: Assessment services and information for
28/10/2012. Onderwerpen: Scherpstelling - Focusering Sluitersnelheid en framerate. Sluitersnelheid en belichting
 8/0/0 Onderwerpen: Sluitersnelheid en framerate Sluitersnelheid en belichting Driedimensionale Arthrokinematische Mobilisatie Cursus Klinische Video/Foto-Analyse Avond 3: Scherpte en Scherptediepte www.damcursus.nl
2019 SUNEXCHANGE USER GUIDE LAST UPDATED
 2019 SUNEXCHANGE USER GUIDE LAST UPDATED 0 - -19 1 WELCOME TO SUNEX DISTRIBUTOR PORTAL This user manual will cover all the screens and functions of our site. MAIN SCREEN: Welcome message. 2 LOGIN SCREEN:
ALGORITMIEK: answers exercise class 7
 Problem 1. See slides 2 4 of lecture 8. Problem 2. See slides 4 6 of lecture 8. ALGORITMIEK: answers exercise class 7 Problem 5. a. Als we twee negatieve (< 0) getallen bij elkaar optellen is het antwoord
Opleiding PECB ISO 9001 Quality Manager.
 Opleiding PECB ISO 9001 Quality Manager www.bpmo-academy.nl Wat is kwaliteitsmanagement? Kwaliteitsmanagement beoogt aan te sturen op het verbeteren van kwaliteit. Tevens houdt het zich bezig met het verbinden
0515 DUTCH (FOREIGN LANGUAGE)
") UNIVERSITY OF CAMBRIDGE INTERNATIONAL EXAMINATIONS International General Certificate of Secondary Education MARK SCHEME for the May/June 2011 question paper for the guidance of teachers 0515 DUTCH (FOREIGN
UNIVERSITY OF CAMBRIDGE INTERNATIONAL EXAMINATIONS International General Certificate of Secondary Education MARK SCHEME for the May/June 2011 question paper for the guidance of teachers 0515 DUTCH (FOREIGN
(1) De hoofdfunctie van ons gezelschap is het aanbieden van onderwijs. (2) Ons gezelschap is er om kunsteducatie te verbeteren
 De hoofdfunctie van ons gezelschap is het aanbieden van onderwijs. (2) Ons gezelschap is er om kunsteducatie te verbeteren") (1) De hoofdfunctie van ons gezelschap is het aanbieden van onderwijs (2) Ons gezelschap is er om kunsteducatie te verbeteren (3) Ons gezelschap helpt gemeenschappen te vormen en te binden (4) De producties
(1) De hoofdfunctie van ons gezelschap is het aanbieden van onderwijs (2) Ons gezelschap is er om kunsteducatie te verbeteren (3) Ons gezelschap helpt gemeenschappen te vormen en te binden (4) De producties
Aim of this presentation. Give inside information about our commercial comparison website and our role in the Dutch and Spanish energy market
 Aim of this presentation Give inside information about our commercial comparison website and our role in the Dutch and Spanish energy market Energieleveranciers.nl (Energysuppliers.nl) Founded in 2004
Evaluation of Measurement Uncertainty using Adaptive Monte Carlo Methods
 Evaluation of Measurement Uncertainty using Adaptive Monte Carlo Methods Gerd Wübbeler, Peter M. Harris, Maurice G. Cox, Clemens Elster ) Physikalisch-Technische Bundesanstalt (PTB) ) National Physical
CSRQ Center Rapport over onderwijsondersteunende organisaties: Samenvatting voor onderwijsgevenden
 CSRQ Center Rapport over onderwijsondersteunende organisaties: Samenvatting voor onderwijsgevenden Laatst bijgewerkt op 25 november 2008 Nederlandse samenvatting door TIER op 5 juli 2011 Onderwijsondersteunende
De andere elementen komen niet zomaar aanwaaien.
 a Welke twee zoutoplossingen zou hij daarvoor kunnen gebruiken? Geef de oplosvergelijkingen voor beide zouten. Noem de oplossingen resp. oplossing A en oplossing B b Geef de reactievergelijking van de
Hazen mg/l Pt (APHA) Platinum Cobalt Standard Method
 Platinum Cobalt Standard Method") Hazen 50 10-500 mg/l Pt (APHA) Platinum Cobalt Standard Method 203 Instrument specific information The test can be performed on the following devices. In addition, the required cuvette and the absorption
Hazen 50 10-500 mg/l Pt (APHA) Platinum Cobalt Standard Method 203 Instrument specific information The test can be performed on the following devices. In addition, the required cuvette and the absorption
De Relatie tussen Dagelijkse Stress, Negatief Affect en de Invloed van Bewegen
 De Relatie tussen Dagelijkse Stress, Negatief Affect en de Invloed van Bewegen The Association between Daily Hassles, Negative Affect and the Influence of Physical Activity Petra van Straaten Eerste begeleider
Appendix A: List of variables with corresponding questionnaire items (in English) used in chapter 2
 used in chapter 2") 167 Appendix A: List of variables with corresponding questionnaire items (in English) used in chapter 2 Task clarity 1. I understand exactly what the task is 2. I understand exactly what is required of
167 Appendix A: List of variables with corresponding questionnaire items (in English) used in chapter 2 Task clarity 1. I understand exactly what the task is 2. I understand exactly what is required of
Geslacht, Emotionele Ontrouw en Seksdrive. Gender, Emotional Infidelity and Sex Drive
 1 Geslacht, Emotionele Ontrouw en Seksdrive Gender, Emotional Infidelity and Sex Drive Femke Boom Open Universiteit Naam student: Femke Boom Studentnummer: 850762029 Cursusnaam: Empirisch afstudeeronderzoek:
ARTIST. Petten 24 September 2012. www.ecn.nl More info: schoots@ecn.nl
 ARTIST Assessment and Review Tool for Innovation Systems of Technologies Koen Schoots, Michiel Hekkenberg, Bert Daniëls, Ton van Dril Agentschap NL: Joost Koch, Dick Both Petten 24 September 2012 www.ecn.nl
Het Effect van de Kanker Nazorg Wijzer* op Werkgerelateerde Problematiek en Kwaliteit. van Leven bij Werkende Ex-Kankerpatiënten
 Het Effect van de Kanker Nazorg Wijzer* op Werkgerelateerde Problematiek en Kwaliteit van Leven bij Werkende Ex-Kankerpatiënten The Effect of the Kanker Nazorg Wijzer* on Work-related Problems and Quality
Verschil in Perceptie over Opvoeding tussen Ouders en Adolescenten en Alcoholgebruik van Adolescenten
 Verschil in Perceptie over Opvoeding tussen Ouders en Adolescenten en Alcoholgebruik van Adolescenten Difference in Perception about Parenting between Parents and Adolescents and Alcohol Use of Adolescents
De Bijdrage van Opleiding Ouders, Beroep Ouders en Sociaal-economische Status in de. Voorspelling van het Intelligentieniveau van het Kind.
 De Bijdrage van Opleiding Ouders, Beroep Ouders en Sociaal-economische Status in de Voorspelling van het Intelligentieniveau van het Kind. The Value of Parental Education, Parental Occupation and Socioeconomic
Modern Land Consolidation in the Netherlands
 Modern Land Consolidation in the Netherlands Adri van den Brink Government Service for Land and Water Management Wageningen University, Land Use Planning Group Volvic, 10 September 2004 Contents Introduction