KONINKLIJK BELGISCH INSTITUUT VOOR NATUURWETENSCHAPPEN OD NATUUR BEHEERSEENHEID VAN HET MATEMATISCH MODEL
|
|
|
- Johan Peters
- 6 jaren geleden
- Aantal bezoeken:
Transcriptie

 Activiteitsrapport (1 juli 2016-31")

1 KONINKLIJK BELGISCH INSTITUUT VOOR NATUURWETENSCHAPPEN OD NATUUR BEHEERSEENHEID VAN HET MATEMATISCH MODEL MOnitoring en MOdellering van het cohesieve sedimenttransport en evaluatie van de effecten op het mariene ecosysteem ten gevolge van bagger- en stortoperatie (MOMO) Activiteitsrapport (1 juli december 2016) Michael Fettweis, Matthias Baeye, Frederic Francken, Dries Van den Eynde MOMO/7/MF/201706/NL/AR/6 KBIN-OD Natuur - BMM Gulledelle 100 B 1200 Brussel België
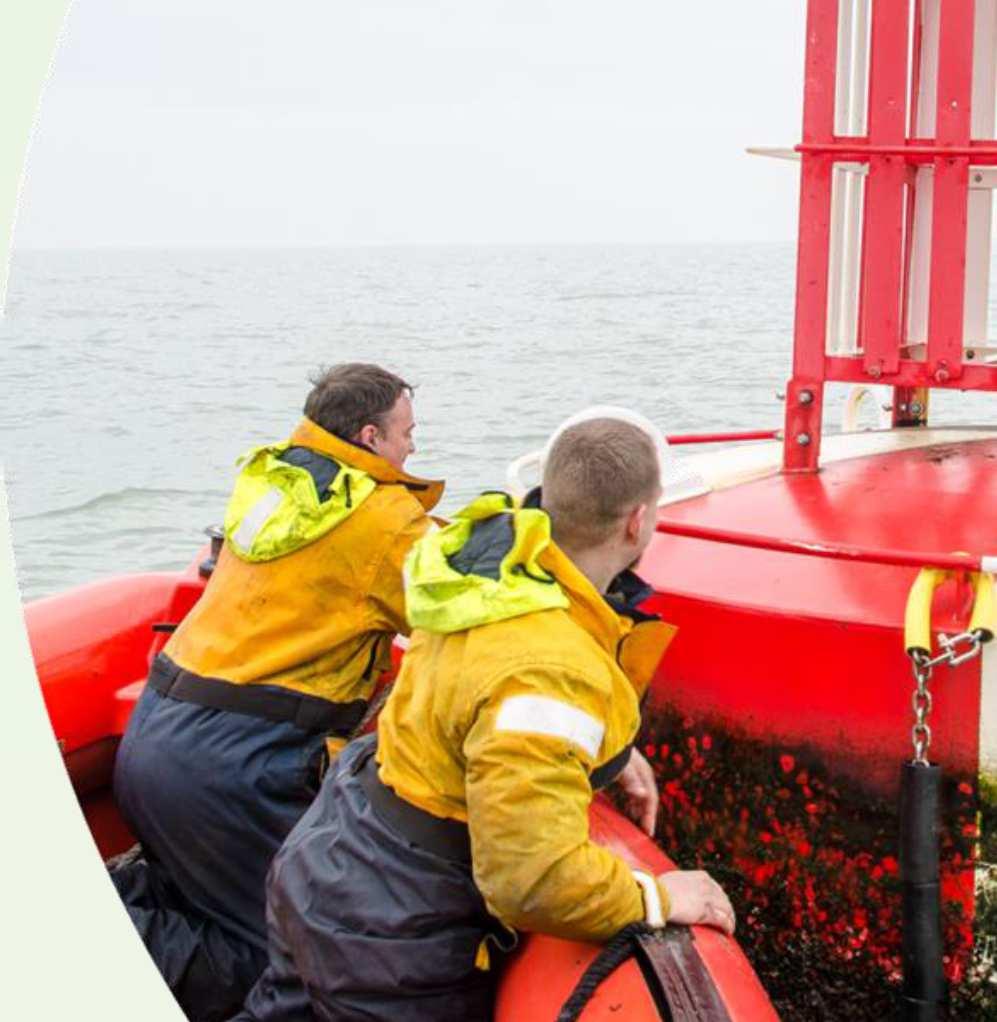
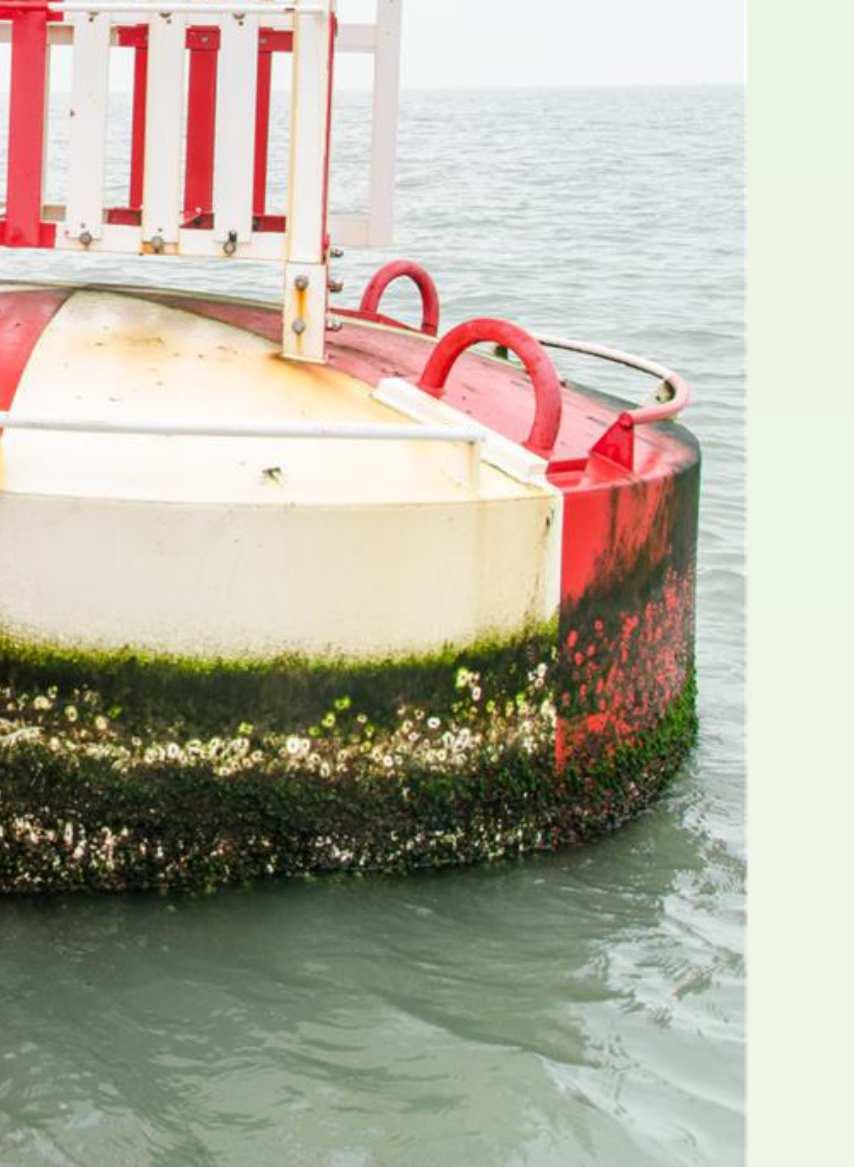
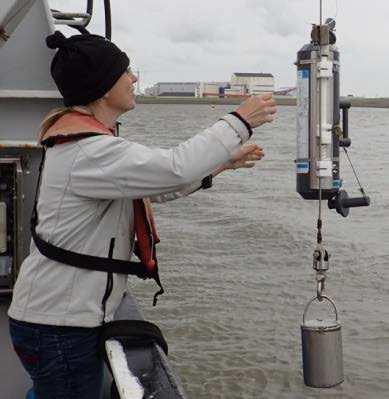
2 Inhoudstafel 1. Inleiding Voorwerp van deze opdracht Algemene doelstellingen Onderzoek Januari 2014 December Gerapporteerde en uitgevoerde taken Publicaties (januari 2014 december 2016) SPM concentratie te MOW1 in Meetapparatuur Overzicht metingen Spanningstoevoer naar OBS Omrekening akoestische en optische backscatter naar SPM concentratie Spanningstoevoer naar ADP Referenties 22 Appendix 1: Appendix 2: Appendix 3: Appendix 4: Appendix 5: Appendix 6: Appendix 7: Tijdseries MOW : OBS-SPM concentratie Tijdseries MOW : ADP-SPM concentratie Bijdragen ECSA conferentie Bijdrage ICES conferentie Bijdrage PiE conferentie Bijdrage North Sea conferentie Fettweis M, Baeye M, Cardoso C, Dujardin A, Lauwaerts B, Van den Eynde D, Van Hoestenberghe T, Vanlede J, Van Poucke L, Velez C, Martens C The impact of disposal of fine grained sediments from maintenance dredging works on SPM concentration and fluid mud in and outside the harbor of Zeebrugge. Ocean Dynamics, 66, doi: /s Photo voorpagina: Vervanging tripode op 20/05/2016 met de Sea Beluga 2
3 1. Inleiding 1.1. Voorwerp van deze opdracht Het MOMO-project (MOnitoring en MOdellering van het cohesieve sedimenttransport en de evaluatie van de effecten op het mariene ecosysteem ten gevolge van bagger- en stortoperatie) maakt deel uit van de algemene en permanente verplichtingen van monitoring en evaluatie van de effecten van alle menselijke activiteiten op het mariene ecosysteem waaraan België gebonden is overeenkomstig het Verdrag inzake de bescherming van het mariene milieu van de noordoostelijke Atlantische Oceaan (1992, OSPAR-Verdrag). De OSPAR Commissie heeft de objectieven van haar huidig Joint Assessment and Monitoring Programme (JAMP) gedefinieerd tot 2010 met de publicatie van een holistisch Quality Status Report Noordzee en waarvoor de federale overheid en de gewesten technische en wetenschappelijke bijdragen moeten afleveren ten laste van hun eigen middelen. De menselijke activiteit die hier in het bijzonder wordt beoogd, is het storten in zee van baggerspecie waarvoor OSPAR een uitzondering heeft gemaakt op de algemene regel alle stortingen in zee zijn verboden (zie OSPAR-Verdrag, Bijlage II over de voorkoming en uitschakeling van verontreiniging door storting of verbranding). Het algemene doel van de opdracht is het bestuderen van de cohesieve sedimenten op het Belgisch Continentaal Plat (BCP) en dit met behulp van zowel numerieke modellen als het uitvoeren van metingen. De combinatie van monitoring en modellering zal gegevens kunnen aanleveren over de transportprocessen van deze fijne fractie en is daarom fundamenteel bij het beantwoorden van vragen over de samenstelling, de oorsprong en het verblijf ervan op het BCP, de veranderingen in de karakteristieken van dit sediment ten gevolge van de baggeren stortoperaties, de effecten van de natuurlijke variabiliteit, de impact op het mariene ecosysteem in het bijzonder door de wijziging van habitats, de schatting van de netto input van gevaarlijke stoffen op het mariene milieu en de mogelijkheden om deze laatste twee te beperken. Een samenvatting van de resultaten uit de vergunningsperioden kan gevonden worden in het Synthesis report on the effects of dredged material dumping on the marine environment (Lauwaert et al. 2016) die gepubliceerd werden conform art. 10 van het K.B. van 12 maart 2000 ter definiëring van de procedure voor machtiging van het storten in de Noordzee van bepaalde stoffen en materialen Algemene doelstellingen Het onderzoek uitgevoerd in het MOMO project kadert in de algemene doelstellingen om de baggerwerken op het BCP en in de kusthavens te verminderen en om een gedetailleerd inzicht te verwerven van de fysische processen die plaatsvinden in het mariene kader waarbinnen deze baggerwerken worden uitgevoerd. Dit impliceert enerzijds beleidsondersteunend onderzoek naar de vermindering van de sedimentatie op de baggerplaatsen en het evalueren van alternatieve stortmethoden. Anderzijds is onderzoek naar knelpunten voor het plannen en schatten van de effecten van de baggerwerken vereist. Dit is specifiek gericht op het dynamische gedrag van silb in de waterkolom en op de bodem en zal uitgevoerd worden met behulp van modellen en in situ metingen. De specifieke acties die binnen dit onderzoek uitgevoerd worden om de algemene doelstellingen in te vullen zijn: 1. Streven naar een efficiënter stortbeleid door: optimalisatie van de stortlocaties. Gebaseerd op onderzoek uitgevoerd in de voorbije jaren (zie vorige syntheserapporten) zal een terreinproef worden uitge- 3
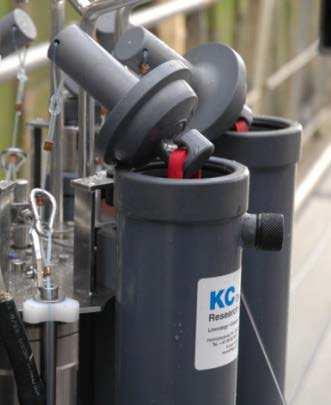
4 voerd om de efficiëntie van een stortlocatie ten westen van Zeebrugge te bepalen; gebruik te maken van een operationeel stortmodel. Dit model zal geïntegreerd worden in de binnen BMM beschikbare operationele modellen. Het model zal gebruikt worden om in functie van de voorspelde fysische (wind, stroming, golven, sedimenttransport, recirculatie), economische (afstand, grootte baggerschip) en ecologische aspecten op korte termijn een keuze te kunnen maken tussen de beschikbare stortlocaties. Hiervoor zal binnen de huidige periode het slibtransportmodel gevalideerd worden op de geografische variabiliteit van de turbiditeitszones en de flocculatie van het slib. 2. Continue monitoring van het fysisch-sedimentologische milieu waarbinnen de baggerwerken worden uitgevoerd en aanpassing van de monitoring aan de nog op te stellen targets voor het bereiken van de goede milieutoestand (GES), zoals gedefinieerd zal worden binnen MSFD; 3. Uitbouw en optimalisatie van het numerieke modelinstrumentarium, ter ondersteuning en verfijning van acties 1 en Onderzoek Januari 2014 December 2016 In het bijzonder is bij het opstellen van de hieronder vermelde taken rekening gehouden met de aanbevelingen voor de minister ter ondersteuning van de ontwikkeling van een versterkt milieubeleid zoals geformuleerd in het Syntheserapport over de effecten op het mariene milieu van baggerspeciestortingen (2011) dat uitgevoerd werd conform art. 10 van het K.B. van 12 maart 2000 ter definiëring van de procedure voor machtiging van het storten in de Noordzee van bepaalde stoffen en materialen Taak 1: In situ metingen en data analyse Monitoring moet gericht zijn op het begrijpen van processen, zodoende dat de waargenomen variabiliteit in een correcte kader geplaatst kan worden. In vele kustzones is er een gebrek aan langdurige en hoogfrequente data over sleutelparameters die de milieutoestand beschrijven, zoals turbiditeit en SPM concentratie. De tripodemetingen in het kader van het MOMO project te MOW1 vormen een uitzondering hierop gezien hun langdurig karakter. De eerste verankeringen werden in 2004 uitgevoerd, vanaf november 2009 worden er continue metingen gedaan. Deze data laten toe om om zowel de natuurlijke variabiliteit, de langdurige trends en de effecten van menselijke ingrepen op de turbiditeit te achterhalen. Een groot deel van de activiteiten is daarom gericht op zowel het uitvoeren van de metingen, het garanderen van kwalitatief hoogwaardige data en het archiveren, rapporteren en interpreteren ervan. Taak 1.1 Langdurige metingen Sinds eind 2009 worden er continue metingen uitgevoerd te MOW1 met behulp van een meetframe (tripode). Met dit frame worden stromingen, slibconcentratie, korrelgrootteverdeling van het suspensiemateriaal, saliniteit, temperatuur, waterdiepte en zeebodem altimetrie gemeten. Om een continue tijdreeks te hebben, wordt gebruik gemaakt van 2 tripodes. Na ongeveer 1 maand wordt de verankerde tripode voor onderhoud aan wal gebracht en wordt de tweede op de meetlocatie verankerd. In 2013 werd gestart met langdurige metingen met behulp van een OBS-5 sensor vastgemaakt aan de AW boei; deze metingen zullen verdergezet worden. De data geven informatie over de SPM concentratie aan het oppervlak en zijn aldus complementair aan de bodemnabije metingen met de tripode. De data zijn ook van belang voor het calibreren en valideren van de oppervlakte SPM concentraties uit satellietbeelden. 4
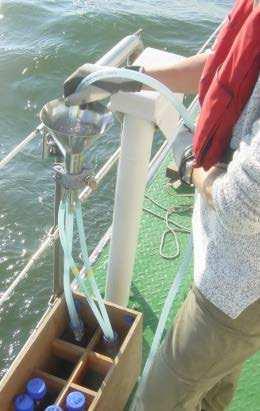
5 Taak 1.2 Calibratie van sensoren tijdens in situ metingen Tijdens 4 meetcampagnes per jaar met de R/V Belgica zullen een voldoende aantal 13- uursmetingen uitgevoerd worden met als hoofdoel het calibreren van optische of akoestische sensoren en het verzamelen van verticale profielen. De metingen zullen plaatsvinden in het kustgebied van het BCP. De optische metingen (transmissometer, Optical Backscatter Sensor) zullen gecalibreerd worden met de opgemeten hoeveelheid materie in suspensie (gravimetrische bepalingen na filtratie) om te komen tot massa concentraties. Naast de totale hoeveelheid aan suspensiemateriaal (SPM) wordt ook de concentratie aan POC/PON, chlorophyl (Chl-a, Chl-b) en phaeofytine (a, b) bepaald. Stalen van suspensiemateriaal zullen genomen worden met de centrifuge om de samenstelling ervan te bepalen. Taak 1.3: Data archivering en rapportage De meetdata worden gearchiveerd en er wordt een kwaliteitsanalyse uitgevoerd, zodat de goede data onderscheiden kunnen worden van slechte of niet betrouwbare data. Slechte data kunnen bv optreden doordat het instrument slecht heeft gewerkt en verkeerd werd ingesteld. Niet betrouwbare data zijn typisch geassicieerd met bv biofouling. De data en metadata worden gearchiveerd. Taak 1.4: Verwerking en interpretatie van metingen De metingen vergaard tijdens de 13-uursmetingen aan boord van de Belgica en met de tripode worden verwerkt en geïnterpreteerd. Hiervoor werden in het verleden reeds heel wat procedures (software) toegepast of ontwikkeld, zoals de berekening van de bodemschuifspanning uit turbulentiemetingen, entropieanalyse op partikelgrootteverdelingen, de opsplitising van multimodale partikelgrootteverdeling in een som van lognormale verdelingen, het groeperen van de data volgens getij, meteorologie, klimatologie en seizoenen. Deze methodes (zullen opgenomen worden) zijn opgenomen in de standaardverwerking van de data. De aldus verwerkte data dienen als basis voor het verder gebruik binnenin wetenschappelijke vragen (zie taak 2.2, 2.3 en 4.2, 4.4). Taak 2: Onderzoek en monitoring alternatieve stortstrategie onderhoudsbaggerwerk voorhaven Zeebrugge De BMM is auteur van de voorbereidende studies voor de terreinproef en zal de terreinproef mee opvolgen. BMM-OD Natuur zal verantwoordelijk zijn voor het uitvoeren van de langdurige frame metingen (lopen tot eind april 2014) en de statistische verwerking van de resultaten (Taak 2.1). De resultaten van de metingen zullen gebruikt worden bij de analyse van de efficiëntie van de baggerproef (Taak 2.3). Door de BMM-OD Natuur zullen ook met behulp van het Automatic Underway Monitoring System (AUMS) op het onderzoeksschip Belgica opnames gemaakt worden van de sedimentconcentratie binnen de haven (Taak 2.2). Deze gegevens zullen ter beschikking gesteld worden voor verdere verwerking. BMM-OD Natuur zal deel uitmaken van de stuurgroep. Taak 2.1: Uitvoeren van lange termijn metingen in de omgeving van de haven van Zeebrugge voor het opvolgen van de terreinproef, en het bestuderen van de interne sedimentdynamiek in de haven Voor dit deel van de opdracht is de BMM-OD Natuur verantwoordelijk voor het uitvoeren van de metingen en het aanleveren van de gevalideerde data voor verdere verwerking in de factual data rapportering en omzetting naar het standaardformaat. Het betreft twee meetframes, een ter hoogte van de meetpaal MOW 1 (als achtergrondwaarde, zie Taak 1.1) en een ander ter hoogte van de ingang van de haven van Zeebrugge (WZ-boei). Deze meetframes dienen afdoend de saliniteit, stromingen, sedimentconcentratie en korrel- 5
6 grootteverdeling te meten. Taak 2.2: Beschrijving van de omgevingscondities Gedurende de meetperiode van de langdurige metingen dienen ook de verschillende externe factoren die een invloed kunnen hebben op de interne slibdynamiek in de haven nauwkeurig bijgehouden worden en dit gedurende dezelfde periode als de metingen in taak 2.1. De BMM-OD Natuur is verantwoordelijk voor het opleveren van informatie over de sedimentconcentraties uit het AUMS aan boord van de Belgica. Taak 2.3: Analyse efficiëntie baggerproef Na afloop van de baggerproef dient de efficiëntie van de uitgevoerde proef geschat te worden. Hiervoor dient als eerste een T0 toestand gedefinieerd te worden, waarbij op basis van de binnen Taak 2.1 en Taak 2.2 verzamelde data een inschatting kan gemaakt worden van de mogelijke events die tijdens de proef hebben plaatsgevonden, en hun invloed op de resultaten van de baggerproef. De BMM-OD Natuur zal een statistische benadering van de efficiëntie van de baggerproef uitvoeren, waarbij nagegaan wordt in hoeverre de tijdens de baggerproef gemeten waardes op de twee frames afwijken van de waardes die gemeten werden buiten de stortproef. Deze analyse werd reeds toegepast bij de evalueren van de baggerproef in het Albert II dok. Taak 3: Uitbouw en optimalisatie van het modelinstrumentarium Taak 3.1: Validatie van het slibtransportmodel Het tijdens de voorbije jaren verbeterde en aangepaste slibtransportmodel zal worden gevalideerd met behulp van de langdurige meetreeksen en de satellietbeelden. Hierbij zal dezelfde methode als in Baeye et al. (2011) en zoals in taak 1.4 worden gebruikt om de modelresultaten te groeperen en te klasseren volgens windrichting, weertype en getij. Het voordeel van deze werkwijze is dat niet zozeer gekeken wordt of de correlatie tussen meting en modelresultaat in één of meerder punt goed is, maar dat globaal nagegaan wordt of het model de SPM dynamica op het BCP goed kan reproduceren. Deze taak zal in nauwe samenwerking met het WLH gebeuren die eenzelfde benadering zullen toe passen op hun model (contacten zijn gelegd met B De Maerschalk). Taak 3.2: Operationeel stortmodel Dit model zal geïntegreerd worden in de binnen BMM-OD Natuur beschikbare operationele modellen. Het model zal gebruikt worden om in functie van de voorspelde fysische (wind, stroming, golven, sedimenttransport, recirculatie), economische (afstand, grootte baggerschip) en ecologische aspecten op korte termijn een keuze te kunnen maken tussen de beschikbare stortlocaties. Hiervoor zal binnen de huidige periode het slibtransportmodel gevalideerd worden op de geografische variabiliteit van de turbiditeitszones en de flocculatie van het slib. Taak 4: Oplossingen voor knelpunten Taak 4.1: Kwaliteitscontrole van de data en de integratie ervan in de monitoing voor de KRMS Taak 4.1.1: KRMS monitoring De data verzameld in Taak 1, zullen worden opgenomen in de nog op te zetten monitoringsverplichtingen van de Belgische Staat (07/2014) in het kader van de Kaderrichtlijn Mariene Strategie (MFSD). De KRMS monitoring zal in 2015 starten en zal dienen om de toestand van het mariene milieu te evalueren aan de goede milieutoestand (GES), zoals opgetseld door de Belgische Staat in 2012 (Belgische Staat 2012a, 2012b). Er zal verder geëvalueerd worden of het MOMO meetprogramma aan de monitorings- 6
7 verplichtingen die voor de KRMS (MFSD) moeten worden opgesteld zal voldoen en/of er aanpassingen nodig zijn. De wetenschappelijke vragen die hier bekeken worden hebben vooral betrekking op de geografische spreiding van de data. Is het voldoende om zoals nu gebeurt te berusten op satellietbeelden voor de geografische en in situ meetreeksen voor de temporele spreiding of dienen we te opteren voor één vast meetpunt (MOW1) en bijkomend een aantal andere punten (Nieuwpoort, Kwintebank, Gootebank) waar random in de tijd gemeten wordt met een tripode gedurende telkens een periode van ongeveer 1 maand. Hiervoor zou bv de tripode die nu ingezet wordt voor de terreinproef gebruikt kunnen worden. Taak 4.1.2:Kwaliteitscontrole Een belangrijk aandachtspunt bij deze langdurige datareeksen is het garanderen van een gelijke kwaliteit in de tijd van de verzamelde data. De vraag die zich bij onze SPM concentratiemetingen stelt is niet zozeer het opmeten van hogere of lagere waarden, mogelijks veroozaakt door het toepassen van een andere stortstrategie, maar het garanderen dat deze waarden inderdaad veroorzaakt worden door menselijke activiteiten (bv storten) en niet het effect zijn van natuurlijke fluctuaties. De natuurlijke variabiliteit van SPM concentratie is groot en wordt veroorzaakt door de getijwerking, doodtij-springtijcyclus en meteorologische en klimatologische phenomenen. De tijdschalen gaan van seconden tot seizoenen, met mogelijks langere fluctuaties voor (nodale cylus, klimaatsverandering, zeespiegelstijging,...). Langdurige variaties kunnen bv geïdentifceerd worden als een trend of een cosinusfunctie met lage frequentie. Om kwaliteitsvolle data te kunnen leveren over een lange periode, die gebruikt kunnen worden om langdurige trends te identificeren, is het nodig om een rigoureuze kwaliteitscontrole uit te voeren. OBS alsook akoestische sensoren zijn gevoelig aan de samenstelling en korrelgrootte van het gesuspendeerde materiaal. Dit kan varieren in functie van de boven vermelde frequenties, maar hieromtrent is er nog geen afdoende duidelijkheid wat de metingen te MOW1 betreft. Hoe veranderen de calibratieconstanten i.f.v. externe parameters (doodtij-springtij, zomer-winter)? Hoe dikwijls moeten de sensoren in situ gecalibreerd worden om de rekening te kunnen houden met de mogelijke fluctuaties in samenstelling van het suspensiemateriaal? Wat is de fout op de metingen? Het uitvoeren van directe (waterstaal) en indirecte metingen (OBS, akoestische backscatter) van SPM concentratie gaat inherent gepaard met onzekerheden (meetfouten). In situ metingen zijn steeeds onderhevig aan onzekerheden tengevolge van random meetfouten (gebrek aan precisie), systematische fouten (onnauwkeurigheid), menselijke fouten, en de statistische variabiliteit van de parameter. De fouten hebben hun oorsprong in de onnauwkeurigheid en het gebrek aan precisie van het meetinstrument of de procedures (bv. waterstaalname en filtratie). Doel is om de fout op de verschillende onderdelen van de metingen (filtratie, calibratie, langdurige trends...) te schatten. Taak 4.1.3: Aanvulling van ontbrekende data met behulp van statistische methodes Het gebeurt regelmatig in de metingen te MOW1 dat de OBS sensoren verzadigen (vooral deze op 0.2 m) of uitvallen en er aldus gedurende een korte of langere perioden geen (betrouwbare) data beschikbaar zijn. In de statistiek bestaan technieken de ontbrekende data te reconstrueren. Er zal nagegaan worden wat de meets geschikte methode is om de tijdseries te vervolledigen. Taak 4.2: Biologische effecten en de seizoenale variaties in SPM concentratie De correlatie tussen biomassa (zoals o.a. POC en chlorophyl) en vlokgrootte en vorm wordt dikwijls aangehaald in de literatuur, maar dit bleek sterk plaatsgebonden te zijn en dikwijls gebaseerd op korte meetperioden. De lange tijdsreeks te MOW1 werd geanaly- 7
8 seerd in combinatie met satelliet data, de omgekeerde correlatie tussen de chlorophyll en de SPM concentratie is opvallend. Er werd de hypothese opgesteld, dat door de algenbloei in de lente de concentratie aan kleverige organische moleculen (TEPs) wordt verhoogd, waardoor meer macrovlokken gevormd worden, het SPM sneller bezinkt en moeilijker kan eroderen en aldus de SPM concentratie gaat afnemen. erder onderzoek richt zich naar: 1) Analyse van TEP concentraties. Tot nu toe worden geen TEP analyses uitgevoerd, nochthans is dit noodzakelijk om deze hypothese te toetsen. Er zal nagegaan worden hoe de TEPs geanalyseerd kunnen worden in waterstalen, wat en hoe dit meetprogramma uitgevoerd kan worden. Er wordt geopteerd om tegen 2015 met de eerste metingen te kunnen beginnen. 2) De invloed van lichthoeveelheid op de start van de algenbloei in de lente en de afname van de SPM concentratie; 3) Wat gebeurt er met het SPM dat uit de waterkolom verdwijnt door snellere sedimentatie in de zomer? Heeft dit een effect op de frequentie van hooggeconcentreerde slibsuspensies en mogelijks aanslibbing van vaargeulen en havens? 4) Verdere ontwikkeling van het flocculatiemodel zodat seizoenale effecten in rekening gebracht kunnen worden. Simulatie in 2D/3D met dit flocculatiemodel teneinde het model te valideren. Taak 4.3: Alternatieve Stortstrategies Nieuwpoort Er zal ondersteuning gegeven worden aan MDK in verband met het opzetten van een wetenschappelijke terreinproef om de impact van het verpompen van baggerspecie uit de haven van Nieuwpoort op een stortzone te evalueren. Details hiervan zullen op een vergadering van de technische werkgroep besproken worden. Taak 4.4: Golfsystemen en hun impact op de zeebodem en de SPM concentratie Er bestaan verschillende sorten golven en golfsystemen (korte golven, deining) die een impact hebben op de zeebodem. Tot nu toe werd dit aspect nog niet in rekening gebracht in de analyse van de data. Wat is de impact van deinig of korte golven op de resuspensie van sedimenten? Wat zijn de belangrijkste parameters en wat is hun belang voor waterbouwkundige werken (baggeren)? 1.4. Gerapporteerde en uitgevoerde taken Periode Januari 2014 Juni 2014 Taak 1.1: De meetreeks te MOW1 werd verdergezet. Taak 1.2: Calibratie van sensoren werd uitgevoerd tijdens RV Begica campagnes 2014/01 en 2014/11 Taak 1.4: Verwerking en interpretatie van OBS meetdata (gerapporteerd in activiteitsrapport MOMO/7/MF/201408/NL/AR/1) Taak 2.1: De metingen aan de WZ boei werden beëindigd eind maart Periode Juli 2014 December 2014 Taak 1.1: De meetreeks te MOW1 werd verdergezet. Taak 1.2: Calibratie van sensoren werd uitgevoerd tijdens RV Begica campagnes 2014/22, 2014/28 en 2014/31 Taak 1.4: Verwerking en interpretatie van LISST meetdata (gerapporteerd in activiteitsrapport MOMO/7/MF/201501/NL/AR/2). Taak 2.2: ADCP data gemeten aan boord van de Belgica en de satellietbeelden tijdens de stortproef werden verwerkt en de data opgeleverd. Taak 4.2: Wat gebeurt er met het SPM dat uit de waterkolom verdwijnt door snellere sedimentatie in de zomer? (gerapporteerd in activiteitsrapport MOMO/7/MF/201501/NL/AR/2, voorgesteld op PiE 2014, PECS 2014, VLIZ Young Scientist day 2015 en gepubliceerd in JGR in augustus 2015). 8
9 Periode Januari 2015 Juni 2015 Taak 1.1: De meetreeks te MOW1 werd verdergezet. Taak 1.2: Calibratie van sensoren werd uitgevoerd tijdens RV Begica campagnes 2015/01 en 2015/10. Taak 2 Terreinproef, analyse efficiëntie baggerproef (zie activiteitsrapport MOMO/7/MF/201508/NL/AR/3). Periode Juli 2015 December 2015 Taak 1.1: De meetreeks te MOW1 werd verdergezet. Taak 1.2: Calibratie van sensoren werd uitgevoerd tijdens RV Begica campagnes 2015/32. Taak 2 Resultaten over de terreinproef werd voorgesteld op INTERCOH Taak Eerste resulaten van de kwaliteitscontrole van de meetdata werd voorgesteld op INTERCOH Taak 4.4 Golfsystemen en hun impact op de zeebodem en de SPM concentratie (gerapporteerd in activiteitsrapport MOMO/7/MF/201603/NL/AR/4, voorgesteld INTERCOH 2015). Periode Januari 2016 Juni 2016 Taak 1.1 De meetreeks te MOW1 werd verdergezet. AW boei data gerapporteerd in activiteitsrapport MOMO/7/MF/201608/NL/AR/5 Taak 1.2 Calibratie van sensoren werd uitgevoerd tijdens RV Begica campagnes 2016/03 en 2016/11. Taak Kwaliteitscontrole van de meetdata: Op februari 2016 werd te Brussel een internationale workshop over Best practice in generating long-term and large-scale data sets of suspended particulate matter concentration met experten uit Duitsland, Nederland, Frankrijk en Belgë georganiseerd met als doel de kwaliteitscontrole van SPM oconcentratiemetingen te bespreken. Er werden concrete afspraken gemaakt betreffende het rapporteren van bestaande procedures en het ontwikkelen van best practices. Taak Aanvulling van ontbrekende data met behulp van statistische methodes (gerapporteerd in activiteitsrapport MOMO/7/MF/201608/NL/AR/5). Periode Juli 2016 December 2016 en overzicht Taak 1 Taak 1.1 Taak 1.2 Taak 1.3 In situ metingen en data analyse De meetreeks te MOW1 werd verdergezet. Er werden geen calibraties van sensoren uitgevoerd tijdens het laatste semester wegens het niet beschikbaar zijn van de Belgica (april t.e.m. december 2016). Data archivering en rapportage: de data voor 2013, 2014 en 2015 werden geraporteerd in de datarapporten BMM-MDO/ /MOMO/2015, BMM- MDO/ /MOMO/2014, BMM-MDO/ /MOMO/2013. Taak 1.4 Verwerking en interpretatie van metingen, zie activiteitsrapporten MOMO/7/MF/201408/NL/AR/1, MOMO/7/MF/201501/NL/AR/2, MOMO/7/ MF/201706/NL/AR/6 Taak 2 Taak 3 Taak 3.1 Onderzoek en monitoring alternatieve stortstrategie Uitgevoerd, zie activiteitsrapport MOMO/7/MF/201508/NL/AR/3. Een samenvatting van de terreinproef werd gepubliceerd in Ocean Dynamics, zie appendix 7 van dit rapport. Uitbouw en optimalisatie van het modelinstrumentarium Een nieuwe modellenreeks (van het Noordwest Europees Continentaal Plat tot de Belgische kustzone) werd opgesteld met behulp van Coherens V2. Voor de Belgische kustzone (BeC model) werd een nieuwe bathymetrie geïmplementeerd met een resolutie van 250m en inclusief wetting/drying. Het bimodale flocculatiemodel van BJ Lee werd in Coherens V2 geïmplementeerd. Validatie van het slibtransportmodel. Deze taak zal uitgevoerd worden tijdens de volgende vergunningsperiode. 9
10 Taak 3.2 Operationeel stortmodel. Deze taak wordt overgedragen naar de volgende vergunningsperiode. Taak 4 Oplossingen voor knelpunten Taak 4.1 Kwaliteitscontrole van de data en de integratie ervan in de monitoing voor de KRMS Taak Integratie monitoring in KRMS werd uitgevoerd, zie hoofdstuk 7 van het Syntheserapport vergunningsperiode alsook appendix 6 van dit rapport. Taak Kwaliteitscontrole. Een procedure voor de kwaliteitscontrole van de meetdata (tripode) is in ontwikkeling. Eerste resultaten werden voorgesteld op conferenties, zie appendix 3-5 van dit rapport. De taak wordt verdergezet tijdens de volgende vergunningsperiode. Taak 4.2 Biologische effecten en de seizoenale variatie van het SPM. Deze taak werd voor een deel uitgevoerd (zie rapport MOMO/7/MF/201603/NL/AR/4). Wegens problemen bij de analyse van de stalen en het nog niet beëindigen van de modellering van de seizoenale effecten wordt deze taak deels opgenomen in de taken voor de volgende vergunningsperiode. Taak 4.3 Alternatieve stortstrategie Nieuwpoort Niet uitgevoerd. Deze taak wordt verschoven naar de taken voor de volgende vergunningsperiode. Taak 4.4 Golfsystemen en hun impact op de zeebodem en de SPM concentratie: werd uitgevoerd (zie rapport MOMO/7/MF/201603/NL/AR/4) Publicaties (januari 2014 december 2016) Hieronder wordt een overzicht gegeven van publicaties met directe betrokkenheid van het KBIN waar resultaten en data uit het MOMO project in werden gebruikt. Activiteits-, Meet- en Syntheserapporten Fettweis M, Baeye M, Francken F, Van den Eynde D MOMO activiteitsrapport (1 juli 31 december 2016). BMM-rapport MOMO/7/MF/201706/NL/AR/6, 23pp + app. Lauwaert B, Fettweis M, De Witte B, Devriese L, Van Hoei G, Timmermans S, Martens C Synthesis report on the effects of dredged material disposal on the marine environment (licensing period ). RBINS-ILVO-AMT-AMCS-FHR report BL/2016/09, 107pp. Fettweis M, Baeye M, Francken F, Van den Eynde D MOMO activiteitsrapport (1 januari 30 juni 2016). BMM-rapport MOMO/7/MF/201607/NL/AR/5, 30pp + app. Backers J, Hindryckx K, Vanhaverbeke W Rapport van de RV Belgica Meetcampagnes en Verankering van Meetsystemen MOMO BMM-rapport BMM- MDO/ /MOMO/2015, 89pp. Backers J, Hindryckx K, Vanhaverbeke W Rapport van de RV Belgica Meetcampagnes en Verankering van Meetsystemen MOMO BMM-rapport BMM- MDO/ /MOMO/2014, 165pp. Fettweis M, Baeye M, Francken F, Van den Eynde D, Thant S MOMO activiteitsrapport (1 juli 31 december 2015). BMM-rapport MOMO/7/MF/201603/NL/AR/4, 25pp + app. Fettweis M, Baeye M, Francken F, Vn den Eynde D MOMO activiteitsrapport (1 januari 30 juni 2015). BMM-rapport MOMO/7/MF/201508/NL/AR/3, 76pp + app. Van den Eynde D, Fettweis M Modellering van een alternatieve stortstrategie voor de onderhoudsbaggerwerken in de voorhaven van Zeebrugge. Technisch rapport MOMO/7/DVDE/201506/NL/TR01, 17pp. Fettweis M, Baeye M, Francken F MOMO activiteitsrapport (1 juli 31 december 2014). BMM-rapport MOMO/7/MF/201501/NL/AR/2, 41pp + app. Backers J, Francken F, Hindryckx K, Vanhaverbeke W Rapport van de RV Belgica Meetcampagnes en Verankering van Meetsystemen MOMO BMM-rapport BMM-MDO/ /MOMO/2013, 213pp. 10
11 Fettweis M, Baeye M, Francken F, Van den Eynde D MOMO activiteitsrapport (1 januari - 30 juni 2014). BMM-rapport MOMO/7/MF/201408/NL/AR/1, 43pp + app. Lauwaert B, Fettweis M, De Witte B, Devriese L, Van Hoei G, Timmermans S, Martens C Vooruitgangsrapport (juni 2014) over de effecten op het mariene milieu van baggerspeciestortingen (vergunningsperiode 01/01/ /12/2016). Rapport uitgevoerd door KBIN-BMM, ILVO, CD, amt. BL/2014/01, 20pp + app. Conferenties/Workshops Van Hoey G, Devriese L, Dewitte B, Fettweis M, Lauwaert B, Parmentier K, Vanlede J, Hostens K, Martens C Environmental impact assessment in line with the EU Nature Directives. North Sea Conference, 7-10 November, Ostend (Belgium). Fettweis M, Baeye M SPM concentration measurements in low and high turbulent conditions. Particles in Europe, 3-5 October, Budapest (Hungary). Riethmüller R, Fettweis M, Verney R Best-practice for long-term observations of total suspended particulate matter in coastal marine environments. ICES Annual Science Conference, September, Riga (Latvia). Baeye M, Francken F, Fettweis M Remote sensing of suspended particulate matter concentration, inter-comparison with surface buoy and tripod lander data. ECSA September, Bremen (Germany) Fettweis M., Baeye M SPM concentration measurements in low and high turbulent conditions. ECSA September, Bremen (Germany). Riethmüller R, Fettweis M, Verney R On best-practice for long-term observations of total suspended particulate matter. ECSA 56, 4-7 September, Bremen (Germany). Fettweis M Long-term observations of suspended particulate matter concentration. NewSTHEPS Follow-up Comitee Meeting, 12 April, Brussels (Belgium). Backers J Instrument related problems with optical backscatter sensors. Workshop Best practice in generating long-term and large-scale data sets of suspended particulate matter concentration, February, Brussels (Belgium). Fettweis M Long term measurements of SPM concentration in the Belgian nearshore: How to estimate the uncertainty? Workshop Best practice in generating longterm and large-scale data sets of suspended particulate matter concentration, February, Brussels (Belgium). Fettweis M, Baeye M, Cardoso C, Dujardin A, Van den Eynde D, Van Hoestenberghe T, Vanlede J, Van Poucke L, Velez C, Martens C The impact of disposal of fine grained sediments from maintenance dredging works on SPM concentration and fluid mud in and outside the harbor of Zeebrugge. VLIZ Marine Scientists' Day, 12 February, Brugge (Belgium). Dujardin A, Vanlede J, Van Hoestenberghe T, Van Poucke L, Fettweis M, Cardoso C, Velez C, Martens M Factors influencing top sediment layer and SPM concentration in the Zeebrugge harbor. INTERCOH, 7-11 September, Leuven (Belgium). Fettweis M, Baeye M, Verney R Uncertainty of in situ SPM concentration measurements. INTERCOH, 7-11 September, Leuven (Belgium). Fettweis M, Baeye M, Francken F, Van den Eynde D, Van Hoestenberghe T, Van Poucke L, Dujardin A, Martens C In situ measurements of SPM concentration to evaluate the impact of the disposal of fine grained sediments from maintenance dredging. INTERCOH, 7-11 September, Leuven (Belgium). Lee BJ, Bi Q, Toorman EA, Fettweis M, Weilbeer H Two-Class Flocculation kinetic model: Development and application to large-scale, multi-dimensional cohesive sediment transport. INTERCOH, 7-11 September, Leuven (Belgium). Thant S, Fettweis M, Baeye M, Monbaliu J Wave systems and their impact on the seabed and water column turbidity in the Belgian coastal zone. INTERCOH, 7-11 September, Leuven (Belgium). Van den Eynde D, Baeye M, Fettweis M, Francken F, Van Lancker V Validation of modelled bottom shear stress under the influence of currents and waves using longterm measurements. INTERCOH, 7-11 September, Leuven (Belgium). Fettweis M, Baeye M Seasonality in concentration, size and settling velocity of muddy marine snow in the southern North Sea and their effects on the the sea bed. 11
12 VLIZ Young Marine Scientists' Day, 20 February, Brugge (Belgium). Fettweis M, Baeye M SPM dynamics at the marine limit of influence of the Westerschelde estuary. Ems-Scheldt workshop, February, Delmenhorst (Germany). Fettweis M, Baeye M, Francken F Seasonality of the near bed SPM dynamics in the southern North Sea. PECS, October, Porto de Galinhas (Brazil). Fettweis M, Baeye M Variability in concentration, size and settling velocity of muddy marine flocs from the southern North Sea. Particles in Europe, 7-9 October, Esbjerg (Denmark). Fettweis M, Lee B, Toorman E Multimodal particle size distribution of fine-grained cohesive sediments: Observation and simulation. Reactive Transport Workshop, 20 May, Louvain-la-Neuve (Belgium). Baeye M, Francken F, Fettweis M, Van den Eynde D The first buoy for continuous measuring of surface Suspended Particulate Matter concentration on the Belgian inner shelf. VLIZ Young Marine Scientists' Day, 7 March, Brugge (Belgium) (poster). Fettweis M, Baeye M, Van der Zande, Van den Eynde D, Lee BJ Seasonality of nearshore marine snow in the southern North Sea. VLIZ Young Marine Scientists' Day, 7 March, Brugge (Belgium). Thant S, Baeye M, Fettweis M, Monbaliu J, Van Rooij D Extreme values of Suspended Particulate Matter concentration and their relation to wave systems along the Belgian inner shelf. VLIZ Young Marine Scientists' Day, 7 March, Brugge (Belgium). Papers en hoofdstukken in boeken Fettweis M, Baeye M, Cardoso C, Dujardin A, Lauwaerts B, Van den Eynde D, Van Hoestenberghe T, Vanlede J, Van Poucke L, Velez C, Martens C The impact of disposal of fine grained sediments from maintenance dredging works on SPM concentration and fluid mud in and outside the harbor of Zeebrugge. Ocean Dynamics, 66, doi: /s Fettweis M, Baeye M Seasonal variation in concentration, size and settling velocity of muddy marine flocs in the benthic boundary layer. Journal of Geophysical Research Oceans, doi: /2014JC Van Lancker V, Deronde B, De Vos K, Fettweis M, Houthuys R, Martens C, Mathys M Kust en Zee. In: Borremans M. (Ed.) Geologie van Vlaanderen. Academia Press/Genootschap van Gentse Geologen. Van den Eynde D, Fettweis M Towards the application of an operational sediment transport model for the optimisation of dredging works in the Belgian coastal zone (southern North Sea). In: Dahlin H, Flemming NC, Petersson SE (Eds.). Sustainable Operational Oceanography, Fettweis M, Baeye M, Van der Zande D, Van den Eynde D, Lee BJ Seasonality of floc strength in the southern North Sea. Journal of Geophysical Research Oceans, 119, doi: /2013jc09750 Lee BJ, Toorman E, Fettweis M Multimodal particle size distribution of fine-grained sediments: Mathematical modeling and field investigations. Ocean Dynamics 64, doi: /s y Thesis Nelson M Soft sediment dynamics in a high-turbidity environment, Belgian coastal zone. Master thesis in Marine and Lacustrine Science and Management. UA, UGent and VUB. 38pp+app. Thant S Study on wave systems and their impact on the seabed and water column turbidity in the Belgian coastal zone. Master thesis in Marine and Lacustrine Science and Management. UA, UGent and VUB. 43pp+app. 12
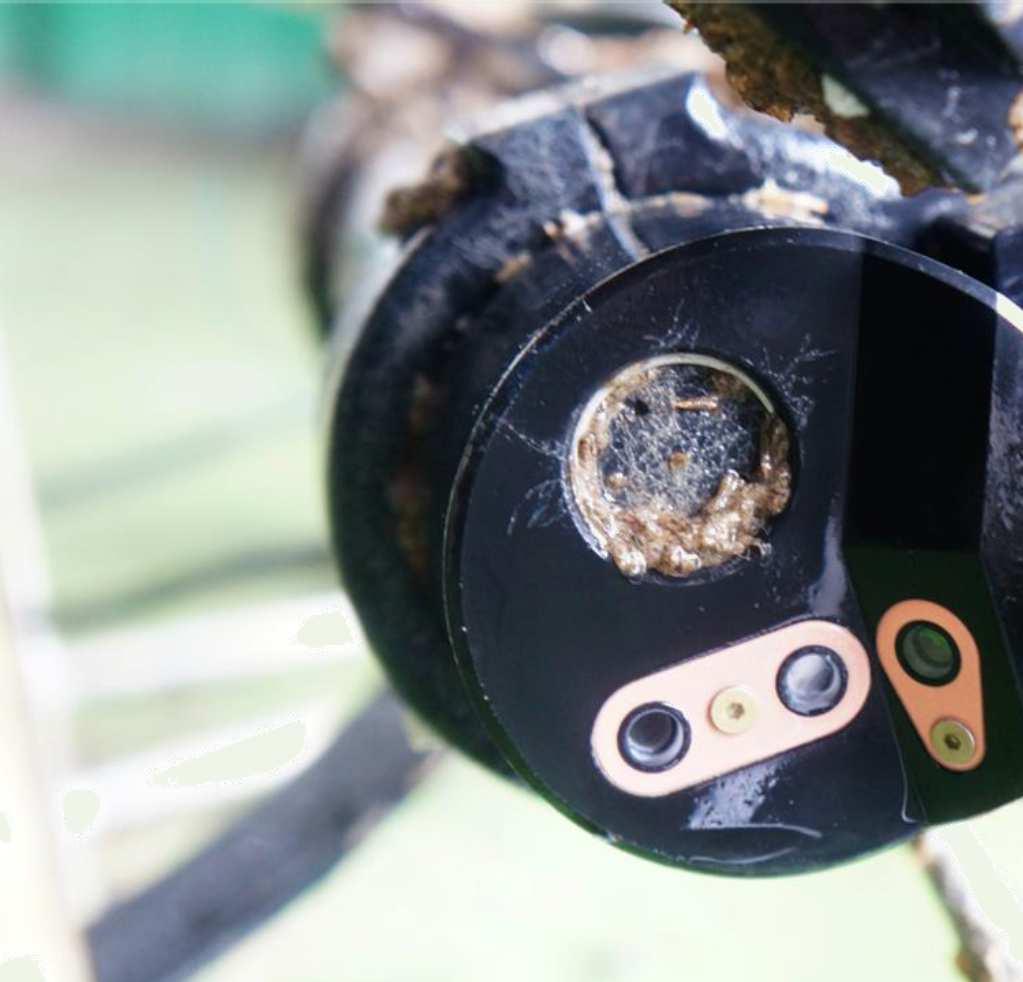
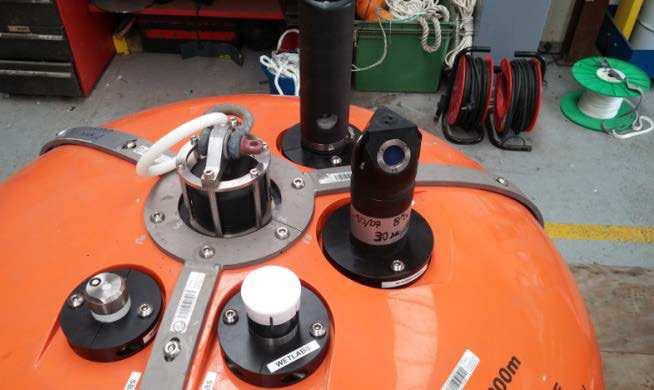
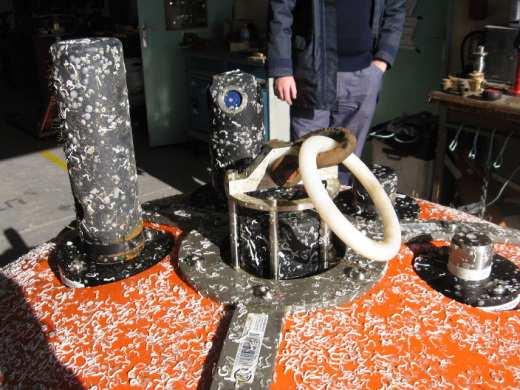
13 2. SPM concentratie te MOW1 in Meetapparatuur Stroming, saliniteit, temperatuur, SPM concentratie en partikelgrootteverdeling (PGV) werden gemeten met een tripode (Figuur 2.1). De tripode wordt gedurende een periode van 3-6 weken verankerd, waarna ze terug opgehaald en vervangen wordt met een gelijkaardig tripodesysteem. De gemonteerde instrumentatie bestaat, onder andere uit drie D&A optical backscatter point sensoren (OBSen), een Sea-bird SBE37 thermosalinograaf, een SonTek 5MHz ADVOcean puntstroommeter, een SonTek 3MHz ADP current profiler en een Sequoia Scientific LISST (laser in situ scattering and transmissometry) 100X type C. Alle data (uitgezonderd van de LISST) worden opgeslaan in twee SonTek Hydra data logging systemen (Backers et al., 2016a, 2016b). De LISST werd gemonteerd op ongeveer 2 meter boven de bodem (verder afgekort als mbb) en de OBSen op 0.2, 1 en 2 mbb. De OBS voltage werd omgezet naar SPM concentratie met behulp van gefiltreerde waterstalen genomen tijdens verschillende meetcampagnes. Vanaf 2014 werd de meetrange van de onderste OBS vergroot, zodat waarden tot 7 g/l kunnen worden gemeten. Figuur 2.1: Frame dat gebruikt wordt in de langdurige metingen te MOW1. Afmetingen zijn ongeveer 2.5 m (hoogte) en 3 m (breedte) Overzicht metingen In tabellen en Figuren wordt een overzicht gegeven van de metingen ter hoogte van MOW1. De details per verankering kunnen in appendix 1 en 2 worden gevonden. Er werden verschillende OBS instellingen gebruikt tijdens de verankeringen. Het meetinterval is afhankelijk of de OBS aan de ADP of de ADV bevestigd was. Voor de ADV, die hoog frequente metingen doet gedurende korte tijd, is het inteval tussen twee metingen groter (15 minuten). Bij de ADP werd om de 2 minuten gemeten. 13
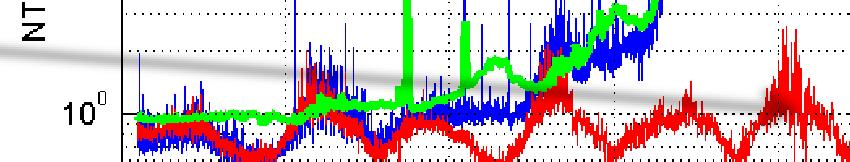
14 Tabel 2.1: Overzicht van OBS te MOW1. Nr measuring period SPM conc. 2 mab SPM conc. 2 mab good data good data days (julian day) (julian day) days 80 ADV 09/12/ /03/ ADP 27/03/ /04/ ADV 28/04/ /05/ ADP 21/05/ /07/ ADV 04/07/ /09/ ADP 09/09/ /10/ ADV 17/10/ /11/ ADP 20/11/ /12/ ADV 16/12/ /01/ ADV 27/01/ /03/ ADV 16/03/ /04/ ADV 13/04/ /05/ ADV 08/05/ /06/ ADV 15/07/ /10/ ADV 07/12/ /01/ Tabel 2.3: Overzicht van ADP metingen te MOW1. Nr measuring period ADP ADV good data good data days (julian day) (julian day) days 80 09/12/ /03/ /03/ /04/ /04/ /05/ /05/ /07/ /07/ /09/ /09/ /10/ /10/ /11/ /11/ /12/ /12/ /01/ /01/ /03/ /03/ /04/ /04/ /05/ /05/ /06/ /07/ /10/ /12/ /01/ Spanningstoevoer naar OBS Het teruggekaatste signal uitgezonden door de OBS3+ wordt als Voltage opgeslaan. In zuiver water registreert een OBS 0 V, bij toenemende troebelheid neemt deze waarde lineair toe tot een maximum voltage van ongeveer 5 V wordt bereikt bij het maximale meetbereik. Voor hogere turbiditeiten satureert de OBS. De sensor heeft als input een constant spanning van minimum 6 V nodig om goede data te kunnen geven. Een lagere voedingsspanning resulteert in een schijnbare afname in troebelheid, zie Figuur 2.6. De figuur toont de output van een OBS3+ ingesteld voor het lage ( BU) en het hoge ( BU) meetbereik die gevoed werd met verschillende inputspanningen terwijl de sensor geplaatst was in een standaardoplossing van 2000 Amco-Clear -equivalente BU (Backscatter Unit). Voor een input voltage van meer dan 6 V registreert de OBS3+ in het lage meetbereik een constant waarde van 5.1 V (saturatie), terwijl in het hoge meetbereik een half zo grote waarde wordt opgeslaan (2.5 V). Indien de voedingsspanning afneemt, dan registreert ook de OBS3+ een afname. Een lagere voedinsgspanning kan voorkomen bij een afname van de batterijspanning of bij technische problemen met de meetapparatuur. Dit laatste werd opgemerkt in de tijdseries vanaf 2014, zie een voorbeeld in Figuur 2.7. De fi- 14
15 guur toont dat tengevolge van een slecht functioneerend instrument (data logger van de SonTek Hydra) een lagere dan de vereiste 6 V naar de OBS3+ kwam, waardoor het outputsignaal significant lager was. De tripode werd op dag 118 vervangen door een gelijkaardig systeem. Voor verankering 84 werd hetzelfde systeem gebruikt als voor verankering 82. Het foutieve signaal kon aan de hand van de curve in Figuur 2.6 gecorrigeerd worden, zie Figuur 2.8 voor een voorbeeld. Figure 2.6: Voltage provided by an external source to a Campbell OBS3+ (T8549) measuring in a standard solution of 2000 AmcoClear equivalent BU. When the voltage supply drops below 6 V, the sensor registers too low values. Figure 2.7: SPMC tijdseries tijdens verankeringen gemeten met Campbell OBS3+ instrument (op 2 m boven bodem) die aangesloten waren op een SonTek Hydra data logging systeem voor dataopslag en batterijspanning: Foutieve data in verankering 82 en 84 en onder de gecorrigeerde data. 15
 die aangesloten waren op een SonTek Hydra data logging systeem voor dataopslag en")
16 Figure 2.8: SPMC tijdseries tijdens verankeringen gemeten met Campbell OBS3+ instrument (op 2 m boven bodem) die aangesloten waren op een SonTek Hydra data logging systeem voor dataopslag en batterijspanning: gecorrigeerde data Omrekening akoestische en optische backscatter naar SPM concentratie Het OBS signaal werd gebruikt om de SPM concentratie te bepalen. De OBS voltages warden omgezet in SPM concentration via een sensor calibratie (V FNU) en nadien via een calibratie met gefiltreerde waterstalen verzameld gedurende enkele getijcycli per jaar (februari 2014, april 2014, 2 september 2014, 2 november 2014, december 2014, januari 2015, april 2015, december 2015). Een lineaire regressie werd gebruikt als correlatie tussen het OBS signaal (in FNU) en de SPM concentration uit de gefiltreerde waterstalen (in mg/l). De regressive coefficient (R²) was hoger dan 0.90 (Backers et al. 2016a, 2016b); de onzekerheid op de OBS-SPM concentratie werd geschat op 10% (Fettweis, 2008). The ADP profiler was gemonteerd op 2.3 m boven de bode men heft stroomsnelheid en backscatterintensiteit gemeten met een resolutie van 15 cm beginnend op 1.9 m boven de bodem. De onderste bins die niet verstoord was door de bodem bevindt zich op 0.55 m boven de bodem. Het teruggekaatste akoestische signaal werd gebruikt om de SPM concentratie te berekenen. Na omzetting in decibels, werd de signaalsterkte gecorrigeerd voor de geometrische spreiding en verzwakking door het water. Verder werd een iteratief process toegepast (Thorne & Hanes 2002) om te corrigeren voor signaalafzwakking door het sediment in suspensie. De SPM concentratie afgeleid van de bovenste OBS werd gebruikt om de eerste bin van de ADP te calibreren. Terugkaatsing van het akoestisch signal wordt beïnvloed door het type sediment, de kleur, partikelgrootte, samenstelling en turbulentie. Optische en akoestische terugkaatsing hebben een andere gevoeligheid voor deze parameter (Thorne et al. 1991; Fugate & Friedrichs 2002; Voulgaris & Meyers 2004; Downing 2006; Nauw et al. 2014). De echo intensiteit van het teruggekaatste akoestisch signal geeft een goede achatting van de SPM concentration zolang de partikelgrootte en karakteristieken hetzelfde blijven. Dit is dikwijls niet het geval in getijomgevingen waar fijnkorrelige sedimenten onderhevig zijn aan flocculatie an waar cohesieve en nietcohesieve sedimenten tegelijkertijd in suspensie kunnen voorkomen (Baeye et al. 2011; Fettweis et al. 2012). Vlokken beïnvloeden de terugkaatsing minder sterk dan een zandkorrel van dezelfde grootte tengevolge van hun lagere densiteit (Ha et al. 2011). De sterkte van het door vlokken teruggekaatste signa wordt vooral (maar niet uitsluitend) beïnvloed door de bouwstenen van de vlokken, dit zijn de primaire deeltjes en microvlokken (flocculi) (Fugate & Friedrichs 2002; MacDonalds et al. 2013; Rouhnia et al. 2014). De ver- 16

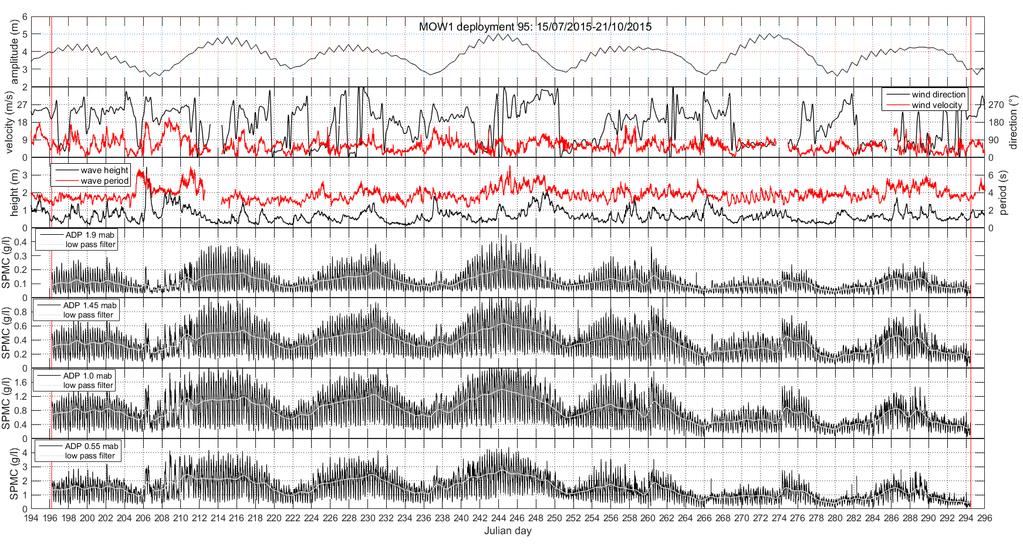
17 schillende gevoeligheid van akoestische en optische sensoren op veranderingen in SPM partikelgrootte en eigenschap weerspiegelt zich in de correlatie coëfficiënt tussen de ADP backscatter (in db) en de OBS-SPM concentratie van R²=0.53. De R² is beter bij lagere SPM concentraties en het regressie model houdt Aldus minder rekening met de variantie van de hoge SPM concentraties Spanningstoevoer naar ADP De actieve sonar vergelijking wordt gebruikt om het teruggekaatste akoestische signal te relateren aan SPMC. De vergelijking kan omgevormd worden (zie b.v. Kim et al., 2004) naar 𝑆𝑣 = 𝐶 + 10 log(𝑇𝑅2 ) 𝐿𝐷𝐵𝑀 𝑃𝐷𝐵𝑊 + 2𝛼𝑅 + 𝐾𝑐 (𝐸 𝐸𝑟 ) waarbij LDBM de 10log10(L) is, PDBW de 10log10(P) met P het vermogen, Kc de Received Sig-1 nal Strength Indicator (RSSI) factor (in db counts ), E de echointensiteit (in counts), Er het 8 𝐾 𝐹 𝐵𝑁 cos 𝜃 ontvangen ruis (in counts) en 𝐶 = 10 log. Verder zijn Ex de tranducer efficien2 2 𝜋 𝐸𝑥 𝑑 -1 tie, α de water absorptie (in db m ), R de range to scatterers langsheen de straal (in m), BN de ruis bandbreedte (in Hz) en F de ontvanger ruis factor. C is afhankelijk van de specificaties van de akoestische sensor en PDBW een factor die rekening houdt met het vermogen van het uitgzonden akoestisch signaal. Het vermogen afgeven door de batterij neemt in functie van de tijd af (zie Figuur 2.9) en dient dus gecorrigeerd te worden. Voor een 3000 khz system is Pdbw geschat op 0.7 (zie Kim et al., 2004), wat overeenkomt met een vermogen P van W. Uit de geregi-1 streerde batterijspanning aan de ADP sensor kan dan de weerstand (R=U²/P ) geschat worden die constant is. Uit de stroom (I=U/R) en het vermogen P=U I kan de correctiefactor Pdbw worden berekend voor verschillende batterijspanningen en de SPMC berekend worden als Pdbw=10log10(P²)/R. In Figuur 2.9 wordt een berekening met en zonder correctie getoond voor verankering 95. Volgende verankeringen werden aangepast voor afnemende spanningstoevoer: 80, 85, 95. Figuur 2.9: Verankering 95, afname van de batterijspanning tijdens de verankering en het effect op de backscatter intensiteit en aldus ook op de SPMC van de ADP. De SPMC is deze op 1.9 m boven de bodem met en zonder correctie voor afnemende batterijspanning. 17

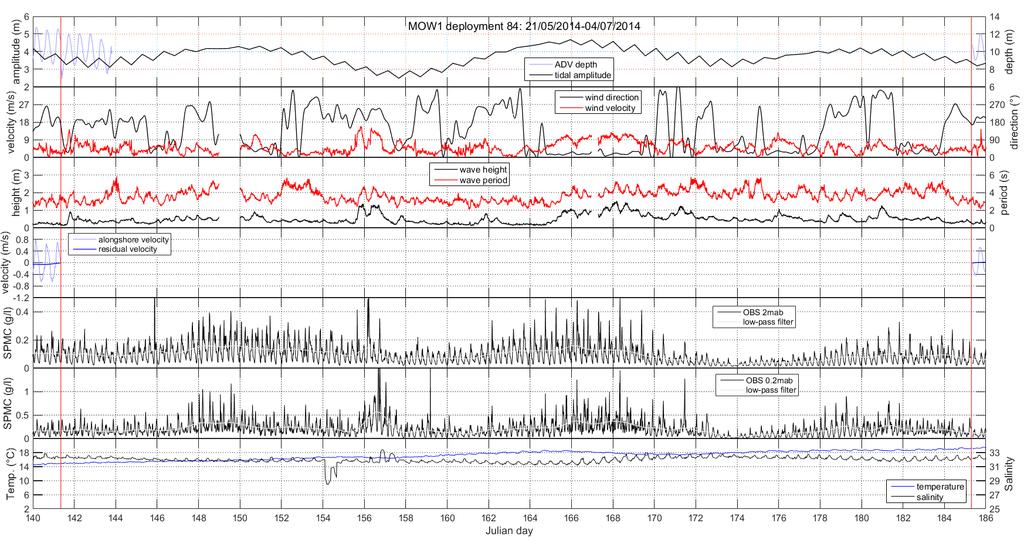
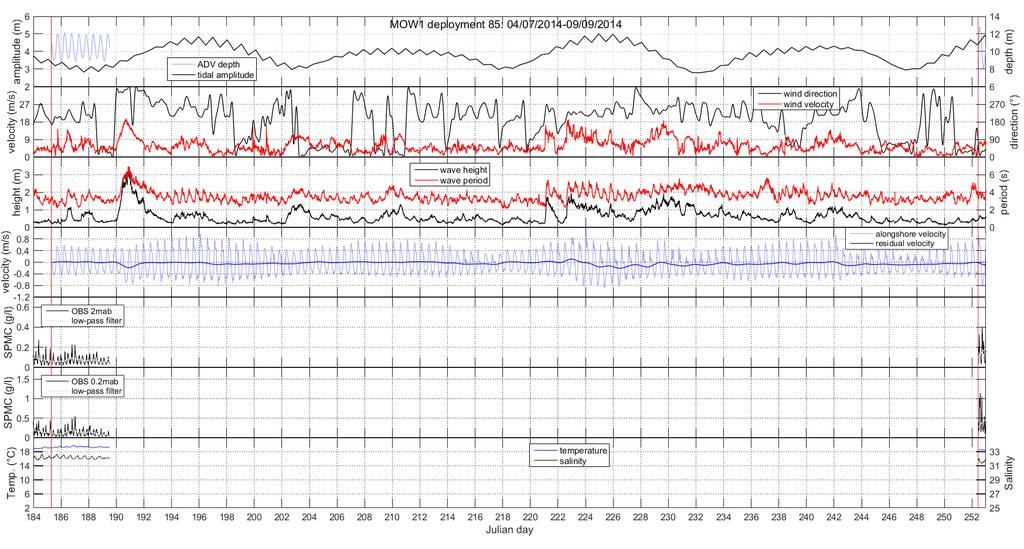
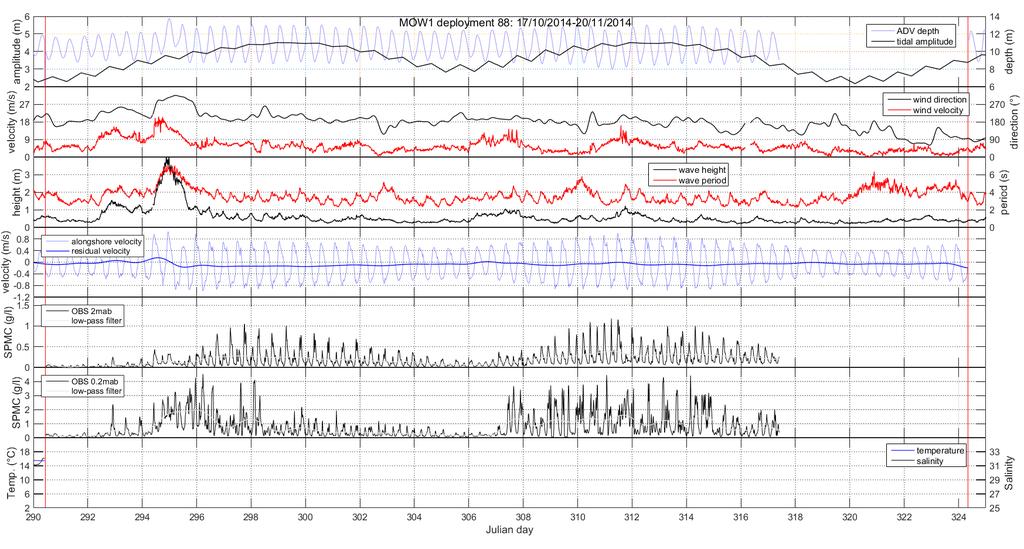
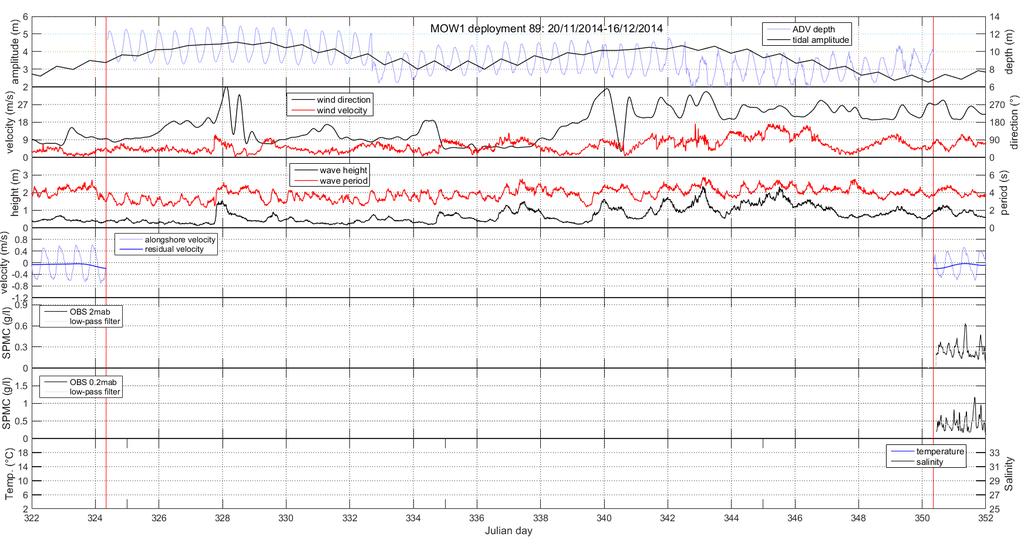
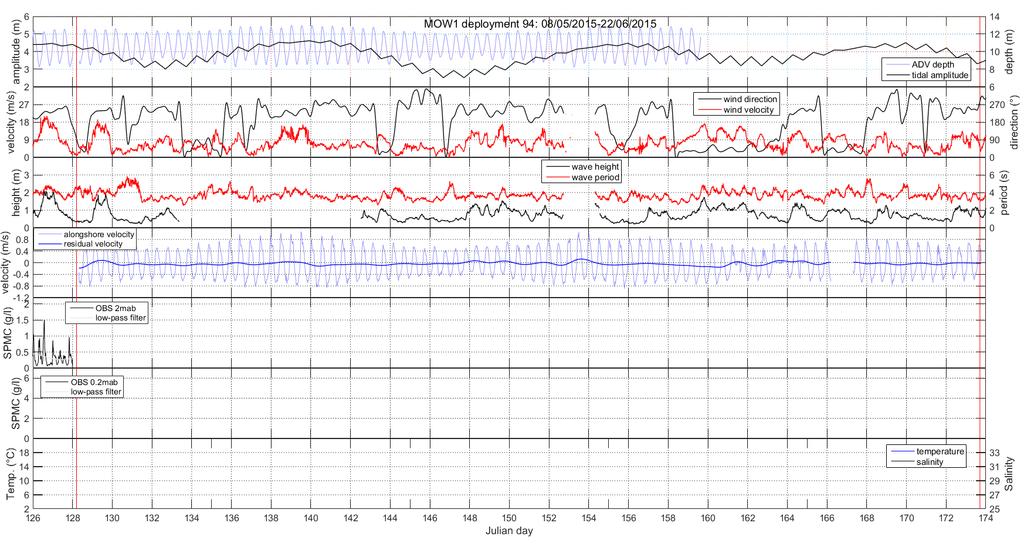
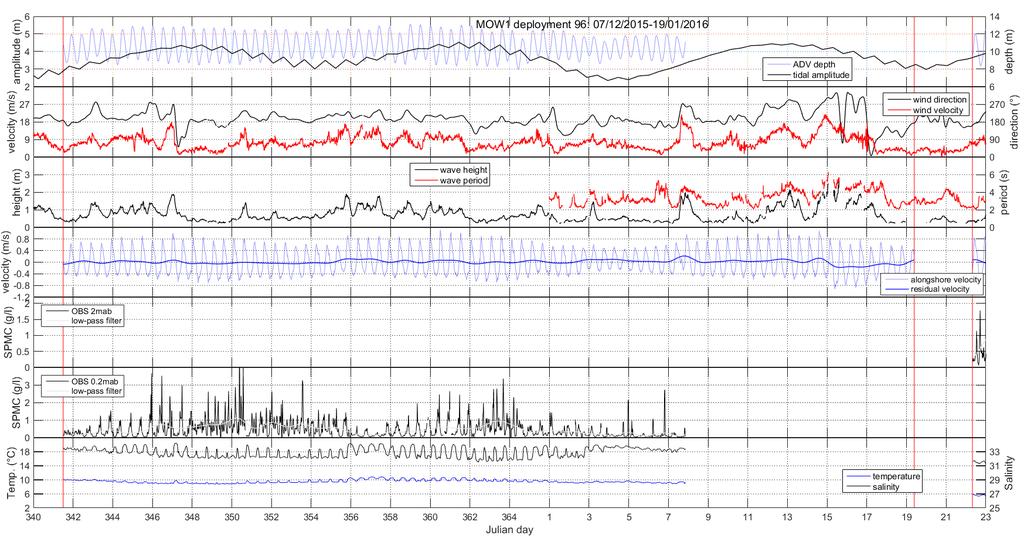
18 Figuur 2.2: MOW1 2014, getijamplitude en waterdiepte gemeten met de ADV, windrichting en snelheid, significante golfhoogt en gemiddelde golfperiode, residuele alongshore stroming, OBS SPM concentratie op 0.2 en 2 m boven de bodem, saliniteit en temperatuur. 18

19 Figuur 2.3: MOW1 2015, getijamplitude en waterdiepte gemeten met de ADV, windrichting en snelheid, significante golfhoogt en gemiddelde golfperiode, residuele alongshore stroming, OBS SPM concentratie op 0.2 en 2 m boven de bodem, saliniteit en temperatuur. 19

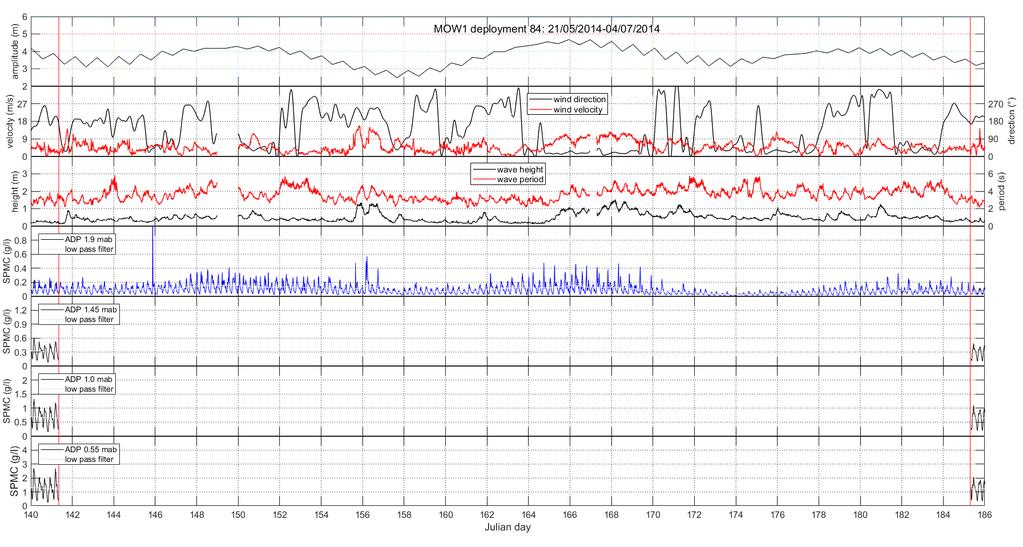
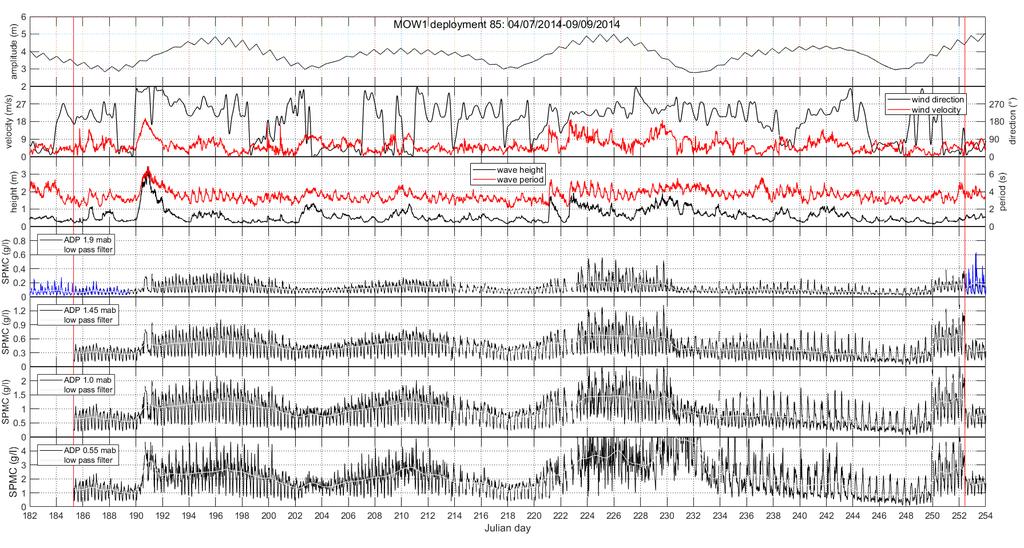
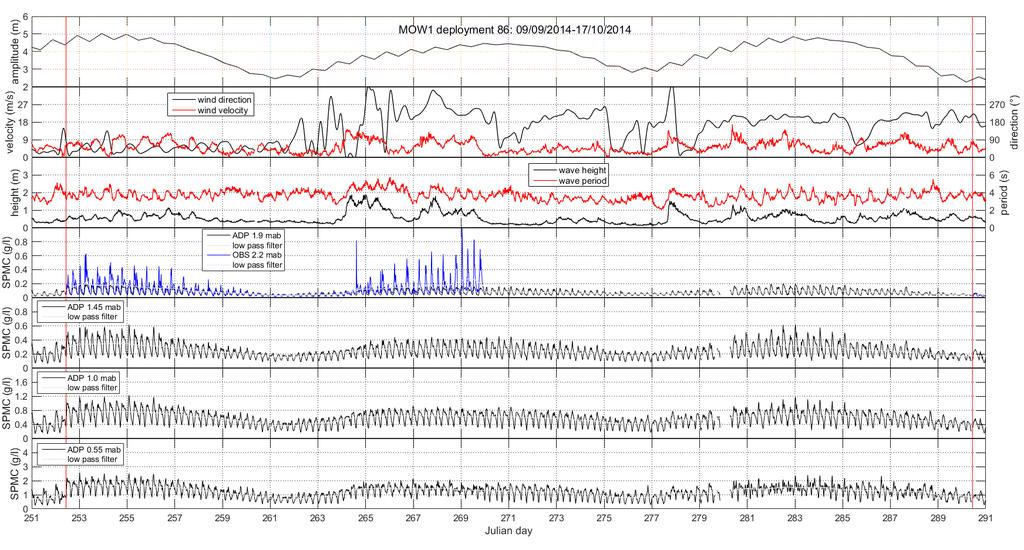
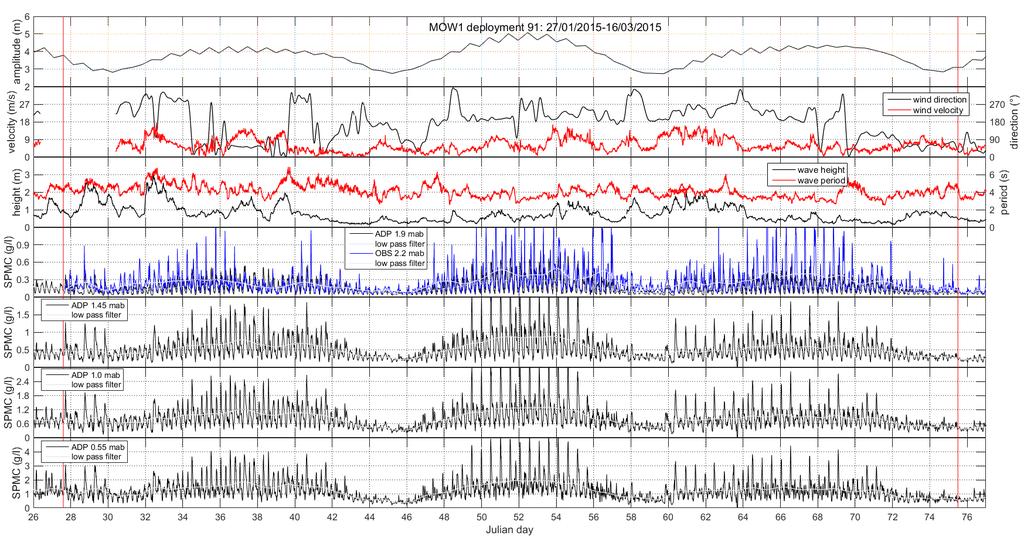
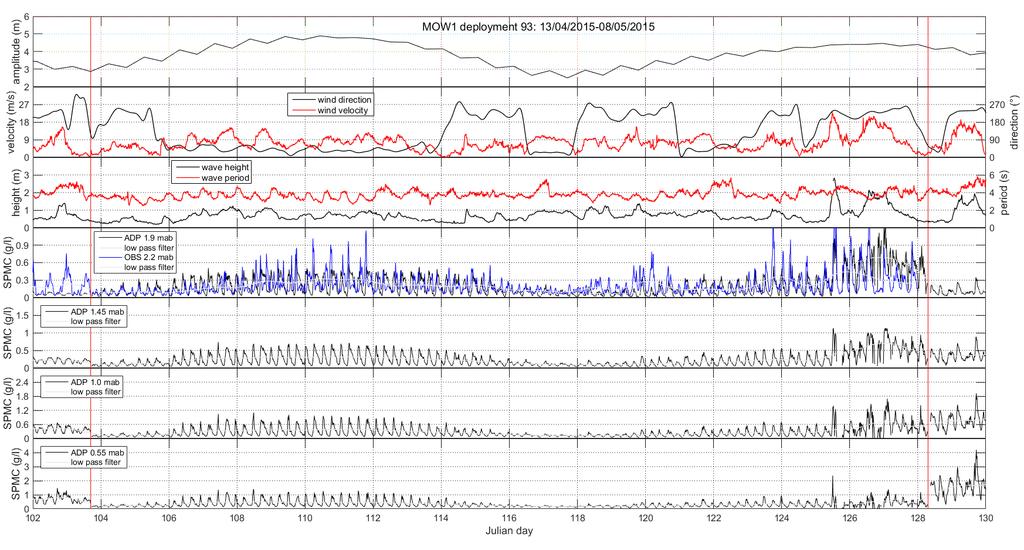
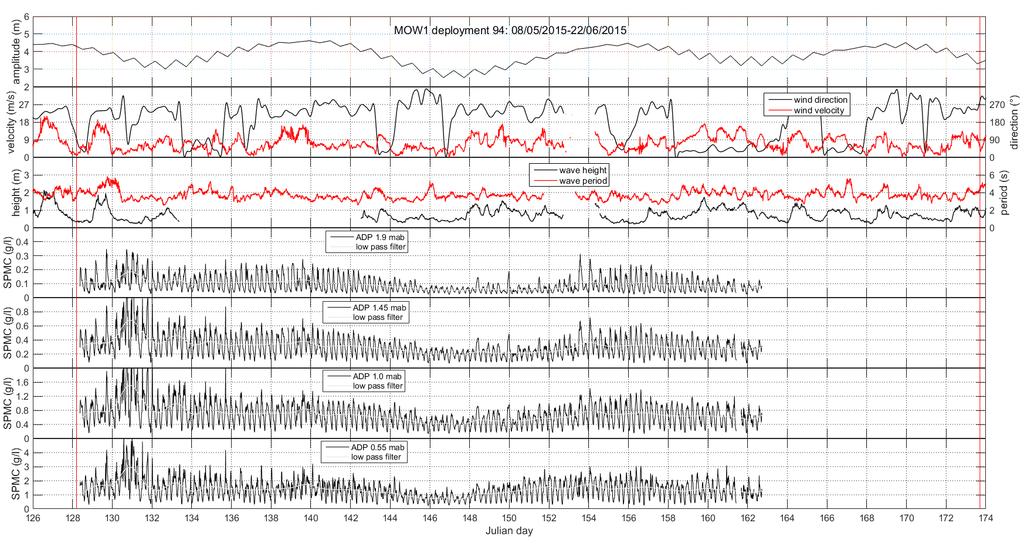
20 Figuur 2.4: MOW1 2014, getijamplitude, windrichting en snelheid, significante golfhoogte en gemiddelde golfperiode, ADP SPM concentratie op , 1 en 0.55 m boven de bodem. 20

21 Figuur 2.4: MOW1 2014, getijamplitude, windrichting en snelheid, significante golfhoogte en gemiddelde golfperiode, ADP SPM concentratie op , 1 en 0.55 m boven de bodem. 21
22 3. Referenties Backers J, Hindryckx K, Vanaverbeke W. 2016a. Rapport van de RV Belgica Meetcampagnes en Verankering van Meetsystemen MOMO BMM-rapport BMM- MDO/ /MOMO/2015, 89pp. Backers J, Hindryckx K, Vanaverbeke W. 2016b. Rapport van de RV Belgica Meetcampagnes en Verankering van Meetsystemen MOMO BMM-rapport BMM- MDO/ /MOMO/2014, 165pp. Baeye M, Fettweis M, Voulgaris G, Van Lancker V Sediment mobility in response to tidal and wind-driven flows along the Belgian inner shelf, southern North Sea. Ocean Dynamics 61, , doi: /s Downing J Twenty-five years with OBS sensors: the good, the bad, and the ugly. Continental Shelf Research 26: , doi: /j.csr Fettweis M Uncertainty of excess density and settling velocity of mud flocs derived from in situ measurements. Estuarine Coastal and Shelf Science 78, doi: /j.ecss Fugate DC, Friedrichs CT Determining concentration and fall velocity of estuarine particle populations using ADV, OBS and LISST. Continental Shelf Research 22, Ha HK, Maa JP-Y, Park K, Kim YH Estimation of high-resolution sediment concentration profiles in bottom boundary layer using pulse-coherent acoustic doppler current profilers. Marine Geology 279, doi: /j.margeo Lauwaert B, De Witte B, Devriese L, Fettweis M, Martens C, Timmermans S, Van Hoey G, Vanlede J Synthesis report on the effects of dredged material dumping on the marine environment (li-censing period ). RBINS-ILVO-AMT-AMCS-FHR report BL/2016/09, 107pp. MacDonald IT, Vincent CE, Thorne PD, Moate BD Acoustic scattering from a suspension of flocculated sediments. Journal of Geophysical Research 118, , doi: /jgrc Nauw JJ, Merckelbach LM, Ridderinkhof H, van Aken HM Long-term ferry-based observations of the suspended sediment fluxes through the Marsdiep inlet using acoustic Doppler current profilers. Journal of Sea Research 87, doi: /j.seares Rouhnia M, Keyvani A, Strom K Do changes in the size of mud flocs affect the acoustic backscatter values recorded by a Vector ADV? Continental Shelf Research 84, doi: /j.csr Thorne PD, Vincent CE, Hardcastle PJ, Rehman S, Pearson ND Measuring suspended sediment concentrations using acoustic backscatter devices. Marine Geology 98, Thorne PD, Hanes DM A review of acoustic measurement of small-scale sediment processes. Continental Shelf Research 22, Voulgaris G, Meyers S Temporal variability of hydrodynamics, sediment concentration and sediment settling velocity in a tidal creek. Continental Shelf Research 24, , doi: /j.csr
23 COLOPHON Dit rapport werd voorbereid door de BMM in juni 2017 Zijn referentiecode is.momo/7/mf/201706/nl/ar/6 De scheepstijd met de RV Belgica werd voorzien door BELSPO en KBIN-OD Natuur Indien u vragen hebt of bijkomende copies van dit document wenst te verkrijgen, gelieve een te zenden naar mfettweis@naturalsciences.be, met vermelding van de referentie, of te schrijven naar: Koninklijk Belgisch Instituut voor Natuurwetenschappen OD Natuur BMM t.a.v. Michael Fettweis Gulledelle 100 B 1200 Brussel België Tel: BEHEERSEENHEID VAN HET MATHEMATISCH MODEL VAN DE NOORDZEE 23
24 APPENDIX 1 Time-series MOW1 OBS-SPM concentration from up to down 1. Harmonic tidal range at Zeebrugge and depth recorded by the ADV 2. Wind direction and velocity at Wandelaar (Meetnet Vlaamse Banken) 3. Wave height and period at A2-buoy (Meetnet Vlaamse Banken) 4. Alongshore current velocity at 1.8 mab recorded by the ADP and the residual velocity 5. OBS-derived SPM concentration at 2 mab 6. OBS-derived SPM concentration at 0.2 mab 7. Salinity and temperature A1 1

25 A1 2

26 A1 3
27 A1 4
28 A1 5

29 A1 6
30 A1 7
31 A1 8

32 A1 9

33 A1 10

34 A1 11

35 A1 12
36 A1 13

37 A1 14
38 A1 15
39 APPENDIX 2 Time-series MOW1 ADP-SPM concentration from up to down 1. Harmonic tidal range at Zeebrugge 2. Wind direction and velocity at Wandelaar (Meetnet Vlaamse Banken) 3. Wave height and period at A2-buoy (Meetnet Vlaamse Banken) 4. SPM concentration at 1.95 mab (ADP and OBS) 5. SPM concentration at 1.45 mab 6. SPM concentration at 1.0 mab 7. SPM concentration at 0.55 mab A2 1

40 A2 2

41 A2 3

42 A2 4
43 A2 5
44 A2 6
45 A2 7

46 A2 8
47 A2 9

48 A2 10
49 A2 11

50 A2 12
51 A2 13
52 A2 14
53 A2 15

54 A2 16
55 APPENDIX 3 Bijdragen (abstract, poster) ECSA Conference Coastal system in transition: from a natural to an anthropogenically modified state, 4-7 September 2016, Bremen (Germany) 1
56 Abstract ECSA 56 Coastal systems in transition: from a natural to an anthropogenically-modified state, 4-7 September 2016, Bremen, Germany Remote sensing of suspended particulate matter concentration, inter-comparison with surface buoy and tripod lander data M Baeye 1, F Francken 1, M Fettweis 1 1 Royal Belgian Institute of Natural Sciences, Dir. Natural Environment mbaeye@naturalsciences.be The dynamics of suspended particulate matter (SPM) control processes such as sediment transport, deposition, resuspension, primary production and benthic communities. Automated tripods allow recording of continuous time series of SPM concentration (SPMC) near the bottom at specific sites and are the only method to detect the effects of storms at sea on the SPM dynamics. On the other hand, large synoptic scenes of surface SPM concentrations may be retrieved from satellites. Time series of in situ SPM concentration and satellite imagery MODIS Aqua and Landsat 8 OLI) are valuable data sources for the analysis of suspended sediment transport in coastal areas. Still, shortcomings remain, with satellite imagery suffering from a low temporal resolution and only related to surface data, whilst in situ measurements have a limited spatial resolution. Both data can be combined when the vertical variation and the temporal SPM concentration heterogeneity are known. SPM concentration is measured near the seabed (tripods) and at the surface (remotely). The missing link is the in situ concentration at the surface that was tackled by using a sensor buoy measuring SPMC. This configuration increased the number of match-ups (satellite picture at the same time as in situ measurements), and allowed to establish a relation between surface SPMCs, measured in situ (buoy) and remotely (satellite) on one hand, and between the in situ measured SPMCs at the surface (buoy) and near the bottom (tripod) on the other hand. The overall conclusion of the first trials is that an optical backscatter sensor instrumented on a surface buoy is a valuable tool towards better understanding the temporal (and also the spatial) SPM dynamics in the high-turbidity area in front of the Belgian coast.
 inter-comparison")

 SPM dynamics")


 lunar cycle (see FIG 1,")


.")


.")


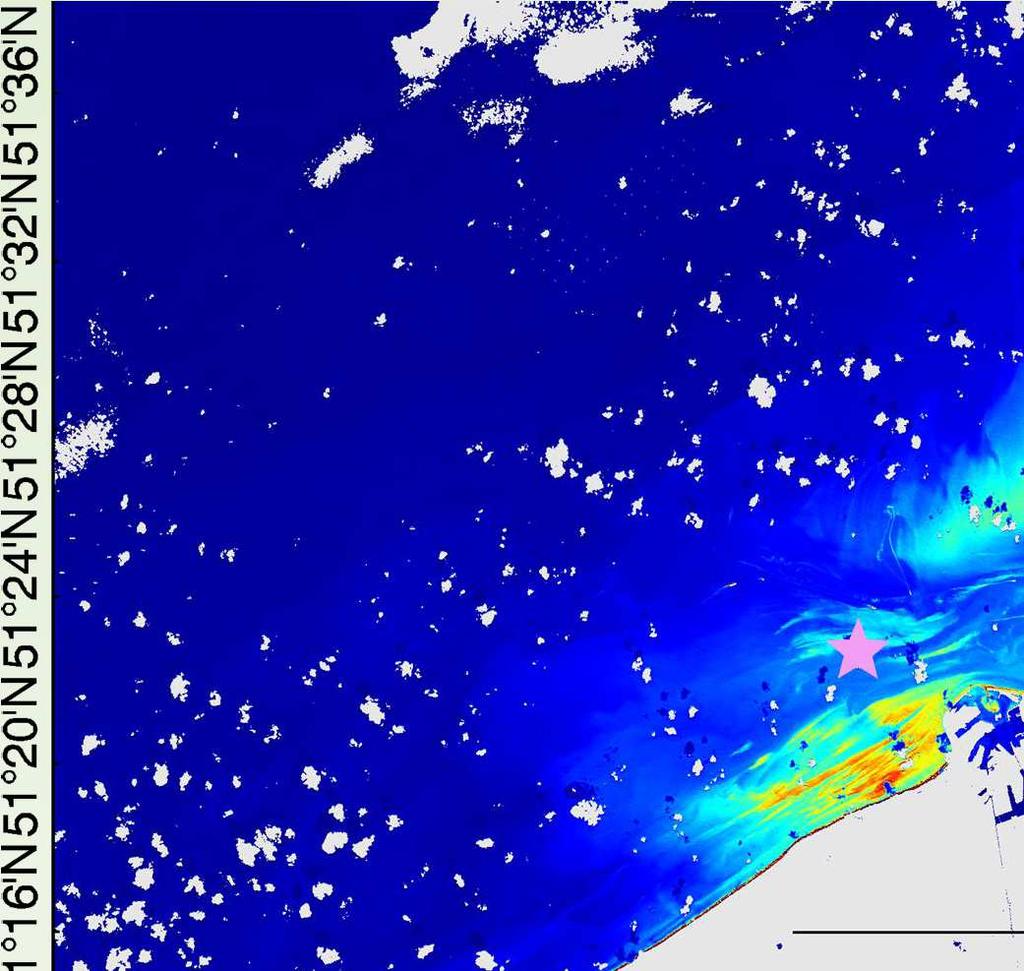
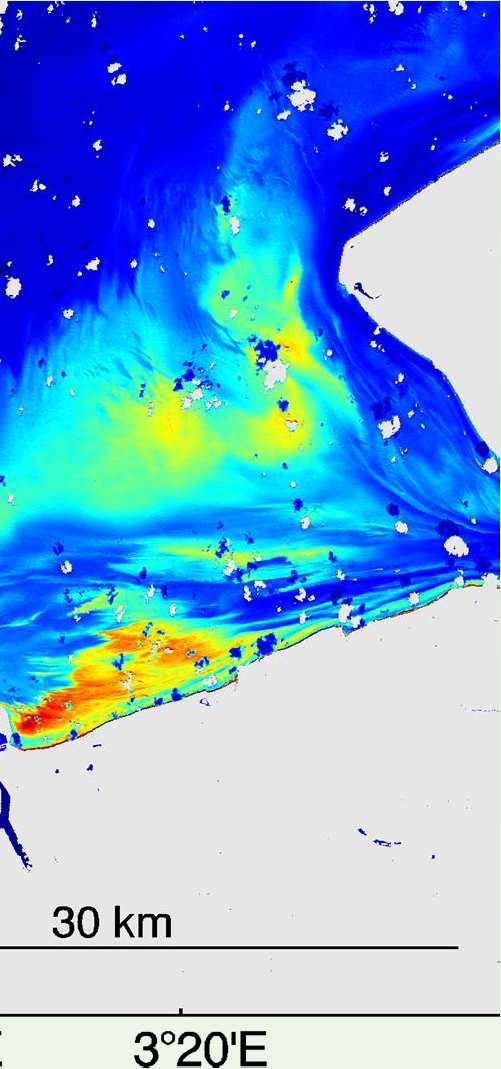


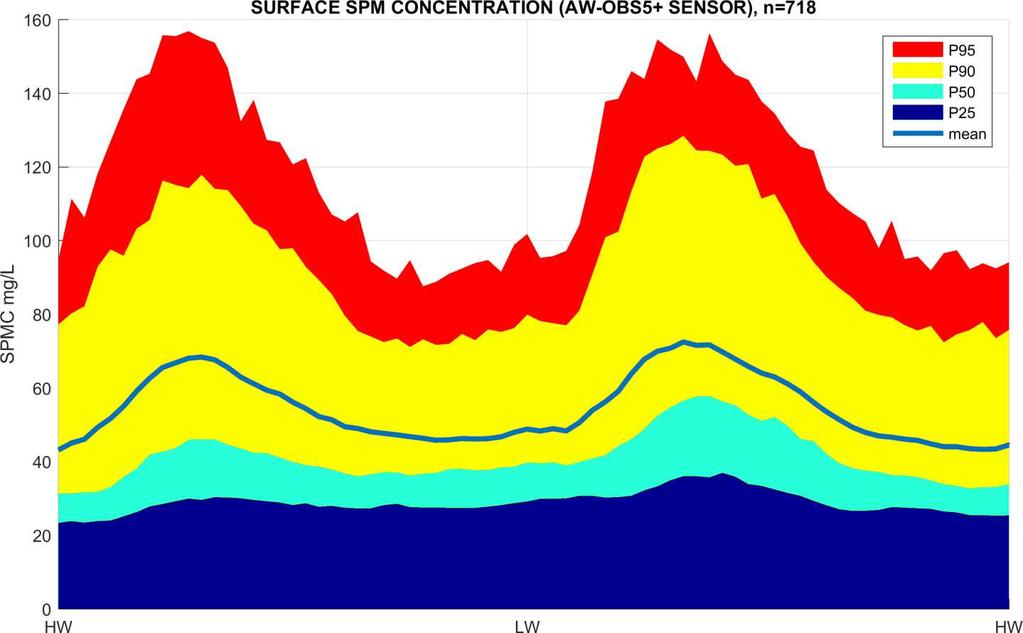


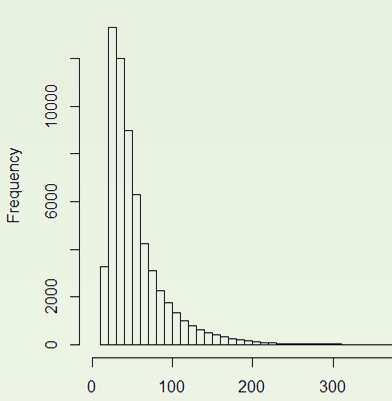


57 Remote sensing of suspended particulate matter concentration (SPMC) inter-comparison with surface buoy and tripod lander data Matthias Baeye, F. Francken, M. Fettweis From in-situ measurements (both tripod lander and surface buoy) SPM dynamics reveal a well-known semi-diurnal signal of higher and lower SPMC during increased and decreased current speeds resp. (FIG 2). This cycle is superimposed on the overall spring (higher SPMC background) neap (lower SPMC background) lunar cycle (see FIG 1, bottom graph). The seasonal changes in the surface SPMC are likely due to the organic matter content that is higher in spring-summer causing SPM flocs to grow (macroflocs) and deposit massively (Fettweis et al. 2014). In this study, we wanted to investigate 1) the accuracy of the match-ups between in-situ and satellite data, 2) how well satellite derived SPMC data compare with in-situ SPMC and 3) the spatial variability in SPMC in satellite images vs. the temporal buoy SPMC variability. FIG 2 Surface buoy measurements with a OBS5+ turbidity meter were realised at about 6 km off the Belgian coast (FIG 2). The sensor is Campbell Sc. OBS5+ with laser wavelength of 780 nm, scattering angles between 105 and 165 and a necessary antifouling wiper. Collected data were quality checked and published at PANGAEA. tripod lander Just south of the buoy, a was deployed for measuring the daily fine sediment dynamics. As a result of the waterdepth between 10 and 14 m, surface SPMC peaks occur 2 hours later compared to the SPMC peaks near the bed. FIG 1 log-normal SPMC distribution surface buoy BELGIUM space, From images and corresponding SPMC maps show that the spatial variability is large, with a decreasing SPMC gradient offshore. The high-turbidity area along the BE coast is a consequence of the local hydrodynamics, rodynamics, the presence of the W-Scheldt river, the erosion of outcropping clay layers, OBS5+ LANDSAT 8 OLI (300 m) MODIS-AQUA FIG 4 LANDSAT 8 OLI For both (FIG 3) and (FIG 4), there is a significant amount of match-up points lying under the 1:1 line implying OBS5+ derived SPMC being higher (2 to 4 times) than the satellite derived SPMC. For the lower LANDSAT 8 OLI SPMC values (i.e. 50% of the match-ups), a good fit was found as a result of the much better spatial resolution. Due to the high spatial variability (see FIG 2) and the increased spatial resolution of nowadays satellite sensors, the precise location of the in-situ surface SPMC measurements therefore is a real MUST. In this study an ARDUINO GPS kept track of the buoy s location. MODIS-AQUA MODISMODIS (250 m) FIG 3 winter summer mer PLEIADES 1-A (1 m) A likely explanation for the bad fit between the different data sources is the often increased SPMC at the location 500 m sediment wake of buoy. The so-called that typically aligns to the current downstream during full current. The origin of these wakes is likely to be the buoy anchorage concrete blocks and chain. This immediately raises the question if the surface buoy and the attached OBS5+ sensor are directly present in this wake effect? (see FIG 5) This phenomenon of sediment wakes has already been observed associated to offshore wind turbines (Baeye and Fettweis 2015, Vanhellemont and Ruddick 2014), measuring piles, oil rigs, and even submerged shipwrecks (Baeye and Fettweis 2016). It explains why sometimes - under full current speeds - the match between SPMC from the OBS5+ and the LANDSAT 8 OLI is bad, especially for the higher range SPM concentrations. Both MODIS-AQUA and LANDSAT 8 OLI are not able to capture this small-scale process, and consequently these sediment plumes will be averaged out in the associated MODIS-AQUA and LANDSAT 8 OLI pixels. SPMC maps derived from PLEIADES is work in progress but first results already correspond with sediment wake concentrations of about 4 times the surrounding concentrations (pers. comm. Q. Vanhellemont), confirming the above-mentioned findings. FIG 5 1 km surface buoy Baeye and Fettweis In situ observations of suspended particulate matter plumes at an offshore wind farm, southern North Sea. Geo-Marine Letters 35(4): Baeye and Fettweis Detection of shipwrecks in ocean colour satellite imagery. Jounral of Archaeological Science 66: 1-6. Fettweis, Baeye, Van der Zande, Van den Eynde and Lee Seasonality of floc strength in the southern North Sea Journal of Geophysical Research 199(3): Vanhellemont and Ruddick Turbid wakes associated with offshore wind turbines observed with Landsat 8. Remote Sensing of Environment 145: m
58 SPM concentration measurements in low and high turbulent conditions Michael Fettweis, Matthias Baeye Royal Belgian Institute of Natural Sciences, Operational Directorate Natural Environment Gulledelle 100, B-1200 Brussels, Belgium In nearshore areas turbulence and suspended particulate matter (SPM) concentration vary considerably during a tide. During low turbulence aggregation dominates over floc break-up, resulting in larger flocs and rapid settling of the SPM. During high turbulence, the flocs are breaking-up and the resuspended fine-grained material is mixed throughout the water column. These tidal variations are associated with changes in SPM composition from more organic rich during low to more mineral rich during high turbulence regimes. These changes in composition of the SPM may induce uncertainties when converting the observed optical and acoustical backscatter signals to SPM concentration. In order to investigate how how optical and acoustical sensors react to variations in composition measurements inside and outside the port of Zeebrugge have been carried out. Tidal harbors situated in dynamic and turbid coastal zones have gradients in turbulence ranging from high outside to very low conditions inside the port. They are thus a field laboratory to study the effect of turbulence on SPM concentration. The measurements consisted of ADCP transect from outside towards inside the port and of vertical profiling using CTD, OBS and a LISST 100X at 2 stations inside and one outside the port. Water samples have been taken in the profiling stations to determine SPM, POC and Chl-A concentration. The SPM that enters the harbor is quickly settling within the first hundreds of meters, resulting in a rapid decrease of the SPM concentration inside the harbor. The SPM inside the harbor consist of the slow settling particles and flocs that affects the acoustic and optic backscatter signals.
59 On best-practice for long-term observations of total suspended particulate matter Rolf Riethmüller 1, Michael Fettweis 2 and Romaric Verney 3 1 Helmholtz-Zentrum Geesthacht, Germany 2 Royal Belgian Institute of Natural Sciences, Brussels, Belgium; 3 Ifremer, Brest, France; Measurement of suspended particulate matter concentration (SPMC) spanning long time and large geographical scales became a matter of growing importance in the last two decades. Worldwide numerous observation platforms were installed to capture temporal and spatial variability from turbulent regimes to decades, from local scales to whole basins. Direct (samples) or indirect (optical and acoustic sensors) measurements of SPMC are inherently associated with a number of uncertainties along the whole operation chain from laboratory work over mostly unsupervised long-term deployments to final conversion of the observed continuous optical and acoustical proxy values to SPMC. When observation comprises systems of numerous sensors, minimisation of methodological inconsistencies and control of uncertainties in each step become a critical issue to achieve unambiguous statistical significance to detect events and trends in long-term data or to separate anthropogenic impact from natural variations. Despite several years of practical experience in a number of institutions with systems operating in highly dynamic and productive coastal ocean environments, proper comprehensive and agreed operational guidelines have not been formulated so far. To collect knowledge on potentials and limitations of present practice, more than 20 experts from science to management institutions of four West-European countries gathered for a two-day workshop in February this year. As an outcome a number of recommendations were formulated that shall be published as a basis to acquire best quality-assured SPMC data sets obeying procedures put forward by the expert group. On the basis of examples we will illustrate main sources of uncertainties, e.g. variabilities in optical or acoustical properties of the suspended particles, biofouling in connection with limited accessibility to the observational sites, or different regression models. Further we will present means to quantify and reduce their ranges and a set of recommendations for suitable protocols.
60 APPENDIX 4 Bijdrage (abstract, poster) ICES Annual Science Conference, September 2016, Riga (Latvia) 1
61 ICES CM 2016 / Session O: When is enough, enough? Methods for optimising, evaluating, and prioritising of marine data collection Rolf Riethmüller, Michael Fettweis and Romaric Verney Best-practice for long-term observations of total suspended particulate matter in coastal marine environments Total suspended matter concentration (SPMC) is a key parameter to assess the status of and impacts to marine environments. To capture its high variabilities over long time periods numerous observation platforms were being installed worldwide to identify and predict changes induced by e.g. human activities. They combine direct (samples) with indirect (optical and acoustic sensors) measurements of SPMC. The long-term operations are inherently associated with uncertainties along the whole operation chain from in situ calibration of the sensors, laboratory work, mostly unsupervised long-term deployments to final sensor output conversion. Knowledge of these uncertainties are needed to obtain validated time series that can be used for direct (e.g. trend lines, moving averages) or indirect predictions (e.g. validated numerical models) of the environmental status. Despite several years of practical experience with systems operating in highly dynamic and productive coastal ocean environments, proper comprehensive and agreed operational guidelines have not been formulated so far. International guidelines exist only for water sample data but not for the usage of indirect systems. To collect knowledge on potentials and limitations of present practice, more than 20 international experts gathered for a two-day workshop in February this year. As an outcome a number of recommendations were formulated that shall be published as a basis to acquire best quality-assured SPMC data sets obeying procedures put forward by the expert group. On the basis of examples we will illustrate main sources of uncertainties, present means to quantify and reduce their ranges, and a set of recommendations for suitable protocols. Keywords: monitoring methodology, suspended particulate matter, turbidity, long-term time series Contact author: Rolf Riethmüller, Institute of Coastal Research, Helmholtz-Zentrum Geesthacht, Max- Planck-Str. 1, Geesthacht, Germany, Phone +49 (0) , Fax +49 (0) , Mobile +49 (0) , rolf.riethmueller@hzg.de
 2 Rolf Riethmüller1, M. Fettweis2, R.")


 Glider")


62 1 On best-practice for long-term observations of total suspended particulate matter (SPMC) 2 Rolf Riethmüller1, M. Fettweis2, R. Verney3, J. Backers, M. Baeye, M. Becker, M. Chapalain, S. Claeys, J. Claus, D. Depreitere, J. Deloffre, G. Flöser, S. Grünler, F. Jourdin, R. Laftite, J. Nauw, B. Nechad, R. Röttgers, A. Sottolichio, W. Vanhaverbeke, T. van Hoestenberge, H. Vereecken Challenges with long-term and large-scale SPMC observations 3 Existing guidelines are incomplete & not commonly followed. ¾ Involvement of numerous platforms, sensors, procedures ¾ Preservation of data homogeneity and accuracy under harsh and variable environmental conditions. Brussels Feb 2016 Integrated Coastal Ocean Observing Systems Example: COSYNA ¾ How reliable or consistent are in-situ SPMC data over time from local to European scales? ¾ What do we know about errors/uncertainties: sources and magnitudes? ¾ What is present practice in authorities, research institutions and companies? (Coastal Observing System of Northern and Arctic Seas) Glider FerryBoxTor Dania Remote Sensing Undulating fish ¾ ICES guidelines comprise only samples Long-term implementations Objectives ¾ USGS guidelines cover many but not all parts of the operational chain and provide no means how to make the different methods used in e.g. European institutes comparable/consistent. Biofouling after a month Aquadopp acoustic bsc Wetlabs ECO NTU Expert workshop ¾ inform about practice, success and failures ¾ discuss error sources & magnitudes of all processing steps ¾ contribute to the development of international standards. ¾ lay the basis and procedures to publish data as DOI Onset of biofouling? Integration of several SPMC surrogates & remote operation demand a complex and work-intense operational chain Pre-Measurement Planning Instrumentation Required precision & accuracy Interpretation parameters Real SPMC Water samples SPMC:= Filter load Sample SPMC Optical sensors Backscatter intensity Attenuation Operation resources ships, divers, regular maintenance emergency cases Acoustic sensors Backscatter intensity Regression model f(bsc, frequ, inherent opt. properties) Inverse model f(bsc, frequ., S, T, inherent acoust. properties) SPMC:= Acoustical SPMC Lab calibration Filtration: Highly variable filter offsets Tidal variability of Turbidity-SPMC relationship 1. Salt retention in the rim of the filter In estuaries intense and variable flocculation processes can substantially impact the homogeneity of SPMC time series Sample SPMC [kg m-3] Æ process filter offset highly variable: -0.1 to 1 mg, mean 0.5 mg 2. Sample specific filter offsets Röttgers et al., 2014 Slope= 'Weight/'Vol:=Conc. Spring Tide SPMC= *NTU Seine Estuary OBS [NTU] sample specific filter offset [mg] Æ sample filter offset highly variable: - 4 to 7 mg inducing errors > 100% Æ to achieve errors < 15 %, 20 mg of SPM have to be filtered Æ Unknown sample filter offset: 1 % error for SPMC=100 gm % for 1 gm-3 (1 dm-3filtered vol.) Sample SPMC [kg m-3] Neap Tide Intense Sampling activities Threats to accuracy & precision covering full energetic range Biofouling Sensor failures Changes seasons, extreme in events mitigation measures Electronic drift optical/acoustical correction procedures Operation resources ships, divers, regular maintenance intercomparison emergency cases Sensor (also of identical type) & long-term functioning using proper standards OBS [NTU] Optics degradation Bio-fouling Human errors particle characteristics Comparison with Filtration errors well-calibrated Sample large volumes for reference systems high masses on filter or determine (Near) Real-time Intercalibration monitoring activities individual filter offsets with external groups Post-Measurement Post-processing processing Optics Robust Data QSregression Flagging Acoustics Removal inverse Best Corrections modelling approach? Model opt/acoust Æ SPMC Uncertainty estimations Sensor intercomparison & long-term functioning Accuracy and precision measures Lab calibration Human errors Post-processing Data QS Flagging Removal Corrections Model opt/acoust Æ SPMC (Near) Real-time monitoring Uncertainty estimations Maintenance In-situ calibration Interpretation surveys Maintenance In-situ calibration Examples Interpretation surveys Lab calibration Alternative regression models for Turbidity-SPMC Depending on outliers changes in slope between 10 & 100% Options: Standard linear regression SPMC =f(turbidity) Inverse of standard linear regression Turbidity=f(SPMC) Eigenvalue Fit (SPMC and Turbidity independent variables) Robust linear regression (weight with inverse distance to regression) Theil-Sen Regression Theil Sen Fit: Slopes between all pairs SPMC=0.0006*NTU Towards best practice: Recommendations Measurement Instrumentation Sufficient operational Required precision & resources for accuracy accuracy and precision measures Interpretation and system recovery parameters Changes in optical/acoustical particle characteristics Æ This results in hardly controlable errors & uncertainties Planning Sensor failures Electronic drift Optics degradation Bio-fouling Accuracy and precision measures SPMC:= Optical SPMC Pre-Measurement Post-Measurement Measurement Threats to accuracy & precision Lab calibration Joint publication Errors and uncertainties & Comprehensive protocol along the operation chain Quantification & hierarchy of errors Required actions towards harmonised SPMC measurements in estuarine and coastal waters Slope of the fit = Median Intercept=median(TSM-slope*OBSbox) Sample SPMC [g m-3] Sample SPMC [g m-3] will require consistent, quality assured and well documented data sets SPMC as an EMODNET parameter will and has to come! Contact: Dr. Rolf Riethmüller Helmholtz-Zentrum Geesthacht, Germany Phone +49 (0) rolf.riethmueller@hzg.de Dr. Michael Fettweis Royal Belgian Institute of Natural Sciences, Belgium Phone +32 (0) mfettweis@naturalsciences.be Dr. Romaric Verney Ifremer, France wwz.ifremer.fr Phone +33 (0) romaric.verney@ifremer.fr
63 APPENDIX 5 Bijdrage (abstract) Particles in Europe, 3-5 October 2016, Budapest (Hungary). 1
64 SPM concentration measurements in low and high turbulent conditions Michael Fettweis and Matthias Baeye Royal Belgian Institute of Natural Sciences, OD Nature, Gulledelle 100, 1200 Brussels In nearshore areas turbulence and suspended particulate matter (SPM) concentration vary considerably during a tide. During low turbulence aggregation dominates over floc break-up, resulting in larger flocs and rapid settling of the SPM. During high turbulence, the flocs are breaking-up, the resuspended fine-grained material is mixed throughout the water column, and SPM concentration increases. These tidal variations are associated with changes in SPM composition from more organic rich during low to more mineral rich during high turbulence regimes, see Figure 1. The hypothesis is that these changes in composition of the SPM may induce different reaction of acoustic and optical backscatter sensors and thus necessitates a different calibration. Fig. 1: Particulate Organic Carbon (POC) fraction in the SPM, Belgian nearshore area. In order to investigate how these sensors react to variations in composition shipborne measurements inside and outside the port of Zeebrugge have been carried out, see Figure 2. Zeebrugge is a tidal harbor situated in dynamic and turbid coastal zones and has a gradient in turbulence and also SPM concentration ranging from high outside to low inside the port. The SPM that enters the harbor is quickly settling within the first hundreds of meters, resulting in a rapid decrease of the SPM concentration and as a consequence in siltation of the harbor.

65 Station 1 Station 2 Station 3 Fig. 2: Aerial photo of the port of Zeebrugge with the three measuring station indicated. The water is more turbide (brownish color) outside the harbour than inside. Tidal harbors can therefore be used as field laboratories to study the effect of turbulence and thus changes in SPM composition and size on the way OBS and acoustic backscatter sensor measure the particle concentration in the water. The measurements consisted of 300 khz ADCP transect from outside towards inside the port and of vertical profiling using CTD, OBS and a LISST 100X at 2 stations inside and one outside the port during about 8 hours (from 2 h before LW until HW). Water samples have been taken near the bottom in the profiling stations to determine SPM, POC and Chl-A concentration. The optical instruments (OBS3+) and the ADCP backscatter were calibrated against the SPM concentration obtained from samples after filtration. A first result is shown in Figure 3, where the OBS3+ is calibrated against water samples inside and outside the port and in Figure 4 where the particle size distributions are shown in the different stations. As the number of samples is small, it is not yet possible to argue if the differences in calibration curve are due to inherent uncertainties of the procedure or to changes in composition and size of the SPM. A similar calibration will be carried out with the ADCP backscatter. This work will be used to change or optimize the existing calibration protocols to obtain SPM concentration in mg/l from the OBS and acoustic backscatter sensors (ADP, ADV) used in our long-term stations near Zeebugee.
66 Fig. 3: Scatter plot of the OBS3+ output in NTU versus SPM concentration in mg/l obtained from water samples after filtration. The straight line fitted through the data indicates the calibration curve. Fig. 4: Mean particle size distribution in and outside the port Zeebrugge during a vertical profile in the three measuring stations.
67 APPENDIX 6 Bijdrage (abstract) North Sea Conference, 7-10 November, Ostend (Belgium) 1
68 Environmental impact assessment in line with the EU Nature Directives. Van Hoey Gert 1, Devriese Lisa 1, Dewitte Bavo 1, Fettweis Michael 2, Lauwaert Brigitte 2, Parmentier Koen 2, Vanlede Joris 3, Hostens Kris 1, Martens Chantal 4 1 Institute for Agricultural and Fisheries Research (ILVO), Bio-Environmental Research group and Chemical monitoring and Product Technology, Ankerstraat 1, 8400 Oostende, Belgium, gert.vanhoey@ilvo.vlaanderen.be 2 Royal Belgian Institute of Natural Sciences, OD Natural Environment, Gulledelle 100, 1200 Brussels, Belgium 3 Flanders Hydraulics Research, Berchemlei 115, B-2140 Antwerp, Belgium 4 Maritime Access Division, Tavernierkaai 3, 2000 Antwerpen, Belgium The debate on a sustainable performance of human activities, need to be more objectively structured and scrutinized. For this, the assessment criteria developed under the EU Nature Directives (Marine Strategy Framework Directive (MSFD), Habitat Directive (HD, Water Framework Directive WFD)) can form the basis for a scientifically, more uniform environmental impact assessment (EIA). The list of criteria, funded by operational indicators allow a more objective assessment of the degree of impact on the marine ecosystem across human activities. A major obstacle is the variety of criteria between EU Directives, which is likely to be harmonized for Belgian waters. The achievability of such type of EIA is illustrated by the evaluation of the activity of disposal of dredged material at designated areas on the Belgian Part of the North Sea. Substantial dredging activities of mainly fine-grained material take place in the navigation channels and harbors throughout the year. The disposal of this dredged material has effects on the water surface, in the water column and on the seabed. These effects are followed up in a joint monitoring program and a periodical integrated assessment is made, which is now put in line with the MSFD requirements. 10 MSFD criteria/indicators out of the list of 50 used in Belgium have a clear relevance to this activity. Those relevant indicators are related to evaluation of the characteristics of the bottom fauna, chemical pollution and physical changes of the disposal areas. An integrated assessment is possible and easily visualized by means of a star diagram. Based on this information, the effect of the activity itself can be evaluated, monitoring optimized and operational limits for managing allocated. If such approach is applied to all human activities, we will have made a great step towards sustainable management of our marine ecosystem.
69 APPENDIX 7 Fettweis M, Baeye M, Cardoso C, Dujardin A, Lauwaerts B, Van den Eynde D, Van Hoestenberghe T, Vanlede J, Van Poucke L, Velez C, Martens C The impact of disposal of fine grained sediments from maintenance dredging works on SPM concentration and fluid mud in and outside the harbor of Zeebrugge. Ocean Dynamics, 66,
70 Author's personal copy Ocean Dynamics (2016) 66: DOI /s The impact of disposal of fine-grained sediments from maintenance dredging works on SPM concentration and fluid mud in and outside the harbor of Zeebrugge Michael Fettweis 1 & Matthias Baeye 1 & Claudio Cardoso 2 & Arvid Dujardin 2,3 & Brigitte Lauwaert 1 & Dries Van den Eynde 1 & Thomas Van Hoestenberghe 2,4 & Joris Vanlede 3,5 & Luc Van Poucke 2 & Carlos Velez 2 & Chantal Martens 6 Received: 15 February 2016 /Accepted: 12 September 2016 /Published online: 28 September 2016 # Springer-Verlag Berlin Heidelberg 2016 Abstract The amount of sediments to be dredged and disposed depends to a large part on the suspended particulate matter (SPM) concentration. Tidal, meteorological, climatological, and seasonal forcings have an influence on the horizontal and vertical distribution of the SPM in the water column and on the bed and control the inflow of fine-grained sediments towards harbors and navigation channels. About 3 million tons (dry matter) per year of mainly fine-grained sediments is dredged in the port of Zeebrugge and is disposed on a nearby disposal site. The disposed sediments are quickly resuspended and transported away from the site. The hypothesis is that a significant part of the disposed sediments recirculates back to the dredging places and that a relocation of the disposal site to another location at equal distance to the dredging area would reduce this recirculation. In order to This article is part of the Topical Collection on the 13th International Conference on Cohesive Sediment Transport in Leuven, Belgium 7 11 September 2015 Responsible Editor: Erik A. Toorman * Michael Fettweis michael.fettweis@naturalsciences.be validate the hypothesis, a 1-year field study was set up in During 1 month, the dredged material was disposed at a new site. Variations in SPM concentration were related to tides, storms, seasonal changes, and human impacts. In the high-turbidity Belgian near-shore area, the natural forcings are responsible for the major variability in the SPM concentration signal, while disposal has only a smaller influence. The conclusion from the measurements is that the SPM concentration decreases after relocation of the disposal site but indicate stronger (first half of field experiment) or weaker (second half of field experiment) effects that are, however, supported by the environmental conditions. The results of the field study may have consequences on the management of disposal operations as the effectiveness of the disposal site depends on environmental conditions, which are inherently associated with chaotic behavior. Keywords SPM concentration. Dredging and disposal operations. Long-term observational time series 1 Introduction Royal Belgian Institute of Natural Sciences, Operational Directorate Natural Environment, Gulledelle 100, 1200 Brussels, Belgium Antea Group, Buchtenstraat 9, 9051 Ghent, Belgium Department of Mobility and Public Works, Flanders Hydraulics Research, Berchemlei 115, 2140 Antwerp, Belgium Fluves, Waterkluiskaai 5, 9040 Ghent, Belgium Faculty of Civil Engineering and Geosciences, Delft University of Technology, Delft, The Netherlands Department of Mobility and Public Works, Maritime Access Division, Tavernierkaai 3, 2000 Antwerp, Belgium Dredging operations in coastal areas are essential in order to maintain channels and harbors navigable for large vessels. These deepened areas often protected by breakwaters are not in equilibrium with the hydrodynamics, and as a consequence, sediments are quickly accumulating after removal, demanding thus for almost continuous maintenance works. The amount of sediments to be dredged depends to a large part on the suspended particulate matter (SPM) concentration. SPM concentration is highly variable in coastal areas due to tidal, meteorological, climatological, and seasonal forcings (Fettweis and Baeye 2015). These forcings have an influence
71 Author's personal copy 1498 Ocean Dynamics (2016) 66: on the horizontal and vertical distribution of the SPM in the water column and on the bed and control the inflow of finegrained sediments towards harbors and navigation channels (Mehta 1991; van Ledden et al. 2004; Van Maren et al. 2009; Vanlede and Dujardin 2014; Wan et al. 2014). Further to the natural variability, dredging and disposal influence the SPM concentration in the near and far field due to the operations itself and due to dispersal, transport and buffering of the disposed fine sediments (Smith and Friedrichs 2011; Decrop et al. 2015; Van Maren et al. 2015). Massive sedimentation of fine-grained sediments in harbors and navigation channels is often related to the occurrence of fluid mud layers (Verlaan and Spanhoff 2000; Winterwerp 2005; Kirby 2011; Van Maren et al. 2009). Fluid mud may be formed by fluidization of cohesive sediment beds or by the quick settling of larger SPM flocs during slack water resulting in an increase of the near-bed SPM concentration and the formation of lutoclines (Mehta 1991; van Kessel and Kranenburg 1998; Li and Mehta 2000; Becker et al. 2013). The particle-turbulence interactions and the stratification-induced turbulence damping contribute to the formation and stability of these layers (Le Hir et al. 2000; Toorman 2002; Winterwerp 2006). The potential effects of the disposal of fine-grained sediments are relatively well described with respect to environmental issues, such as alteration of benthic and pelagic communities, decrease of water clarity, dispersion of pollutants and nutrients, and changing bathymetry and hydrodynamic processes (Smith and Rule 2001; Stronkhorst et al. 2003; Orpin et al. 2004; Simonini et al. 2005; Bolam et al. 2006; Du Four and Van Lancker 2008; Okada et al. 2009; Stockmann et al. 2009; Fettweis et al. 2011; Agunwamba et al. 2012; Bolam 2012; van Maren et al. 2015). Relatively less attention has been paid to the effect of disposal of finegrained material on the dredging works itself (e.g., Kapsimalis et al. 2013). Depending on the location of the disposal site, significant amounts of the disposed matter may recirculate in suspension or as high concentrated benthic layers back to the dredging areas, increasing thus the volume to be dredged and disposed. A smart relocation of the disposal site that does not induce recirculation is a straight-forward way to decrease dredging volumes, costs, and environmental impact. In order to evaluate the impact of a relocation of disposal site in highly dynamic and turbid areas, continuous measuring stations are mandatory. With increasing implementation of long-term monitoring stations, an understanding of variations and short-term impacts became possible (e.g., Badewien et al. 2009; Garel and Ferreira 2011; Fettweis et al. 2011; Henson 2014; Jalón-Rojas et al. 2015). The harbor of Zeebrugge, situated in the coastal turbidity maximum area along the Belgian coast (southern North Sea), is subject to high siltation rates and, as a result, huge maintenance dredging and disposal works are mandatory (Fettweis et al. 2011). The focus of the present study emerged from numerical model results that have indicated that part of the disposed sediments quickly returned back to the dredging areas and that the mass to be dredged could be decreased by relocating the disposal site (Van den Eynde and Fettweis 2006). In the framework of studies conducted by the Flemish Ministry of Public Works and Mobility to reduce dredging costs, a 1-year field study was set up to validate the model results with in situ data. The field study consisted of 11 months Bbusiness as usual,^ i.e., disposing of the dredged material on the existing disposal site and of a 1- month period where an alternative disposal site without recirculation was used. An extensive monitoring campaign was set up during the field study which consisted of measurements in and outside the harbor of Zeebrugge of various oceanographic, meteorological, and sediment parameters (SPM concentration, current velocity, waves, salinity, temperature, tides, wind, bathymetry, density of mud layers) in order to estimate the impact of the relocation of the disposal site on the SPM concentration and on the fluid mud dynamics in and outside the harbor of Zeebrugge. A key element in the analysis is the use of environmental parameters that allowed establishing a representative baseline encompassing the major actors (tides, wind, waves) responsible for variabilities in SPM concentration and fluid mud thickness, as well as human activities such as ship maneuvering and dredging/disposal works. 2 The study site The harbor of Zeebrugge is situated in the Southern Bight of the North Sea at the marine limit of influence of the Westerscheldt estuary (see Fig. 1). The relatively wellprotected Southern Bight is mainly tidally dominated as compared with other shallow areas in the North Sea where wave influences are more pronounced (Fettweis et al. 2012b). The tides are semidiurnal and the mean tidal amplitude is about 3.6 m. The nearshore tidal current ellipses are elongated and vary on average between 0.2 and 0.8 m/s during spring tide and 0.2 and 0.5 m/s during neap tide at 2 m above the bed. The strong tidal currents and the low freshwater discharges result in a well-mixed water column. Slack water occurs around 3 h before and 3 h after high water (HW). Ebb (about 3 h after HW until about 3 h before HW) is directed towards the southwest (SW) and flood towards the northeast (NE). Maximum currents occur during flood around 1 h before HW; the peak currents during ebb are slightly lower and occur around LW. Southwesterly winds dominate the overall wind climate, followed by winds from the NE sector. Maximum wind speeds coincide with southwesterly winds; nevertheless, the highest waves are generated under northwesterly winds, due to a longer fetch. The waves have generally a period of about 4 s, lower frequency swell waves with a period of about 6 s are less abundant. The median significant wave height is 0.6 m
 showing the measurement stations outside (MOW1; WZ buoy) and inside the port of Zeebrugge (Hermespier, LNG, Albert II dock (AII dock), and and")
72 Author's personal copy Ocean Dynamics (2016) 66: Fig. 1 Map of the Belgian coastal area (southern North Sea) showing the measurement stations outside (MOW1; WZ buoy) and inside the port of Zeebrugge (Hermespier, LNG, Albert II dock (AII dock), and and the P90 percentile 1.2 m. The salinity is generally between 28 and 34, and changes in salinity are caused by the advection of marine and Scheldt water masses (Arndt et al. 2011; Fettweis and Baeye 2015). The residual alongshore currents at MOW1 (WZ buoy) (see the location of these stations in Fig. 1) are in 80 % (64 %) of the time directed towards the SW (i.e., in ebb direction) and salinity is then around 30. During the prevailing SW wind, salinity may increase up to 34 and marine water with generally lower SPM concentration enters the area; the residual alongshore current is then directed towards the NE. SW-NE direction corresponds with the alignment of the coastline. The harbor is situated in a coastal turbidity maximum area with SPM concentrations between 0.02 and more than 0.1 g/l at the surface and between 0.1 and more than 3 g/l near the bed; lower values (<0.01 g/l) occur offshore (Baeye et al. 2011; Fettweis et al. 2012b). The SPM concentration, floc size, and settling velocity have a distinct seasonal signal (Fettweis and Baeye 2015). An acoustic detection method using ADV and ADP altimetry revealed bed boundary level changes of up to 0.2 m in the nearshore area during tidal and spring-neap cycles, suggesting the occurrence of lutoclines Sterneneiland), the regular disposal site ZBO and the disposal site ZBW used during the field experiment. The background consists of bathymetry and of the dredging and disposal intensity during 2013 and possibly of fluid mud layers (Baeye et al. 2012). The occurrence of brownish-colored fluffy layers on top of consolidated black and anoxic mud deposits of Holocene age, intercalated with thin sandy layers, have frequently been observed in Van Veen grab and box core samples taken in the vicinity of the harbor. The outer port of Zeebrugge is reclaimed from the sea and is protected from it by two breakwaters, each about 4 km in length (Vanlede and Dujardin 2014). The harbor mouth is in open connection to the sea. The open water surface is m 2, which gives a tidal volume of m 3. The cross-sectional surface between the harbor and sea is about 12,000 m 2. The sediment exchange between the harbor and the sea is caused mainly by horizontal and to a lesser extent vertical exchange at the harbor mouth (Vanlede and Dujardin 2014). Most horizontal sediment exchange occurs from 2 h before high water to high water. Around that time, the flood flow in the North Sea (directed northeastward along the Belgian coast) drives a primary gyre in the harbor. The high SPM concentrations result in an average siltation rate of tons dry matter (TDM) per year, which is dredged and disposed on the authorized disposal site ZBO (Fig. 1)
73 Author's personal copy 1500 Ocean Dynamics (2016) 66: (Lauwaert et al. 2009). Because of the high sediment retention in the harbor, the sediment concentration in the outflowing water is lower than that in the inflowing water. 3 Methodology The field study lasted for 1 year (between January 2013 and March 2014) and consisted of 11-month disposing of the dredged material on the existing disposal site ZBO, which induces recirculation of the disposed material back to the dredging sites and of a 1-month period (further called field experiment) with disposal on an alternative site (ZBW) with more limited recirculation (see Fig. 1). The fine-grained dredged sediments (D 50 < 10 μm) from the harbor of Zeebrugge consist of % clays, % quartz, % carbonates, and 1 7 % organic material (Adriaens 2015). In total, about TDM have been dredged and disposed during the period March 2013 March During the 1-month field experiment, 0.41 million TDM (14 % of the yearly amount) were disposed on the ZBW site. The disposal on site ZBW occurred between 21 October 2013 and 20 November The 11-month period of disposal on site ZBO (further called disposal as usual) was situated between February 2013 and March Besides the monitoring station MOW1, where data are available since 2005 (Fettweis and Baeye 2015), a second station (WZ buoy) outside the harbor and four inside the harbor were installed during the field study. 3.1 Monitoring stations for SPM concentration outside and inside the port Current velocity, salinity, SPM concentration, and altimetry were collected with tripods at MOW1, located about 5 km offshore, and at WZ buoy located at about 2 km from the harbor entrance (Fig. 1). Both measuring stations are situated in the influence zone from dispersion of dredged material disposal at ZBO (Van den Eynde and Fettweis 2006). The instrumentation suite consisted of a point velocimeter (5 MHz ADVOcean velocimeter), a downward looking ADP profiler (MOW1, 3 MHz SonTek Acoustic Doppler Profiler; WZ buoy, 2 MHz Aquadopp current profiler), two D&A optical backscatter point sensors (OBS3+), a Sequoia LISST-100X, and a Sea-bird SBE37 CT. The data were collected in bursts every 10 or 15 min for the OBS, LISST, and ADV, while the ADP was set to record a profile every 1 min; later on, averaging was performed to a 15-min interval to match the sampling interval of the other sensors. The OBSs were mounted at 0.2 and 2 m above bed (mab). The tripods were moored between 3 and 6 weeks and then replaced with similar tripod systems to ensure continuous time series. Inside the port current velocity, salinity and SPM concentration were measured at four locations (Sterneneiland, Albert II dock, LNG and Hermespier, see Fig. 1) at two points in the water column, respectively about 2 m below MLLWS and about 2 mab. The instrumentation suite consisted of a point velocimeter (Aquadopp), an OBS3+, and a CT probe (Valeport 620). At Hermespier,the instrumentation was mounted on a fixed cable, attached to the gangway of the pier and a concrete anchor at the bottom. The other three measuring locations were equipped with two concrete anchors connected by a 50-m steel cable; the measurement devices were attached to the first, 300 kg anchor, a localization buoy to the second, 1000 kg anchor. The instruments were kept at the desired depth by an underwater buoy, positioned just below MLLWS, and a second flotation buoy at the water surface. The data were collected every 10 min (average value of 60 s bursts). To reduce data gaps to a minimum, the measurement devices were retrieved and cleaned every 3 weeks. After some functionality checks, the measuring suite was then lowered again. 3.2 Top sediment layer outside and inside the port Recently, applications in fine-grained sediment environments have been documented where the ADV altimeter was used to elucidate the high concentrated mud suspension (HCMS) or fluid mud layer dynamics (see Baeye et al. (2011)). The acoustic signal of the ADV records the distance between the measuring volume and the sea floor at both stations outside the port. This distance varies as a function of settling of the tripod, variation in bathymetry (erosion/deposition) and the presence of lutoclines or sharp gradients in the SPM concentration that act as reflector for the acoustic signal. The variation in altimetry can thus be used as a proxy for the dynamics of HCMS or fluid mud layer. The thickness of the top mud layer inside the harbor was measured with a dual-frequency echo sounder on a regular basis. Besides the two weekly measurements along the central axis of the outer harbor (leading lights line in Fig. 1), a daily survey of the axis of the Albert II dock (axis Albert II in Fig. 1) was conducted during the field study. The 210-kHz reflector is considered to be the top of the mud layer, while the 33-kHz reflector is interpreted to be the hard sandy bottom. 3.3 SPM concentration from optic and acoustic sensors The SPM concentration was derived from optical (OBS and LISST) and acoustical instruments (ADP). The OBS voltage readings were converted into NTU using Amco clear and then into SPM mass concentration (g/l) by calibration against filtered water samples collected during one (WZ buoy, inside the harbor points) and four tidal cycles (MOW1). A linear regression was used to fit a straight line between the OBS signal (in
74 Author's personal copy Ocean Dynamics (2016) 66: NTU) and the filtered SPM concentration (g/l; see Fig. 2). The stability of the OBS was further controlled by calibrating them against Amco clear solution before and after the field study. The measuring range was set to 1.5 or 3 g/l depending on the sensor. During high-energy conditions, near-bed SPM concentrations at MOW1 and WZ buoy were regularly higher than 1.5 or 3 g/l. Under these circumstances, the OBS saturated and underestimated the actual SPM concentration. The OBS at 0.2 mab was in saturated state during about 2.3 % of the time at MOW1 and 3.2 % of the time at WZ buoy. Although this represents a relatively short period of time, it may significantly affect the mean SPM concentration, e.g., an underestimation of the peak SPM concentration during saturation by 2 g/l results in an underestimation of the mean SPM concentration in summer by 60 mg/l and in winter by 30 mg/l (Fettweis and Baeye 2015). The LISST 100X uses laser diffraction technology to measure particle size and volume concentration in 32 logarithmically spaced size groups over the range of mm (Agrawal and Pottsmith 2000). The volume concentration of each size group is estimated with an empirical volume calibration constant, which is obtained under a presumed sphericity of particles. The total SPM volume concentration (units: ml/l) is the sum of the 32 volume concentrations per size class and has been used in the study. As cohesive sediments occur as flocs in suspension, the SPM volume concentration is not equal to the SPM mass concentration. The uncertainty of the instrument is related to the characteristics of the particles occurring in nature (particles smaller and larger than the size range; non-spherical particles), which affects the estimated size and volume distribution (Mikkelsen et al. 2006; Andrews et al. 2010). The ADP profilers at both locations were attached at 2.3 mab and down-looking, measuring current and acoustic intensity profiles with a bin resolution of 0.25 m starting at 1.8 mab. The backscattered acoustic signal strength, from ADP, was used to estimate SPM concentrations. After conversion to decibels, the signal strength was corrected for geometric spreading and water and sediment attenuation (Thorne and Hanes 2002). The upper OBS-derived SPM concentration estimates were used to calibrate the ADP s first bin. The different sensitivity of acoustic and optic sensors to changes in the SPM particle size and characteristic is reflected in the correlation coefficient between the ADP backscatter (db) and the OBS-derived SPM concentration of R 2 = The R 2 is better for the lower SPM concentrations and the regression model thus accounts for less variance for the higher SPM concentrations. 3.4 Data classification, ensemble averaging The number of data at WZ buoy comprises 254 (OBS), 310 (Aquadopp), and 320 LISST tidal cycles, and at MOW1, about 1390 (LISST) and 2430 (ADP, OBS) tidal cycles were collected during different seasonal, tidal, and meteorological conditions. To every tidal cycle classification, parameters were assigned that take into account seasons, tidal range, alongshore current, and the significant wave height. Each tidal cycle starts at high water (HW) and finishes at the following HWand was resampled to obtain 50 data points per cycle (i.e., every 15 min). The tidal cycles of each class were then ensemble averaged, and the standard error was calculated. The standard error estimates how far the sample mean is likely to be from the population mean and will decrease with increasing sample size. The tidal range was calculated from the harmonic tidal signal and then grouped according to the P66 (3.95 m) and P33 (3.31 m) percentiles into a spring tide (SP; >P66), mean tide (MT; P66-P33), and neap tide (NT; <P33). The influence of weather systems on SPM concentration was investigated by grouping the tidal cycles according to the residual alongshore Fig. 2 Calibration of OBS output (NTU) versus filtered water samples (MOW1) during four tidal cycles (one in January and April and two in November). The errorbars indicate the standard deviation of three replica filtrations (y-axis) and 30 s of OBS measurements prior to the closure of the Niskin bottles (x-axis)
 was calculated using the ADP current velocity data at 2 mab.")
75 Author's personal copy 1502 Ocean Dynamics (2016) 66: flow and the significant wave height. For each tidal cycle, the residual alongshore flow (U a ) was calculated using the ADP current velocity data at 2 mab. Subsequently, the tidal cycles were classified in terms of the direction and strength of this residual alongshore current into a SW-ward directed (U a < 0.09 m/s) and a NE-ward directed (U a > 0 m/s); SW- NE direction corresponds with the alignment of the coastline. The P50 percentile of residual alongshore currents is U a = 0.06 m/s; a U a < 0.09 m/s corresponds with the P33 percentile and a U a > 0 m/s with the P80 percentile of all values. The influence of wave systems was looked at by grouping the data into tidal cycles with significant wave heights (H s ) < 0.60 m (<P50) and H s > 1.2 m (>P90). 4 Results 4.1 SPM concentration outside and inside the port The 2013 time series at MOW1 and WZ buoy of SPM concentration derived from OBS, LISST, and ADP and some additional parameters (H s, U a, salinity, and altimetry) are shown in Figs. 3 and 4. Less data are available at the WZ buoy location due to frequent failure of the instrumentation and collision of ships with the frame. The influence of neapspring cycle is more pronounced in the SPM concentration derived from the ADP than the OBS. At 2 mab, the peak in the low-passed filtered SPM concentration from both the ADP Fig. 3 MOW1 location, 1 January December 2013 time series of tidal amplitude, significant wave height (H s ) and mean wave period (T m ), alongshore currents (U a ), residual alongshore currents (positive is towards the NE, negative towards the SW), and salinity; SPM mass and volume concentration at 2 and 0.2 mab (SPMC) for ADP and OBS, and altimetry (decrease: erosion, increase: accretion). Red lines indicate the start/end of a tripod deployment

76 Author's personal copy Ocean Dynamics (2016) 66: Fig. 4 Same as Fig. 3, but for WZ buoy and the OBS corresponds generally well with the peak in tidal amplitude, which is not the case closer to the bed where the SPM concentration is more influenced by near-bed SPM dynamics, such as wave induced resuspension, or formation of HCMS. The quality of the correlation of low-pass filtered OBS-derived SPM concentrations with tidal amplitude is low for several periods at MOW1. This is the case around days 33, 45, 60, 72, 293, and 312, which have a lower lowpassed filtered SPM concentration than expected from tidal amplitude. This can be explained by the direction of the residual alongshore currents, by an apparent low SPM concentration due to the fact that waves disturbed the signal, by saturation of the OBS at 0.2 mab, and by possible changes in sediment composition or the formation of fluid mud layers and a reduction of the vertical mixing. The effect of tidal amplitude, seasons, waves and residual alongshore current on the OBS-derived SPM concentration during a tide at MOW1 is shown in Fig. 5 and Table 1. The tidal ensembles indicate that the mean SPM concentration at 0.2 mab during summer (winter) is about 13 % lower (higher) than the mean SPM concentration during the whole year. The seasonal difference is more pronounced at 2 mab where the difference with the mean during the whole year is ±25 %. The tidal-averaged SPM concentration at 0.2 and 2 mab during winter spring (neap) tide increases (decreases) by about 25 % with respect to the tidal-averaged SPM concentration during all tides in winter. During a NE-ward-directed residual alongshore current (P10) in winter, the tidal-averaged SPM concentration decreases by 20 % at 0.2 mab and 13 % at 2 mab, with respect to the tidal-averaged SPM concentration
77 personal copy 1504 Ocean Dynamics (2016) 66: Fig. 5 MOW1 ( ), ensemble-averaged OBS-derived SPM concentration at 2 and 0.2 mab during a tidal cycle as a function of season, tidal amplitude, direction of the residual alongshore current, and significant wave heights. The data grouped according to tidal amplitude, residual alongshore current, and significant wave heights are for winter period. The error bars are the standard errors. Slack water occurs around 4 to 3 h before and 3 h after LW in winter. During SW-ward-directed residual alongshore current (P90), the values are almost equal to the tidal-averaged SPM concentration in winter. Low (high) wave conditions result in a decrease (increase) of the tidal-averaged SPM concentration by 9 % (16 %) at 0.2 mab and by 8 % (11 %) at 2 mab. The results show that high waves and negative residual alongshore flow direction induce the highest variations near the bed (0.2 mab), whereas seasonal effects are more pronounced higher up in the water column. The effect of tidal Table 1 Geometric mean and multiplicative standard deviation (multiplied divided: */) of the OBS-derived SPM concentration (mg/l) at MOW1 ( ) during different tidal ranges (neap tide, spring tide), residual alongshore current directions (SW-ward, NE-ward: P10 and P90 of all values) and significant wave height. The results of tidal range, residual alongshore current, and significant wave heights are for winter period 0.2 mab 2 mab All tide 332*/ */1.41 Summer 288*/ */1.57 Winter 374*/ */1.31 Neap tide 268/ */1.22 Spring tide 460*/ */1.38 SW-ward 361*/ */1.39 NE-ward 303*/ */1.27 H s < 0.6 m 341*/ */1.40 H s > 1.2 m 432*/ */1.19 range is similar near the bed and in the water column. The results indicate that SPM concentration is mainly tidally dominated, but the occurrence of storms will impact the shallow regions through resuspension and by advection. Figure 5 shows the effect of one parameter separately and gives a result that incorporates the average for the other parameters. The relatively low effect of high waves is thus hidden in the average over all tidal ranges. If we look at high wave condition during several tidal ranges, then the effects are more pronounced, i.e., strong increases of the SPM concentration near the bed during both neap and spring tidal condition and a decrease of wave effects at 2 mab, which is more pronounced during neap than spring tide. The effect of waves on different residual alongshore regimes is similar. Near the bed, the effects of alongshore residual current, as described above, is overprinted by the wave effects, in contrast with the situation at 2 mab, where the effect of residual alongshore current direction is more dominant than waves effect. The SPM concentration time series inside the port are shown in Fig. 6. Data gaps are mainly caused by insufficient power supply and fouling. All stations show higher SPM concentration in the lower measurement point, except for Hermespier, where the difference in median value is not significant (Table 2). SPM concentrations are higher in winter ( October March) compared with summer ( April September), except for location Sterneneiland. This is probably caused by some exceptionally deep moorings during summer, leading to approximately the same depth for the upper

78 Author's personal copy Ocean Dynamics (2016) 66: Fig. 6 1st March th April 2014 time series of SPM concentration at two levels and in the four locations inside the harbor. Red lines indicate the start/end of a deployment measurement point as the lower measurement point in winter. Sterneneiland and Albert II dock show significantly higher SPM concentrations during spring tide than during neap tide, in contrast to LNG and Hermespier (Table 2). The SPM concentrations at the two locations closest to the harbor mouth Table 2 Median and its 95 % confidence interval of SPM concentrations (mg/l) inside the harbor: seasonal and tidal variations (spring tide neap tide) Summer (Sterneiland and Albert II dock) show a clear correlation with the tide, with highest SPM concentrations around high water (Fig. 7), indicating the period of inflow of sea water with high SPM concentration towards the harbor. At LNG this correlation is less pronounced and for location Hermespier there is no Winter Neap tide Lower Upper Spring tide Upper Lower Upper Lower Upper Lower Sterneneiland 66 ± 6 81 ± 6 73 ± 4 88 ± 5 66 ± 4 71 ± 4 93 ± ± 8 AII dock 54 ± 4 86 ± 8 73 ± ± ± 4 LNG Hermespier 38 ± 6 54 ± 5 50 ± 3 61 ± 5 43 ± 2 68 ± 5 71 ± 4 86 ± ± 4 60 ± ± ± ± ± 5 68 ± ± 8 62 ± 6 56 ± 4 67 ± 7

79 Fig. 7 Albert II dock, ensembleaveraged OBS-derived SPM concentration at 2 m below water surface during a tidal cycle in winter (upper) and summer (lower) as a function of tidal range. The error bars are the standard errors. Slack water outside the harbor occurs around 4 to 3 h before and 3 h after LW Author's personal copy 1506 Ocean Dynamics (2016) 66: significant difference between high water and low water SPM concentrations. The SPM concentration in all locations inside the harbor correlates highly with the current velocity. Whilst the measurements outside the harbor show a peak around maximum ebb and flood flow, only the flood peak is observed in the harbor. The peak in SPM concentration during maximum flood velocity is simultaneously outside the harbor and at location Stern. 4.2 Fluid mud outside/inside the port The 2013 time series at MOW1 and WZ buoy of the 5-MHz altimetry signal of the ADV are shown in Figs. 3 and 4. The seafloor varied between 14.8 and 17.4 cm (MOW1) and 9.2 and 17.4 cm (WZ buoy) and shows low- and high-frequent variations. In general, the low-frequent variations in altimetry are more pronounced during strong variations in residual alongshore current associated with storms. The high frequent variations are often associated with the formation and resuspension of HCMS at slack water; these variations reach up to about cm. The ensemble-averaged altimetry (Fig. 8) shows an increase around slack water at both locations. At MOW1, the accretion is more pronounced around the slack water after HW than that after LW. The resuspension of this material results in a peak in SPM concentration during ebb that is higher than during flood (Fig. 5). At the WZ buoy, the variations in altimetry are less pronounced and the seafloor thus more stable. Inside the port, a mud layer up to 3.5 m thick exists, whereas at the harbor entrance ( m in Fig. 9), the thickness of the mud layer is about 0.5 to 2 m. Maximum thickness is located around the entrance of the Albert II dock; deeper in the harbor the thickness of the mud layer again decreases. However, Fig. 9 also shows that the variation of the 210 khz altimetry is largest at the entrance and deeper in the harbor. For the whole period of the field study, the variation in Fig. 8 Ensemble-averaged ADV altimetry signal outside the port. The altimetry is indicated with respect to the mean altimetry. The error bars are the standard errors. Slack water occurs between 4 and 3 h before and 3 h after LW. The variations in altimetry are a proxy for the HCMS or fluid mud dynamics
 in m relative to Lowest Astronomical Tide (LAT) during the period March 2013 March 2014.")
 Author's personal copy Ocean Dynamics (2016) 66:1497 1516 1507 volume between the 210- and 33-kHz reflector has been calculated, based on both transects (leading light line and axis Albert II dock).")
80 Fig. 9 Depth of the top of the mud layer (blue, mean height, standard deviation, and extremes of the 210-kHz reflector) and the Bhard^ sandy bottom (black, mean height, standard deviation, and extremes of the 33-kHz reflector) in m relative to Lowest Astronomical Tide (LAT) during the period March 2013 March The data are from the central part of the harbor along the leading light line (from outside towards inside, see Fig. 1.) Author's personal copy Ocean Dynamics (2016) 66: volume between the 210- and 33-kHz reflector has been calculated, based on both transects (leading light line and axis Albert II dock). In order to obtain a natural variability of the mud volume, the observed volume changes were corrected for the dredging works conducted during the period between two consecutive soundings (see Fig. 10). In winter, the mud volume is the largest; during spring and summer, the volume gradually decreases to reach a minimum at the beginning of autumn. This confirms what already was shown in Fig. 9 namely that the dome shape of the mud layer along the leading light line (Fig. 1) is more or less constant in time but moves up and down as a whole. Some differences in mud volume variation exist within the harbor, but all locations confirm that the thickness of the mud layer is higher in winter than in summer. Figure 10 confirms generally that the increase of the mud volume is higher during spring tide than during neap tide, since more sediment is imported into the harbor. However, other variations (seasonal, storms) partially mask this neapspring signal so that no statistical confirmation exist that the mud volume during or just after spring tide is higher than during neap tide. 4.3 SPM concentration during the field experiment In order to take spring-neap cycles, seasonality and meteorology as much as possible into account, the evaluation of the field experiment was based on a 15-day period prior to the field experiment (T0: October 2013), a 15-day period Fig. 10 Natural evolution of the mud volume in the central part of the harbor and in the Albert II dock. The volume changes are calculated from two weekly transects along the leading light line (see Fig. 1) and from daily transects along the axis of the Albert II dock and have been corrected for the dredging works conducted during the period between two consecutive soundings
KONINKLIJK BELGISCH INSTITUUT VOOR NATUURWETENSCHAPPEN OD NATUUR - BEHEERSEENHEID VAN HET MATEMATISCH MODEL
 KONINKLIJK BELGISCH INSTITUUT VOOR NATUURWETENSCHAPPEN OD NATUUR - BEHEERSEENHEID VAN HET MATEMATISCH MODEL MOnitoring en MOdellering van het cohesieve sedimenttransport en evaluatie van de effecten op
Milieu-effectenbeoordeling van het project ingediend door de AG Haven Oostende.
 KONINKLIJK BELGISCH INSTITUUT VOOR NATUURWETENSCHAPPEN BEHEERSEENHEID MATHEMATISCH MODEL VAN DE NOORDZEE AFDELING BEHEER VAN HET MARIENE ECOSYSTEEM Milieu-effectenbeoordeling van het project ingediend
KONINKLIJK BELGISCH INSTITUUT VOOR NATUURWETENSCHAPPEN OD NATUUR BEHEERSEENHEID VAN HET MATEMATISCH MODEL
 KONINKLIJK BELGISCH INSTITUUT VOOR NATUURWETENSCHAPPEN OD NATUUR BEHEERSEENHEID VAN HET MATEMATISCH MODEL MOnitoring en MOdellering van het cohesieve sedimenttransport en evaluatie van de effecten op het
Activiteitsrapport (1 juli december 2013)
") KONINKLIJK BELGISCH INSTITUUT VOOR NATUURWETENSCHAPPEN OD NATUURLIJK MILIEU BEHEERSEENHEID VAN HET MATEMATISCH MODEL MOnitoring en MOdellering van het cohesieve sedimenttransport en evaluatie van de effecten
KONINKLIJK BELGISCH INSTITUUT VOOR NATUURWETENSCHAPPEN OD NATUURLIJK MILIEU BEHEERSEENHEID VAN HET MATEMATISCH MODEL MOnitoring en MOdellering van het cohesieve sedimenttransport en evaluatie van de effecten
KONINKLIJK BELGISCH INSTITUUT VOOR NATUURWETENSCHAPPEN OD NATUUR BEHEERSEENHEID VAN HET MATEMATISCH MODEL
 KONINKLIJK BELGISCH INSTITUUT VOOR NATUURWETENSCHAPPEN OD NATUUR BEHEERSEENHEID VAN HET MATEMATISCH MODEL MOnitoring en MOdellering van het cohesieve sedimenttransport en evaluatie van de effecten op het
Modellenstudie van de ontwikkeling van de zandbank te Heist
 De Zandbank te Heist, een boeiend fenomeen Seminarie Vrijdag Modellenstudie van de ontwikkeling van de zandbank te Heist Dries Van den Eynde, Frederic Francken & Brigitte Lauwaert Beheerseenheid van het
Activiteitsrapport (1 januari 2013 30 juni 2013)
") KONINKLIJK BELGISCH INSTITUUT VOOR NATUURWETENSCHAPPEN OD NATUURLIJK MILIEU BEHEERSEENHEID VAN HET MATEMATISCH MODEL MOnitoring en MOdellering van het cohesieve sedimenttransport en evaluatie van de effecten
KONINKLIJK BELGISCH INSTITUUT VOOR NATUURWETENSCHAPPEN OD NATUURLIJK MILIEU BEHEERSEENHEID VAN HET MATEMATISCH MODEL MOnitoring en MOdellering van het cohesieve sedimenttransport en evaluatie van de effecten
J Day
 BEHEERSEENHEID VAN HET MATHEMATISCH MODEL VAN DE NOORDZEE SUMO GROEP MOnitoring en MOdellering van het cohesieve sedimenttransport en evaluatie van de effecten op het mariene ecosysteem ten gevolge van
Activiteitsrapport 3 (1 juli december 2009)
") BEHEERSEENHEID VAN HET MATHEMATISCH MODEL VAN DE NOORDZEE SUMO GROEP MOnitoring en MOdellering van het cohesieve sedimenttransport en evaluatie van de effecten op het mariene ecosysteem ten gevolge van
BEHEERSEENHEID VAN HET MATHEMATISCH MODEL VAN DE NOORDZEE SUMO GROEP MOnitoring en MOdellering van het cohesieve sedimenttransport en evaluatie van de effecten op het mariene ecosysteem ten gevolge van
Michael Fettweis, Bouchra Nechad, Dries Van den Eynde, Frederic Francken, Vera Van Lancker
 BEHEERSEENHEID VAN HET MATHEMATISCH MODEL VAN DE NOORDZEE SUMO GROEP MOnitoring en MOdellering van het cohesieve sedimenttransport en evaluatie van de effecten op het mariene ecosysteem ten gevolge van
Workshop aanslibbing DGD 15 juni 2010 Voorkomen van HCBS lagen
 Workshop aanslibbing DGD 15 juni 2010 Voorkomen van HCBS lagen Marc Sas, Bas Van Maren, Mark Bollen Inhoud 1. Doel van de studie 2. Metingen inzake HCBS ADCP en SiltProfiler IMDC-frame : Argus, Altus,
Vooruitgangsrapport (juni 2014) over de effecten op het mariene milieu van baggerspeciestortingen (Vergunningsperiode 01/01/ /12/2016)
 over de effecten op het mariene milieu van baggerspeciestortingen (Vergunningsperiode 01/01/ /12/2016)") Vooruitgangsrapport (juni 2014) over de effecten op het mariene milieu van baggerspeciestortingen (Vergunningsperiode 01/01/2012 31/12/2016) Brigitte Lauwaert 1, Michael Fettweis 1, Bavo De Witte 2, Lisa
Vooruitgangsrapport (juni 2014) over de effecten op het mariene milieu van baggerspeciestortingen (Vergunningsperiode 01/01/2012 31/12/2016) Brigitte Lauwaert 1, Michael Fettweis 1, Bavo De Witte 2, Lisa
Activiteitsrapport 4 (1 october maart 2008)
") BEHEERSEENHEID VAN HET MATHEMATISCH MODEL VAN DE NOORDZEE SUMO GROEP MOnitoring en MOdellering van het cohesieve sedimenttransport en evaluatie van de effecten op het mariene ecosysteem ten gevolge van
BEHEERSEENHEID VAN HET MATHEMATISCH MODEL VAN DE NOORDZEE SUMO GROEP MOnitoring en MOdellering van het cohesieve sedimenttransport en evaluatie van de effecten op het mariene ecosysteem ten gevolge van
Activiteitsrapport (1 januari 2011 30 juni 2011) BEHEERSEENHEID VAN HET MATHEMATISCH MODEL VAN DE NOORDZEE SUMO GROEP
 BEHEERSEENHEID VAN HET MATHEMATISCH MODEL VAN DE NOORDZEE SUMO GROEP") BEHEERSEENHEID VAN HET MATHEMATISCH MODEL VAN DE NOORDZEE SUMO GROEP MOnitoring en MOdellering van het cohesieve sedimenttransport en evaluatie van de effecten op het mariene ecosysteem ten gevolge van
BEHEERSEENHEID VAN HET MATHEMATISCH MODEL VAN DE NOORDZEE SUMO GROEP MOnitoring en MOdellering van het cohesieve sedimenttransport en evaluatie van de effecten op het mariene ecosysteem ten gevolge van
Ecologische Monitoring Kustverdedigingsproject Oostende. (t 0 -situatie, fase 3) AANVULLENDE STUDIE:
 AANVULLENDE STUDIE:") Ecologische Monitoring Kustverdedigingsproject Oostende (t 0 -situatie, fase 3) AANVULLENDE STUDIE: KWANTIFICERING EN KWALIFICERING VAN ORGANISCH MATERIAAL IN MARIENE SEDIMENTEN: HUN ONDERLINGE RELATIES
Ecologische Monitoring Kustverdedigingsproject Oostende (t 0 -situatie, fase 3) AANVULLENDE STUDIE: KWANTIFICERING EN KWALIFICERING VAN ORGANISCH MATERIAAL IN MARIENE SEDIMENTEN: HUN ONDERLINGE RELATIES
Activiteitsrapport 1 (1 april december 2008) Michael Fettweis, Dries Van den Eynde en Federico Maggi
 Michael Fettweis, Dries Van den Eynde en Federico Maggi") BEHEERSEENHEID VAN HET MATHEMATISCH MODEL VAN DE NOORDZEE SUMO GROEP MOnitoring en MOdellering van het cohesieve sedimenttransport en evaluatie van de effecten op het mariene ecosysteem ten gevolge van
BEHEERSEENHEID VAN HET MATHEMATISCH MODEL VAN DE NOORDZEE SUMO GROEP MOnitoring en MOdellering van het cohesieve sedimenttransport en evaluatie van de effecten op het mariene ecosysteem ten gevolge van
Sediment en morfodynamiek Belgische kustzone
 Sediment en morfodynamiek Belgische kustzone Strategic Research Network 2007-2011 Management Unit of the North Sea Mathematical Models MUMM BMM UGMM Vera Van Lancker Fijn materiaal in de waterkolom
Bepaling primaire impacten van klimaatsveranderingen
 Bepaling primaire impacten van klimaatsveranderingen Dries Van den Eynde, José Ozer, Stephanie Ponsar Beheerseenheid Mathematisch Model Noordzee Koninklijk Belgisch Instituut voor Natuurwetenschappen Gulledelle
Bepaling van de primaire impacten van globale klimaatsveranderingen
 Bepaling van de primaire impacten van globale klimaatsveranderingen Dries Van den Eynde, Stéphanie Ponsar, José Ozer & Fritz Francken Beheerseenheid Mathematisch Model Noordzee Gulledelle 100, B-1200 Brussel
Activiteitsrapport (1 juli december 2012) BEHEERSEENHEID VAN HET MATHEMATISCH MODEL VAN DE NOORDZEE SUMO GROEP
 BEHEERSEENHEID VAN HET MATHEMATISCH MODEL VAN DE NOORDZEE SUMO GROEP") BEHEERSEEHEID VA HET MATHEMATISCH MODEL VA DE OORDZEE SUMO GROE MOnitoring en MOdellering van het cohesieve sedimenttransport en evaluatie van de effecten op het mariene ecosysteem ten gevolge van bagger
BEHEERSEEHEID VA HET MATHEMATISCH MODEL VA DE OORDZEE SUMO GROE MOnitoring en MOdellering van het cohesieve sedimenttransport en evaluatie van de effecten op het mariene ecosysteem ten gevolge van bagger
Voortgangsrapport Effecten baggerlossingen periode 1 januari - 30 juni 2016
 Hans Hillewaert ILVO ILVO Mededeling 220 september 2016 VOORTGANGSRAPPORT EFFECTEN BAGGERLOSSINGEN periode 1 januari - 30 juni 2016 ILVO Instituut voor landbouwen visserijonderzoek www.ilvo.vlaanderen.be
Status van habitatkartering in België Transnationale samenwerking
 Belgian Science Policy Status van habitatkartering in België Transnationale samenwerking Vera Van Lancker Els Verfaillie, Kristien Schelfaut, Isabelle Du Four Universiteit Gent, Renard Centre of Marine
ILVO Mededeling 240 VOORTGANGSRAPPORT EFFECTEN BAGGERLOSSINGEN. ILVO Instituut voor Landbouw-, Visserij- en Voedingsonderzoek.
 Hans Hillewaert ILVO ILVO Mededeling 240 december 2017 VOORTGANGSRAPPORT EFFECTEN BAGGERLOSSINGEN periode 1 juli 31 december 2017 ILVO Instituut voor Landbouw-, Visserij- en Voedingsonderzoek www.ilvo.vlaanderen.be
Suspensietransport in de waterloop
 Suspensietransport in de waterloop Wat willen we weten? Elin Vanlierde Universiteit Gent Vakgroep Geologie en Bodemkunde Sedimentaire Geologie en Ingenieursgeologie Wat willen we weten? Doelstellingen
Voortgangsrapport. ILVO MEDEDELING nr 136. periode 1 januari juni juli 2013
 Voortgangsrapport Effecten Baggerlossingen periode 1 januari 2013 30 juni 2013 ILVO MEDEDELING nr 136 Hans Hillewaert - ILVO juli 2013 Bavo De Witte Gert Van Hoey Lisa Devriese Kris Hostens Johan Robbens
Primaire Productie in de Waddenzee
 Workshop Onderzoek Mosselkweek Natuurbeheer 19 februari 2009 Primaire Productie in de Waddenzee ZKO-Draagkracht IN PLACE onderzoeksproject Katja Philippart Koninklijk Nederlands Instituut voor Zeeonderzoek
HET BEZINKEN VAN SLIBVLOKKEN IN HET DOLLARD ESTUARIUM
 HET BEZINKEN VAN SLIBVLOKKEN IN HET DOLLARD ESTUARIUM SAMENVATTING Hoofdstuk 1 Inleiding en literatuuronderzoek. Morfologische veranderingen van getijgeulen en getijplaten hangen af van erosie, transport
Beheerseenheid van het Mathematisch Model van de Noordzee RV BELGICA
 Beheerseenheid van het Mathematisch Model van de Noordzee Meetdienst Oostende RV BELGICA Rapport van de RV Belgica Meetcampagnes en Verankering van Meetsystemen MOMO 29 Project MOnitoring en MOdellering
VERGELIJKENDE STUDIE VAN ALTERNATIEVE ONTWERPWAARDE SCHATTINGEN VAN SIGNIFICANTE GOLFHOOGTE
 Rapport aan isterie van de Vlaamse Gemeenschap Departement Leefmilieu en Infrastructuur Administratie Waterwegen en Zeewezen AFDELING WATERWEGEN KUST VERGELIJKENDE STUDIE VAN ALTERNATIEVE ONTWERPWAARDE
Ontwikkeling en Toepassing slibmodel
 Lange Termijn Visie: Onderzoek en Monitoring Onderzoeksluik: Toegankelijkheid Ontwikkeling en Toepassing slibmodel Joris Vanlede, Thijs van Kessel Waterbouwkundig Laboratorium en Deltares Studiedag Lange
Memo. Inleiding. Opzet berekeningen
 Memo Aan Bart Grasmeijer Van Thijs van Kessel Aantal pagina's 7 Doorkiesnummer +31 (0)88 33 58 239 E-mail thijs.vankessel @deltares.nl Onderwerp notitie specieverspreiding Eemshaven Inleiding Deze beknopte
Activiteitsrapport 2 (1 januari juni 2009) Michael Fettweis, Dries Van den Eynde, Frederic Francken, Vera Van Lancker
 Michael Fettweis, Dries Van den Eynde, Frederic Francken, Vera Van Lancker") BEHEERSEENHEID VAN HET MATHEMATISCH MODEL VAN DE NOORDZEE SUMO GROEP MOnitoring en MOdellering van het cohesieve sedimenttransport en evaluatie van de effecten op het mariene ecosysteem ten gevolge van
BEHEERSEENHEID VAN HET MATHEMATISCH MODEL VAN DE NOORDZEE SUMO GROEP MOnitoring en MOdellering van het cohesieve sedimenttransport en evaluatie van de effecten op het mariene ecosysteem ten gevolge van
Conclusies. Martijn de Ruyter de Wildt en Henk Eskes. KNMI, afdeling Chemie en Klimaat Telefoon +31-30-2206431 e-mail mruijterd@knmi.
 Lotos-Euros v1.7: validatierapport voor 10 en bias-correctie Martijn de Ruyter de Wildt en Henk Eskes KNMI, afdeling Chemie en Klimaat Telefoon +31-30-2206431 e-mail mruijterd@knmi.nl Conclusies Bias-correctie:
Aanpassing referentieniveau zandwinning: haalbaar of niet?
 Aanpassing referentieniveau zandwinning: haalbaar of niet? Lies De Mol, Koen Degrendele & Marc Roche Dienst Continentaal Plat Wettelijk kader KB 1 september 2004 Artikel 31 De totale ontginningsdiepte
Dienst Continentaal Plat
 Dienst Continentaal Plat Zand-en grindwinningin het Belgische deel van de Noordzee http://economie.fgov.be Belangrijkste taken Beheer van het Fonds voor Zandwinning Afleveren van vergunningen Beheer van
Hoe komen de annual air quality kaarten tot stand?
 Hoe komen de annual air quality kaarten tot stand? De annual air quality kaarten tonen het resultaat van een koppeling van twee gegevensbronnen: de interpolatie van luchtkwaliteitsmetingen (RIO-interpolatiemodel)
Climate impact on fish productivity: key mechanisms in North Sea plaice
 Climate impact on fish productivity: key mechanisms in North Sea plaice A.D. Rijnsdorp, R. van Hal, M. Hufnagl, R.D.M. Nash, A. Schroeder, L.R. Teal, I. Tulp, R. Witbaard, D. Beare, H.W. van der Veer Wageningen
SALV Strategische Adviesraad voor Landbouw en Visserij ADVIES
 SALV Strategische Adviesraad voor Landbouw en Visserij ADVIES advies naar aanleiding van de studie betreffende het opstellen van een lijst van potentiële Habitatrichtlijngebieden in het 26 maart 2010 2
NOORDZEE SYMPOSIUM 2007
 NOORDZEE SYMPOSIUM 2007 Indicatoren als wegwijzers Hannelore Maelfait Kathy Belpaeme Coördinatiepunt Duurzaam Kustbeheer Wist je dat Wist je dat er in 2004, 24 olielozingen op zee vanuit de lucht werden
IMDC. Voorkomen van HCBS lagen. Deltares. Mare Sas, Bas Van Maren, Mark Bollen. Workshop aanslibbing DGD 15 juni 2010
 Workshop aanslibbing DGD 15 juni 2010 Voorkomen van HCBS lagen Mare Sas, Bas Van Maren, Mark Bollen IMDC lwemarional M íihth: tv Dredging C.cvrt*iuLtftnt$ Deltares 1. Doei van de studie 2. Metingen inzake
Langdurige m etingen Deurganckdok: opvolging en analyse aanslibbing. Analyse van de aanslibbingsprocessen: een EM PIRISCH MODEL
 In tern atio n al M arine & Dredging C onsultants Langdurige m etingen Deurganckdok: opvolging en analyse aanslibbing Analyse van de aanslibbingsprocessen: een EM PIRISCH MODEL Boudewijn Decrop 20 mei
Projectnummer: B02047.000031.0100. Opgesteld door: dr.ir. B.T. Grasmeijer. Ons kenmerk: 077391437:0.3. Kopieën aan:
 MEMO ARCADIS NEDERLAND BV Hanzelaan 286 Postbus 137 8000 AC Zwolle Tel +31 38 7777 700 Fax +31 38 7777 710 www.arcadis.nl Onderwerp: Gevoeligheidsanalyse effecten baggerspecieverspreiding (concept) Zwolle,
ILVO Mededeling 236 VOORTGANGSRAPPORT EFFECTEN BAGGERLOSSINGEN. ILVO Instituut voor Landbouw-, Visserij- en Voedingsonderzoek.
 Hans Hillewaert ILVO ILVO Mededeling 236 juni 2017 VOORTGANGSRAPPORT EFFECTEN BAGGERLOSSINGEN periode 1 januari - 30 juni 2017 ILVO Instituut voor Landbouw-, Visserij- en Voedingsonderzoek www.ilvo.vlaanderen.be
Sedimenten stroming in de Zandvliet-en
 Ingenieursbureau S.D.Kamminga BV Sedimenten stroming in de Zandvliet-en Berendrechtsluizen Leidse WaUen 6A Postbus 7435 270 I AK Zoetermeer www.isdk.nl Ir. S.D.Kamminga Een korte inventarisatie Augustus
Begeleidingscommissie
 Begeleidingscommissie 21 september 2016, Oostende Monitoring campagnes Inhoud Inleiding CREST-project Testzones Monitoringsprogramma Inhoud Inleiding CREST-project Testzones Monitoringsprogramma INLEIDING
Meetcampagne in kader van aanslibbingsproblematiek haven en jachthavens van Nieuwpoort
 MINISTERIE VAN DE VLAAMSE GEMEENSCHAP DEPARTEMENT LEEFMILIEU EN INFRASTRUCTUUR ADMINISTRATIE WATERWEGEN EN ZEEWEZEN AFDELING WATERBOUWKUNDIG LABORATORIUM EN HYDROLOGISCH ONDERZOEK Meetcampagne in kader
Syntheserapport over de effecten op het mariene milieu van baggerspeciestortingen (vergunningsperiode )
") Syntheserapport over de effecten op het mariene milieu van baggerspeciestortingen (vergunningsperiode 2010-2011) Brigitte Lauwaert 1, Rosalia Delgado 5, Jozefien Derweduwen²; Lisa Devriese 2, Michael Fettweis
Syntheserapport over de effecten op het mariene milieu van baggerspeciestortingen (vergunningsperiode 2010-2011) Brigitte Lauwaert 1, Rosalia Delgado 5, Jozefien Derweduwen²; Lisa Devriese 2, Michael Fettweis
Monitoring baggerverspreiding Eemshaven: Data-analyse vaste en langdurige meetopstelling. Fase 3: baggerperiode november 2011 - februari 2012
 Monitoring baggerverspreiding Eemshaven: Data-analyse vaste en langdurige meetopstelling Fase 3: baggerperiode november 2011 - februari 2012 Inhoud 1 Inleiding 1 1.1 Algemene inleiding 1 1.2 Voorgaande
C OMES HET LICHTKLIMAAT EN DE SCHELDEBODEM IN BEWEGING
 HET LICHTKLIMAAT EN DE SCHELDEBODEM IN BEWEGING Oorsprong van Estuarien Zwevend Materiaal Schelde Estuarium Westerschelde Beneden Zeeschelde Boven-Zeeschelde Noordzee Schelde Rivier terug naar de rivier
P4P indicatorenset 2019
 INDICATORFICHE Patiëntenervaringen P4P indicatorenset 2019 Basisfiche Domein Patiëntenervaringen/ Patiëntgerichtheid Datum April 2019 Versie 2 (2019) Status Gevalideerd door de Expertengroep Patiëntenervaringen
P4P indicatorenset Domein Patiëntenervaringen/ Patiëntgerichtheid Datum April 2018 Versie 5 Status Gevalideerd door de werkgroep P4Q.
 INDICATORFICHE Patiëntenervaringen P4P indicatorenset 2018 Basisfiche Domein Patiëntenervaringen/ Patiëntgerichtheid Datum April 2018 Versie 5 Status Gevalideerd door de werkgroep P4Q Het meten van patiëntenervaringen
Remote sensing in perspectief. Van kenniscyclus naar beleidscyclus. Roeland Allewijn. Rijksinstituut voor Kust en Zee
 Remote sensing in perspectief Van kenniscyclus naar beleidscyclus Roeland Allewijn Rijksinstituut voor Kust en Zee Van jonge onderzoeker naar iets oudere manager De informatie- en kenniscyclus Van RS data
Fish Based Assessment Method for the Ecological Status of European Rivers (FAME)
") Fish Based Assessment Method for the Ecological Status of European Rivers (FAME) Overleg i.v.m. verdere verfijning en validatie van de nieuw ontwikkelde visindex op Europese schaal (EFI = the European
Fish Based Assessment Method for the Ecological Status of European Rivers (FAME) Overleg i.v.m. verdere verfijning en validatie van de nieuw ontwikkelde visindex op Europese schaal (EFI = the European
Iiv íd C Delta res. Aanslibbing Deurganckdok. Numerieke modelsimulaties met Slib3D. 15 Juni 2010
 Iiv íd C Delta res International Marine & Dredging Consultants E no bllh Q D 011Q LÍ f 0 5 Aanslibbing Deurganckdok Numerieke modelsimulaties met Slib3D Beschrijving Slib3D Calibratie hydrodynamica en
Management, Research and Budgetting of Aggregates in Shelf Seas in relation to End-users
 Management, Research and Budgetting of Aggregates in Shelf Seas in relation to End-users Beleid, onderzoek en budgettering van aggregaten in continentale zeeën in relatie tot eindgebruikers Federale Diensten
MONITORINGSPROGRAMMA MONITORINGSPROGRAMMA PROEFSTORTLOCATIES PROEFSTORTLOCATIES
 MONITORINGSPROGRAMMA MONITORINGSPROGRAMMA PROEFSTORTLOCATIES PROEFSTORTLOCATIES Een beschrijving van de uit te voeren monitoring bij de herhaling Een beschrijving van de van proefstortingen de uit te voeren
Speerpunt Ontwikkeling Havens
 Speerpunt Ontwikkeling Havens Dr. ir. Hadewych Verhaeghe Projectingenieur Afdeling Maritieme Toegang Departement Mobiliteit en Openbare Werken Ontwikkeling Havens haven van Zeebrugge en haven van Oostende
Assessment of dredginginduced
 Assessment of dredginginduced turbidity CEDA presentatie januari 2013 Walter Jacobs Hydronamic / Royal Boskalis Westminster Inleiding Inschatten van vertroebeling t.g.v. baggerwerken Assessment of dredging-induced
Kenmerk ZKS Doorkiesnummer +31 (0)
") Memo Aan LS Van Bas van Maren Kenmerk Doorkiesnummer +31 (0)88 33 58 365 Aantal pagina's 5 E-mail bas.vanmaren @deltares.nl Onderwerp DELWAQ-Slib_Eems-Dollard_j12_v01 metadata Waterkwaliteitsmodelschematisatie
Memo Aan LS Van Bas van Maren Kenmerk Doorkiesnummer +31 (0)88 33 58 365 Aantal pagina's 5 E-mail bas.vanmaren @deltares.nl Onderwerp DELWAQ-Slib_Eems-Dollard_j12_v01 metadata Waterkwaliteitsmodelschematisatie
Een rapport gemaakt in Pure. Voorbereid door: anonymous, Gebruiker, 7/05/19 9:01
 Een rapport gemaakt in Pure. Voorbereid door: anonymous, changeme@atira.dk Gebruiker, 7/05/19 9:01 Onderzoeksoutput Listing van Onderzoeksoutput 4DEMON: Centralization and valorization of 4 decades of
Bijlage 1.3 Bodemdaling in het Eems-Dollardgebied in relatie tot de morfologische ontwikkeling
 Bijlage 1.3 Bodemdaling in het Eems-Dollardgebied in relatie tot de morfologische ontwikkeling........................................................................................ H. Mulder, RIKZ, juni
Steef Peters (peters@waterinsight.nl) www.bluelegmonitor.com IVM-VU. Water Insight (2005) BlueLeg Monitor(2012)
 www.bluelegmonitor.com IVM-VU. Water Insight (2005) BlueLeg Monitor(2012)") WISP blauwalgen monitoring met remote sensing Steef Peters (peters@waterinsight.nl) www.bluelegmonitor.com Met enige illustraties uit: Blue-green catastrophe: NIOO PhD thesis by Stefan Simis en daaruit
WISP blauwalgen monitoring met remote sensing Steef Peters (peters@waterinsight.nl) www.bluelegmonitor.com Met enige illustraties uit: Blue-green catastrophe: NIOO PhD thesis by Stefan Simis en daaruit
Kenmerk ZKS Doorkiesnummer +31 (0) Onderwerp SWAN_Eems-Dollard_j12_v01 metadata Waterkwaliteitsmodelschematisatie
 Onderwerp SWAN_Eems-Dollard_j12_v01 metadata Waterkwaliteitsmodelschematisatie") Memo Aan LS Van Bas van Maren Kenmerk Doorkiesnummer +31 (0)88 33 58 365 Aantal pagina's 5 E-mail bas.vanmaren @deltares.nl Onderwerp SWAN_Eems-Dollard_j12_v01 metadata Waterkwaliteitsmodelschematisatie
Memo Aan LS Van Bas van Maren Kenmerk Doorkiesnummer +31 (0)88 33 58 365 Aantal pagina's 5 E-mail bas.vanmaren @deltares.nl Onderwerp SWAN_Eems-Dollard_j12_v01 metadata Waterkwaliteitsmodelschematisatie
HAVENECONOMIE EN ECOLOGIE:
 HAVENECONOMIE EN ECOLOGIE: (ON)VERZOENBAAR? Is een verdere scheldeverdieping mogelijk, gewenst, noodzakelijk? Jean Jacques Peters Raadgevend Ingenieur Leader Port of Antwerp International Expert Team Jean
BELGICA CRUISE 2010/16- REPORT
 BELGICA CRUISE 2010/16- REPORT UMONS/ MUMM/IMDC/FABRICOM Period: 31/05-02/06/2010 Subscribers Kevin Denis Université de Mons, Avenue du Champs de Mars 6, 7000 Mons Tel: +32 (0)65 373478, Email: Kevin.Denis@umons.ac.be
Milieu-effectenbeoordeling van het project ingediend door de AG Haven Oostende.
 KONINKLIJK BELGISCH INSTITUUT VOOR NATUURWETENSCHAPPEN BEHEERSEENHEID MATHEMATISCH MODEL VAN DE NOORDZEE AFDELING BEHEER VAN HET MARIENE ECOSYSTEEM Milieu-effectenbeoordeling van het project ingediend
AIO- SVT Zuiddijk INTECH DYKE SECURITY SYSTEMS. Rapportage InTech-IDS AIO-SVT Zuiddijk 2012 V02
 AIO- SVT Zuiddijk INTECH DYKE SECURITY SYSTEMS Eindrapport meetverslag piping Zuiddijk V02 IDS 12006 30 november 2012 1 van 10 Inhoudsopgave DEEL A FACTUAL REPORT... 3 1. ALGEMEEN:... 3 2. INSTRUMENTATIE
Beheerseenheid van het Mathematisch Model van de Noordzee RV BELGICA
 Beheerseenheid van het Mathematisch Model van de Noordzee Meetdienst Oostende RV BELGICA Rapport van de RV Belgica Meetcampagnes en Verankering van Meetsystemen MOMO 2 Project MOnitoring en MOdellering
PET-onderzoeken. Nationale diagnostische referentieniveaus in de nucleaire geneeskunde. Tweede iteratie ( )
") Nationale diagnostische referentieniveaus in de nucleaire geneeskunde Tweede iteratie (2017-2019) Vijfde periode (01/04/2018 30/06/2018) PET-onderzoeken 12/02/2019 Contact: Thibault VANAUDENHOVE Federaal
Nationale diagnostische referentieniveaus in de nucleaire geneeskunde Tweede iteratie (2017-2019) Vijfde periode (01/04/2018 30/06/2018) PET-onderzoeken 12/02/2019 Contact: Thibault VANAUDENHOVE Federaal
Toetsen van de frequentie van voorkomen van windsnelheid en golfhoogte tijdens stormperiodes.
 Vlaamse Overheid Oceanografisch Meteorologisch Station Toetsen van de frequentie van voorkomen van windsnelheid en golfhoogte tijdens stormperiodes. Maart 2010 Bestek 16EH/08/12 Opgemaakt door Bart Geysen
OPENBAAR EIND RAPPORT
 Project titel WiFi JIP (wave impacts on fixed wind turbines joint industry project) Project nummer : TKIW01002 (MARIN ref 25236) Versie : Versie 1 29092016 Project coördinator : Project partners : R&D
Energie uit getijstroming
 Royal Netherlands Institute for Sea Research Energie uit getijstroming Janine Nauw a, Marck Smit a, Walther Lenting a, Belen Blanco b, Jurre de Vries c, Herman Ridderinkhof, Hendrik van Aken en Mathijs
Hydrologisch Informatie Centrum. Maarten Deschamps 12/06/2014 Antwerpen
 Hydrologisch Informatie Centrum Maarten Deschamps 12/06/2014 Antwerpen WL-HIC WL-HIC Meetnet Sedimentolo gisch labo Databank Databeheer GISbeheer Validatie Voorspelling Permanentie Structuur HIC 1 steunpunt
ExxonMobil. Analyser Wensen. Arno van Adrichem
 Wensen Arno van Adrichem Opbouw Presentatie Waarom gebruiken we analysers Categorieën van analysers Validatie en calibratie Data acquisitie Data analyse Waarom gebruiken we analysers? Veiligheid, Gezondheid
Slibtransport door het Marsdiep op basis van veerbootmetingen (project nr. RKW-1700)
") Slibtransport door het Marsdiep op basis van veerbootmetingen (project nr. RKW-1700) Prepared for The RWS National Institute for Coastal and Marine Management by The Royal Netherlands Institute for Sea
Slibtransport door het Marsdiep op basis van veerbootmetingen (project nr. RKW-1700) Prepared for The RWS National Institute for Coastal and Marine Management by The Royal Netherlands Institute for Sea
Gegevensverwerving en verwerking
 Gegevensverwerving en verwerking Staalname - aantal stalen/replicaten - grootte staal - apparatuur Experimentele setup Bibliotheek Statistiek - beschrijvend - variantie-analyse - correlatie - regressie
Stuurgroepvergadering 20 mei 2008
 Stuurgroepvergadering 20 mei 2008 Doel studie Aanpak studie Beschikbare meetdata Benadering van de slibbalansberekening Resultaten Conclusies Dynamiek aanslibbing Deurganckdok (DGD)!"#$" !& 2 Deelopdrachten
Zeespiegelmonitor 2018
 Zeespiegelmonitor 2018 Wat is de aanleiding van dit rapport? Jaarlijks rapporteren Deltares en HKV met de Zeespiegelmonitor over de zeespiegelstijging langs de Nederlandse kust. De zeespiegel en het getij
OPENBAAR EIND RAPPORT
 Project titel WiFi II JIP (wave impacts on fixed wind turbines II joint industry project) Project nummer : TEW0314003 (MARIN ref 28845) Versie : Versie 1 31032017 Project coördinator : Project partners
Summary and samenvatting
 Samenvatting Dit proefschrift, met als titel Dik Water en Vloeibaar Zand Optische eigenschappen en methoden van remote sensing voor de extreem troebele Waddenzee onderzoekt in hoeverre data van het satelliet
ILVO Mededeling 208 VOORTGANGSRAPPORT EFFECTEN BAGGERLOSSINGEN. ILVO Instituut voor landbouwen visserijonderzoek
 Hans Hillewaert ILVO ILVO Mededeling 208 februari 2016 VOORTGANGSRAPPORT EFFECTEN BAGGERLOSSINGEN periode 1 juli - 31 december 2015 ILVO Instituut voor landbouwen visserijonderzoek www.ilvo.vlaanderen.be
CAMPAGNES BELGICA 2004
 Formulier A : Identificatie van de aanvrager 1. Instelling of Universiteit : 2. Afdeling of Dienst : 3. Naam van het Afdelingshoofd (of Diensthoofd) 4. Naam van de aanvrager : 5. Naam van een tweede persoon
Meetcampagne in kader van aanslibbingsproblematiek haven en jachthavens van Nieuwpoort
 MINISTERIE VAN DE VLAAMSE GEMEENSCHAP DEPARTEMENT LEEFMILIEU EN INFRASTRUCTUUR ADMINISTRATIE WATERWEGEN EN ZEEWEZEN AFDELING WATERBOUWKUNDIG LABORATORIUM EN HYDROLOGISCH ONDERZOEK Meetcampagne in kader
Rolweerstand van personenwagens op betonwegen
 Rolweerstand van personenwagens op betonwegen Wim Kramer Cement&BetonCentrum ir. Fred Reinink M+P Raadgevende ingenieurs bv ir. Jan Hooghwerff M+P Raadgevende ingenieurs bv Samenvatting In 2013 is een
Slibbalans-Zeeschelde DEELRAPPORT 7 - METINGEN HALFTIJ-EB BOVEN-ZEESCHELDE 2014
 Slibbalans-Zeeschelde DEELRAPPORT 7 - METINGEN HALFTIJ-EB BOVEN-ZEESCHELDE 2014 00_029 WL Rapporten Slibbalans-Zeeschelde Deelrapport 7 - Metingen halftij-eb Boven-Zeeschelde 2014 Plancke, Y.; Vereecken,
Uitdagingen bij de opbouw van massabalansen voor het beheer van ecosysteemdiensten. Dirk Vrebos, Jan Staes & Patrick Meire
 Uitdagingen bij de opbouw van massabalansen voor het beheer van ecosysteemdiensten. Dirk Vrebos, Jan Staes & Patrick Meire Inleiding De vraag naar waterkwaliteitsverbetering in Vlaanderen blijft hoog.
Stormvloed 1509. Geschiedenis van de Dollard
 Stormvloed 1509 Geschiedenis van de Dollard Op 19 september 2009 organiseerde de Stichting Verdronken Geschiedenis in de aula van het Ubbo Emmius Gymnasium te Leer (Ostfriesland) een symposium over de
1. Algemene meteorologische situatie
 Koninklijk Meteorologisch Instituut Wetenschappelijke Dienst meteorologische en klimatologische Inlichtingen Ringlaan, 3 B-1180 Brussel Tél.: +32 (0)2 373 0520 Fax : +32 (0)2 373 0528 Vlaamse Overheid
Slimme technologie brengt prehistorische landschappen en verdronken nederzettingen in kaart. Dr. Hans Pirlet
 Slimme technologie brengt prehistorische landschappen en verdronken nederzettingen in kaart Dr. Hans Pirlet Eindconferentie search-project 22 november 2016 Team Renard Centre of Marine Geology (RCMG, Ugent)
JPI Oceans Gezonde en productieve zeeën en oceanen
 JPI Oceans Gezonde en productieve zeeën en oceanen www.jpi oceans.eu OVERZICHT Terrein Governance Operationeel maken Strategic Research and Innovation Agenda Belgische deelname en interesse Outlook SRIA
1. Beschrijving van de numerieke modellen
 Bijlage 1: Hydrodynamische informatie, verkregen met behulp van numerieke modellen Dries Van den Eynde Beheerseenheid Mathematisch Model Noordzee (BMM) Gulledelle 100 B-1200, Brussel In deze Bijlage worden
Modellen, modellen, modellen. Henk Schuttelaars
 Modellen, modellen, modellen Henk Schuttelaars Modellen, modellen, modellen Wat gebeurt er in hydro- en morfodynamische modelstudies en hoe zijn de resultaten te interpreteren? Henk Schuttelaars Hier is
HANDLEIDING - ACTIEVE MOTORKRAAN
 M A N U A L HANDLEIDING - ACTIEVE MOTORKRAAN MANUAL - ACTIVE MOTOR VALVE Model E710877 E710878 E710856 E710972 E710973 www.tasseron.nl Inhoud / Content NEDERLANDS Hoofdstuk Pagina NL 1 ALGEMEEN 2 NL 1.1
Klimaatverandering Wat kunnen we verwachten?
 Klimaatverandering Wat kunnen we verwachten? Yorick de Wijs (KNMI) Veenendaal - 09 05 2019 Koninklijk Nederlands Meteorologisch Instituut 1 Klimaatverandering Oorzaken en risico s wereldwijd Trends en
Modelleren van turbulente warmte en vocht stromingen in de atmosfeer met behulp van warmtebeelden van het aardoppervlak.
 Modelleren van turbulente warmte en vocht stromingen in de atmosfeer met behulp van warmtebeelden van het aardoppervlak Wim Timmermans Modelleren van stroming in de lucht: wat Dit gaat over: Het vinden
BOORDVERSLAG BMM-Meetdienst Oostende CAMPAGNE 2004/26
 BOORDVERSLAG BMM-Meetdienst Oostende CAMPAGNE 2004/26 16.11.2004 tot en met 19.11.2004 INHOUDSTAFEL 1. Deelnemers 2. Objectieven van de campagne 3. Operationeel verloop 4. Opmerkingen betreffende meettechnische
ph-dynamiek Noordzee
 Royal Netherlands Institute for Sea Research ph-dynamiek Noordzee historische metingen, inzichten en perspectief dr. Steven van Heuven (NIOZ) prof.dr. Gert-Jan Reichart (NIOZ) met bijdragen van: prof.dr.
Notitie beheersvragen LTV-Slibmodel
 Opdrachtgever: RWS-RIKZ Notitie beheersvragen LTV-Slibmodel December 2006 WL delft hydraulics Opdrachtgever: RWS-RIKZ Notitie beheersvragen LTV-Slibmodel Ankie Bruens, Joris Vanlede, Thijs van Kessel Inhoud
Gebruik van flow cytometrie voor bepaling van de fytoplanktongemeenschap
 Gebruik van flow cytometrie voor bepaling van de fytoplanktongemeenschap Reinhoud de Blok 14 oktober 2016 Reinhoud.deblok@ugent.be Universiteit Gent: Wim Vyverman, Koen Sabbe Vlaams instituut voor de zee